Kansas Geological Survey, Open-file Report 2004-41
by
Jianghai Xia, Evan K. Franseen,
Richard D. Miller, and Thomas V. Weis
KGS Open-file Report 2004-41
August 2004
We successfully applied deterministic deconvolution to real ground-penetrating radar (GPR) data by using the source wavelet that was generated in and transmitted through air as the operator. The GPR data were collected with 400 MHz antennas on a bench adjacent to a cleanly exposed quarry face. The quarry site is characterized by horizontally bedded carbonate strata with shale partings. In order to provide groundtruth for this deconvolution approach, 23 conductive rods were drilled into the quarry face at key locations. The steel rods provided critical information for: 1) correlation between reflections on GPR data and geologic features exposed in the quarry face, 2) GPR resolution limits, 3) accuracy of velocities calculated from common midpoint data, and 4) identifying any multiples. Comparing the results of deconvolved data with non-deconvolved data demonstrates the effectiveness of deterministic deconvolution in low dielectric-loss media for increased accuracy of velocity models (improved at least 10 to 15% in our study after deterministic deconvolution), increased vertical and horizontal resolution of specific geologic features, and more accurate representation of geologic features as confirmed from detailed study of the adjacent quarry wall.
Keywords: ground-penetrating radar (GPR), source wavelet, deterministic deconvolution, carbonate strata
Over the last decade ground-penetrating radar (GPR) has been widely used in environmental, engineering, and groundwater investigations (e.g., Arcone et al., 1992; Arcone et al., 1998; Beres and Haeni, 1991; Olhoeft et al., 1994; Powers and Olhoeft, 1996a; 1996b; Annan, 1996; Young et al., 1997; Powers, 1997; Cardimona et al., 1998; Asprion and Aigner, 1999; Butler et al., 2000) as well as shallow sedimentary and stratigraphic studies (Arcone, 1996; Smith and Jol, 1992; Pratt and Miall, 1993; Gawthorpe et al., 1993; Beres et al., 1995; Bridge et al., 1995 and 1998; Jol et al., 1996; Sigurdsson and Overgaard, 1996; Liner and Liner, 1997; McMechan et al., 1997; 1998; Martinez et al., 1998a; 1998b; Young and Sun, 1999; Young et al., 1999; Vandenberghe et al., 1999; Beres et al., 1999; Augustinus et al., 1999; Dagallier et al., 2000; Kruse et al., 2000; Bano et al., 2000; Van Dam and Schlager, 2000).
Interpretation of subtle geologic features in GPR data depends on data resolution. Ringing (related to bandwidth) in GPR sections, as in seismic sections, negatively impacts resolution and therefore needs to be identified and reduced or eliminated. Deconvolution is essential for increasing the temporal resolution of seismic and GPR data. It is especially important for shallow GPR stratigraphic studies where optimal resolution for interpretation is critical. A few studies have successfully applied statistical deconvolution to GPR data (Turner, 1994; Todoeschuck et al., 1992; Neves et al., 1995; Gottsche et al., 1994; Porsani and Ursin, 1996; Moran et al., 2000). However, reflection multiples that are unaccounted for, or assumptions inherent to most statistical deconvolution models (e.g. assuming reflectivity is a random process), complicate these deconvolution approaches in natural sedimentary sites. This limitation shows the need to develop new strategies that improve the resolution of GPR data in shallow sedimentary rock studies. Our paper focuses on a method using deterministic deconvolution (Yilmaz, 1987, p. 93) to eliminate (partly) ringing effects in real GPR data.
The study site is a bench overlying Pennsylvanian limestone and interbedded thin shale layers of the upper Farley Member, which are exposed in a quarry near Bonner Springs, Kansas (Figure 1a). A lithological column (BSG1, Figure 1b) shows the carbonate strata of the quarry. These strata are vertically exposed for approximately 3 m along the quarry face and characterized by medium (< 0.15 m) to thick (0.3-0.9 m) beds of limestone separated by thin (< 2.5 cm) shale partings and stylocumulates (material that passively accumulated as insoluble residue along a pressure-solution surface). The shale partings and stylocumulates commonly diffuse into adjacent limestone over a scale of 0.5 cm to ~7.5 cm and are labeled with letters or symbols in Figure 1b.
Figure 1a. Line drawing showing the 30 m by 30 m two-dimensional grid on a flat bench behind an initial quarry face (BSG1) approximately 2.7-3.5 m (9-12 feet) thick. Successive quarry face exposures and twelve cores, provided initial groundtruth for GPR interpretations.
Figure 1b. Lithological column showing the carbonate strata of the quarry site in Bonner Springs, Kansas.
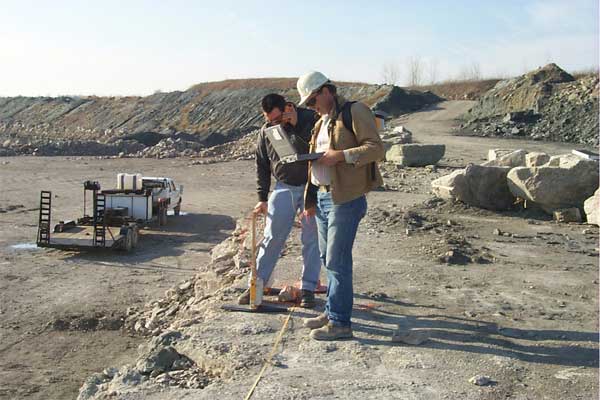
We drilled horizontal holes into the quarry face and inserted conductive metal rods, 1.5 m in length and 4.4 cm in diameter (Figure 2), in order to provide easily identifiable signatures on GPR profiles and to serve as known reflecting or diffracting points (Xia et al., 2001; 2003, Franseen et al., 2001). The steel rods provided critical information for: 1) correlation between reflections on GPR data and geologic features exposed in the quarry face, 2) GPR resolution limits, 3) accuracy of velocities calculated from common midpoint (CMP) data, and 4) identifying any multiples. For the convolution model, a GPR source wavelet was measured in the air. This model was then evaluated using deterministic deconvolution of GPR data acquired on a bench.
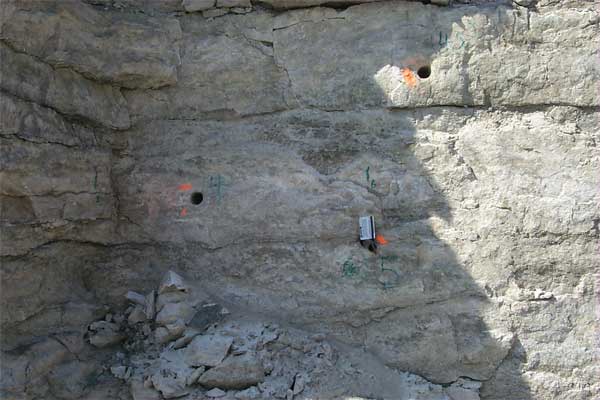
Figure 2a. Horizontal drilling to insert conductive metal rods, 1.5 m in length and 4.4 cm in diameter.
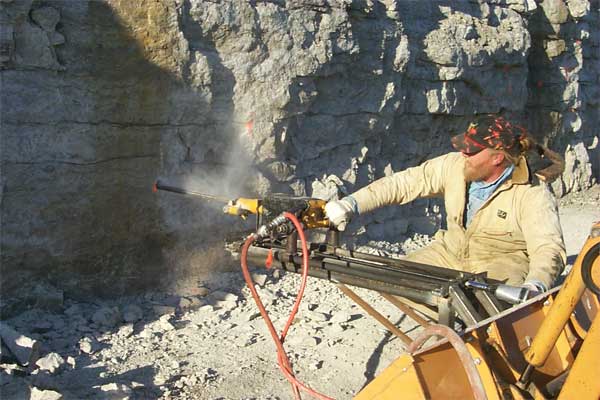
Figure 2b. A credit card serves as a scale for the horizontal holes.
Xia et al. (2003) discussed deterministic deconvolution with application to GPR data. Assuming no noise, surface GPR data can be expressed as the convolution model (Yilmaz, 1987, Eq. 2.31, p. 133), x(t) = s(t)*u(t)*e(t), where x(t) is the recorded GPR trace, s(t) is the source wavelet, u(t) is the unknown wavelet that includes the propagating effects in the earth and the response of the recording system, e(t) is the earth's reflectivity series or impulse response, and * denotes convolution. The convolution model relies on the fact that the source wavelet s(t) changes neither from place to place nor as a function of antenna-ground coupling. Effects of antenna ground coupling and EM energy propagating in the earth are unknown and result in wavelets u(t). Effects of this unknown wavelet become significant in high dielectric-loss media such as wet soil. Acquisition of this wavelet is difficult and site dependent, and statistical methods are necessary to remove it (e. g., Turner, 1994).
When GPR data are acquired in low dielectric-loss media like snow or the carbonate strata of our field site, effects of the unknown wavelet may be negligible. Thus, for these low-loss media the convolution model can be simplified as x(t) = s(t)*e(t). When the source wavelet s(t) is known, it can be removed using a method called deterministic deconvolution (Yilmaz, 1987, p. 93). In all cases, removal of the source wavelet s(t) has the potential to produce the highest possible resolution independent of data characteristics.
An earth reflectivity series can be defined using deterministic deconvolution, E(f) = X(f)/S(f), where E(f), X(f) and S(f) are the Fourier transforms of e(t), x(t), and s(t), respectively. If S(f) includes zeros in its spectra within a frequency range of interest, the denominator term can be damped according to Claerbout (1992, p. 86).
We acquired GPR data by using a MALÅ RAMAC system with a 370-V transmitter and 400 MHz antennas (producing 300 MHz signals). Source wavelets (512-fold vertical stacked) were acquired by placing the antennas pointed at each other and separated by 0.3 m, 0.6 m, and 0.9 m in an open field that was void of environmental and/or cultural noise (Xia et al., 2003). We assumed that reflection energy from the ground surface is very weak relative to the direct wave energy. The validity of this assumption is proven by steel rod tests described in the following sections.
Empirical determination of the optimum wavelet for the instrument was accomplished through repetitive application of deterministic deconvolution to a test data set using the source wavelets recorded at each offset. The wavelet characterized by its double peak in the time domain and extracted with 0.3-m separation (Figure 3) produced the best deconvolution results for 400 MHz antennas. The well-behaved spectrum of the 400 MHz antenna wavelet (no zero or near-zero values in the spectrum) and a dominant frequency of 300 MHz allowed direct and stable application of deterministic deconvolution to GPR data. This separation, however, resulted in some reverberations of the wavelet after the initial event (Figure 3a). Wavelets acquired at separations of 0.6 m and 0.9 m possess weaker reverberation, suggesting that the reverberations are apparently enhanced by the relatively close proximity of the two antennas.
Figure 3. (a) The wavelet (first 55 ns) of the 400 MHz antennas with 0.3-m separation in the time domain and (b) in the frequency domain.
We used exposures of the Pennsylvanian carbonate strata to demonstrate the effectiveness of deterministic deconvolution in improving temporal and spatial resolution of GPR data. We first placed ten steel rods into horizontally drilled holes at key locations along the quarry face, which provided first order groundtruth for all our GPR testing at this site. As stated above, reflections or diffractions from the rods were intended to aid the data interpretation. We then acquired 128-fold vertical stacked data every 0.1-m on a flat limestone bench 1 m behind the quarry face with the 400 MHz antennas while maintaining a 0.6 m source and receiver separation (Figure 4). A perpendicular-broadside antenna orientation was employed during acquisition.
Figure 4. GPR data were acquired on a flat limestone bench 1 m behind the quarry face with the 400 MHz antennas and 10-cm trace spacing.
Initial data processing was limited to a trapezoidal bandpass filter (80/130-400/500 MHz) and automatic gain control (AGC, a 10-ns window). The same data set was then compared before and after deterministic deconvolution. Two-way travel time of GPR data was converted into depth by electromagnetic velocities calculated from hyperbolic curve matching on CMP data (an example in Figure 5). The calculated velocities were in the range of 0.085 m/ns to 0.097 m/ns.
Figure 5. An example of CMP data to determined velocities: (a) non-deconvolved GPR data, (b) deconvolved GPR data, and (c) deconvolved GPR data with hyperbolic velocity curves (red). Letters or symbols on the apexes of hyperbola correspond to labeled limestone beds (Figure 1b). (d) and (e) are average spectra of raw and deconvolved data, respectively, from all traces without any other processing.
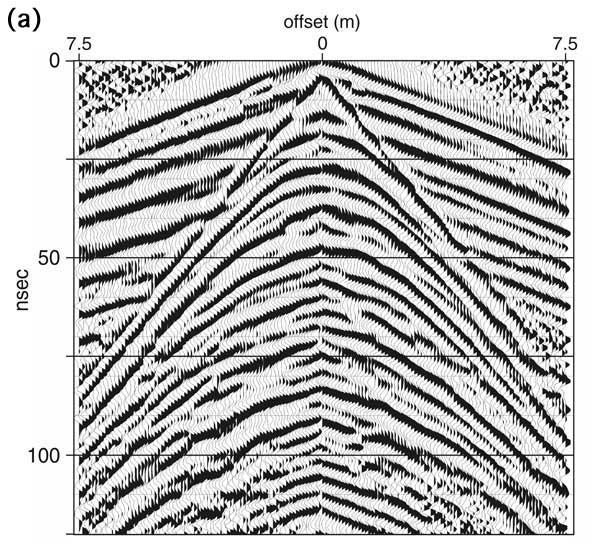
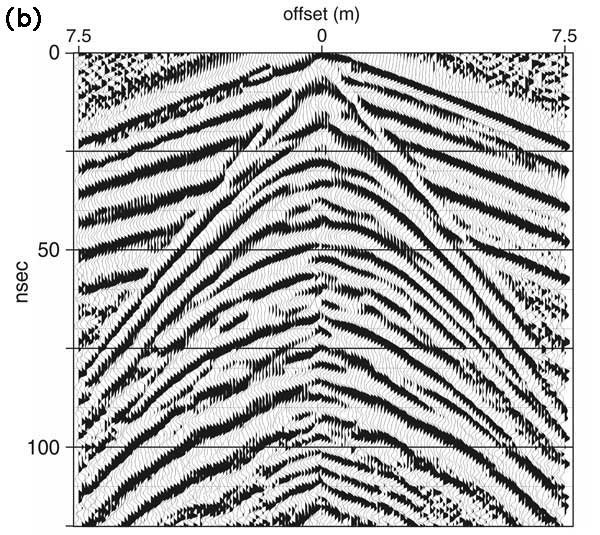
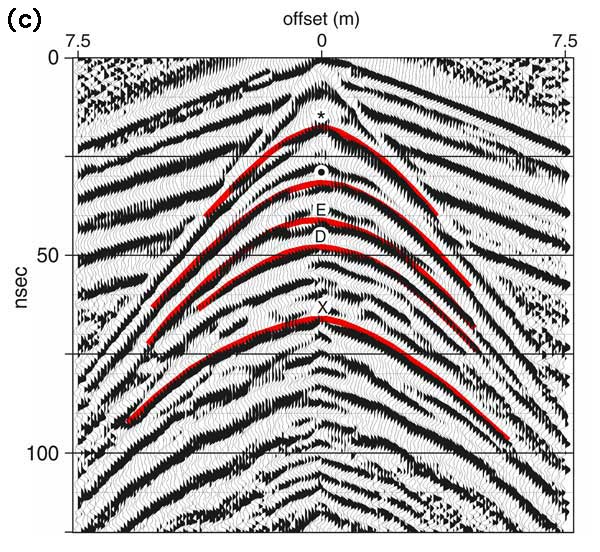
We compared travel times of the negative peaks at apices of the hyperbolas of pre- and post-deterministic deconvolution data (Figure 5). The travel times provided accurate assessment of the velocity model shown in Figure 5c based on dv/v = dt/t, where v and t are velocities and two-way travel times at apices, respectively; and dv and dt are the differences in velocities and two-way travel times between pre- and post-deterministic deconvolution data, respectively. The travel times of bed *, •, E, and D on non-deconvolved data (Figure 5a) were 10.7 ns or 17.2 ns, 24.7 ns, 34.2 ns, and 44.7 ns, respectively. The travel time of bed X was not easy to determine because of the ringing due to the source wavelet. The travel times of bed *, •, E, D and X on deconvolved data (Figure 5b) were 12.5 ns, 30.2 ns, 40.2 ns, 46.7 ns, and 63.2 ns, respectively. If sampling error is not taken into account (the sample interval was 0.25 ns in this example), accuracy of this velocity model was improved at least 10 to 15% after deterministic deconvolution.
Comparison of spectra of raw and deconvolved data can show effects of deterministic deconvolution in the frequency domain. The main difference between spectra of pre-(Figure 5d) and post-deterministic deconvolution data (Figure 5e) is that energy around frequency 250 MHz is subdued. Based on source wavelet spectra (Figure 3b), we know the subdued energy is from the source wavelet. An energy peak around 500 MHz (Figure 5e) is probably an artifact due to a minimum in the source wavelet spectra (Figure 3b). The artifact can be suppressed by a bandpass filter, as was done for this study.
Some reflections on non-deconvolved data (Figure 6a) appear to correlate with stratigraphic features observed in the field, but much of these data are very difficult to interpret due to a very complex wavelet interference pattern. Due to the limited temporal resolution of non-deconvolved GPR data (Figure 6a), it is not possible to confidently determine the locations of some of the horizontal steel rods.
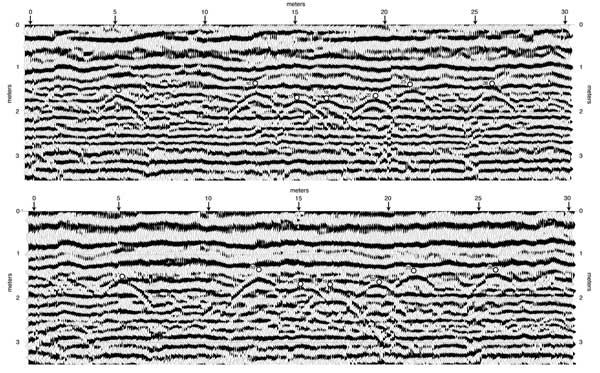
Figure 6. Profile recorded above ten steel rod locations along a 30-m line on a flat bench, 1 m behind the quarry face. (a) Non-deconvolved GPR data produced with 400 MHz antennas and (b) deconvolved GPR data (from Xia et al., 2003). Numbered circles indicate the locations of steel rods. A larger version of these figures is available.
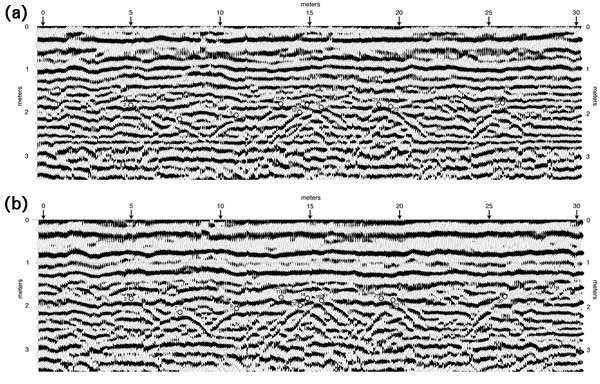
The direct benefit of deterministic deconvolution is compression of the wavelet ringing from the double peak wavelet into a single peak wavelet (Figure 6b). This effect is clearly evident with careful observation of the diffractions from the rods (e.g. 7, 9, 11, 12, 14, 16, and 27). The horizontal resolution improvement can be evaluated by looking at diffractions of rod 12, 14, and 16. We were not able to identify the whole hyperbolas of these rods in the non-deconvolved data (Figure 6a). However, it was much easier to recognize the complete hyperbolas associate with these rods on the deconvolved data (Figure 6b). The horizontal and vertical distances between rod 12 and 14 were 0.58 m (= 14.42 m-13.84 m) and 0.17 m (= 2.09 m-1.92 m), respectively, and deconvolved data provide horizontal resolution to at least 0.6 m at a depth of 2 m. The horizontal resolution improvement can also be demonstrated from hyperbolas of rod 21 and 23. The horizontal distance between the two rods was 0.85 m (= 19.40 m-18.55 m). We were only able to identify one apex of the diffractions somewhere between rod 21 and 23 in the non-deconvolved data (Figure 6a). The complete hyperbola from rod 23 and most of the hyperbola from rod 21 can be seen in the deconvolved data (Figure 6b). Most importantly, these two rods can clearly be interpreted as two separate objects on the deconvolved data. Diffractions from the rods on the deconvolved data can be more easily identified and allow: 1) reflections from specific geologic boundaries to be confidently traced along the entire line, 2) the geologic boundaries to be located accurately, and 3) reflections to be identified as primary reflections, not multiples.
GPR data, recorded after thirteen steel rods were inserted in new locations at shallower depths in Figure 7, and the vertical succession of rods in Figure 8 (rod 27 and 28 were also shown in Figure 6 and 7, respectively) along the same quarry face, further demonstrate the benefits of deterministic deconvolution. The rod diffractions (3, 10, 22, 25, and 28) are better resolved after deterministic deconvolution (Figure 7b) than before (Figure 7a). The same is true for the diffraction from rod 4, 17, 20, 27, 28, and 29 (compare Figure 8a and 8b). Reflections from geological boundaries can also be more clearly distinguished and interpreted after deterministic deconvolution.
Figure 7. Profile recorded along the same line as in Figure 6. In this example, the seven steel rods were placed at shallower depths than those in Figure 6. (a) Non-deconvolved GPR data produced with 400 MHz antennas and (b) deconvolved GPR data. Numbered circles indicate the locations of steel rods. A larger version of these figures is available.
The vertical resolution improvement can be demonstrated by hyperbolas from rod 26, 27, 28, and 29. These rods were placed between 1 m to 2 m below the quarry wall bench with a vertical separation of approximately 0.30 m to 0.35 m apart. Since the length of the wavelet of the 400 MHz antenna (Figure 3a) is 5-6 ns, any reflected events (including reflections from rods) with time intervals between them equal to or shorter than the length of the wavelet will interfere with each other and reduce the resolution power of GPR data. The average velocity of EM wave propagation in the carbonate strata at this site is 0.1 m/ns, which for the 400 MHz antennas (possessing a dominant frequency of around 300 MHz) equates to a maximum potential vertical resolution of around 0.25-0.30 m. Theoretically, two reflectors closer than 0.25-0.30 m vertically will not be resolvable. The vertical separations of rod 26, 27, 28, and 29 were approximately equal to the limit of the resolution power of this antenna. Because data were convolved with the source wavelet, the resultant interference created a complex pattern that made identification of individual hyperbolas difficult on non-deconvolved data (Figure 8a), especially for rod 27 and 29. Deterministic deconvolution removed the source wavelet so that all four hyperbolas could be identified in deconvolved data (Figure 8b).
Figure 8. Profile recorded along the same line as in Figures 6 and 7. In this example, eight steel rods were placed vertically at locations along the quarry face. (a) Non-deconvolved GPR data produced with 400 MHz antennas and (b) deconvolved GPR data. Numbered circles indicate the locations of steel rods. A larger version of these figures is available.
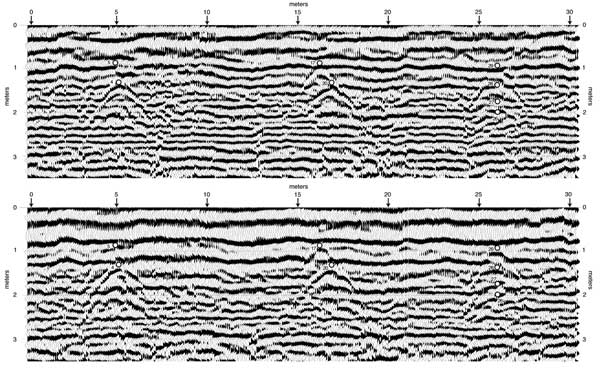
Figure 9 shows processed 400 MHz GPR data acquired along the same line as shown in Figures 6 to 8, but with no steel rods in the quarry face. In the following discussion, these data are compared with geologic features that were physically traced out on the quarry face (Figure 10).
Figure 9. Profile recorded along the same line as Figures 6 to 8 with no steel rods in the quarry face. (a) Non-deconvolved GPR data produced with 400 MHz antennas and (b) deconvolved GPR data (from Xia et al., 2003). A larger version of these figures is available.
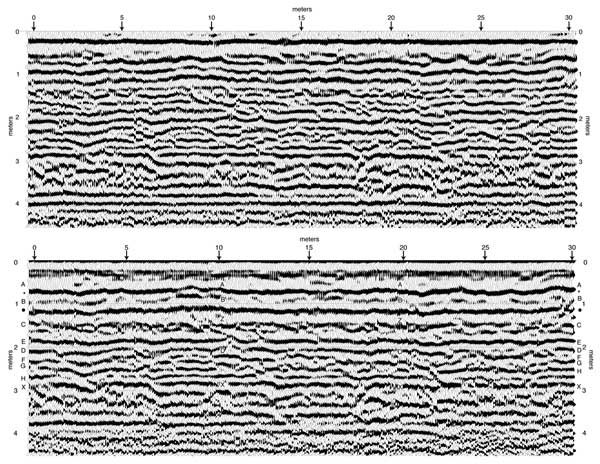
Figure 10. Outcrop photomosaic showing the nature of carbonate bedding and shale partings on the quarry face (BSG1). Numbers along the top of the quarry face show distance in meters. Numbers at bedding horizons show height in feet from the quarry floor. Letters and symbols are assigned to beds to facilitate comparison between the outcrop and results of GPR data. Numbered orange dots show locations of horizontal conductive rod experiments. A larger version of these figures is available.
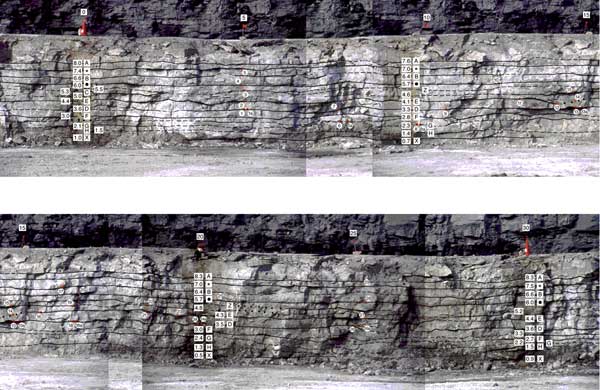
The outcrop photomosaic (Figure 10) shows that beds *, •, E, and X are distinct, laterally traceable beds with bedding planes characterized by relatively thick shale partings. Consistent with reflectivity estimations, these horizons are strong, laterally continuous reflections on deconvolved GPR data (Figure 9b). However, these horizons are neither clearly identifiable nor laterally continuous on non-deconvolved data (Figure 9a).
Beds A and B are distinct, laterally traceable horizons with boundaries characterized by lateral variations in shale concentration. Based on this variation, the GPR image of these beds would be expected to possess some variability in reflection wavelet character as a function of the differing shale concentration. The deconvolved data clearly show images of beds A and B and the varying reflection character (Figure 9b). Identification of beds A and B on non-deconvolved data is more complicated and requires identification of the more distinct * and • beds to use as a guide. However, even the * and • beds are also somewhat difficult to identify on non-deconvolved sections (Figure 9a).
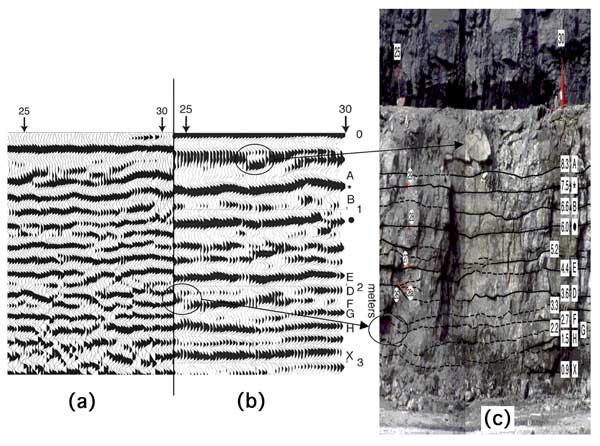
Enlarged portions from 25 m to 30 m of Figures 9 to 10 are shown in Figure 11. Comparing the deconvolved data (Figure 11b) with the photomosaic (Figure 11c), it is evident that deconvolved GPR data can correctly be interpreted with a vertical resolution to as much as 10 to 15 cm. Subtle changes identified on the quarry face are also identifiable on the enlarged portions of the deconvolved data. The circled reflection portion in Figure 11b is an apparent lateral effect from a portion of the limestone layer showing relief away from the quarry wall at 27 m and 0.3 m depth in Figure 11c. Additionally, the deconvolved data correctly show undulations of bed B and the smaller scale stratal complexities that occur between bed • and bed E. It is also worth pointing out that a slight dip in bed F identified on the quarry wall (circled on the left side of figure 11c) is identified as a dipping reflector on the deconvolved data (circled on the left side of the 25-m mark on Figure 11b). None of these features discussed above are resolvable on the non-deconvolved data (Figure 11a).
Figure 11. An enlarged portion from the 25 to 30 meter locations on the bench of Figures 9 and 10. (a) Non-deconvolved GPR data, (b) deconvolved GPR data, and (c) the photo of the quarry face with an exaggerated vertical scale to match that of the GPR data. See text for further explanations. A larger version of these figures is available.
Our study suggests that source wavelet interference in GPR data can be markedly suppressed using deterministic deconvolution that compresses the double-peak wavelet into a single-peak wavelet. Keys to our success include recording the GPR source wavelet for our particular GPR instrument, using conductive rods as subsurface markers, and correlating the data to a fresh quarry exposure. Since wavelets measured in the air are true source wavelets, changes in the antenna ground coupling or the geologic material being imaged has no impact on the effectiveness of deterministic deconvolution.
The quarry study site for our experiments is characterized by horizontally bedded carbonate strata with shale partings. We drilled horizontal holes into the quarry face and inserted conductive metal rods, 1.5 m in length and 4.4 cm in diameter (Figure 2) in order to provide easily identifiable signatures on GPR profiles and to serve as known reflecting or diffracting points.
We compared travel times of the negative peaks at apices of the hyperbolas associated with rod locations on pre- and post-deterministic deconvolution data. The travel times provided accurate assessment of the velocity model. Accuracy of this velocity model was improved at least 10 to 15% after deterministic deconvolution. The average velocity of EM wave propagation in the carbonate strata at this site is 0.1 m/ns, which for the 400 MHz antennas (possessing a dominant frequency of around 300 MHz) equates to a maximum potential vertical resolution of around 0.25-0.30 m. However, reflectors on the deconvolved GPR data had a resolution to as close as 10 to 15 cm vertical separation for some geologic features, as confirmed by quarry face observations and measurements. Finally, deconvolved GPR data provided a more accurate representation of geologic features as they appeared on the quarry face.
Our particular case study indicates that deterministic deconvolution can be successfully applied to reduce ringing in GPR data acquired from materials with low dielectric-loss, such as the lithified carbonate strata of this study. Additional research is needed to determine the utility and the unique requirements of deterministic deconvolution in other lithologic settings and evaluate deterministic deconvolution for various angles of reflector dip. The success of the deterministic deconvolution processing step for improving resolution and allowing direct correlation of GPR reflections to geologic features is providing us the opportunity for further analyses to be confidently conducted to determine the role of water saturation, porosity and mineralogy on specific GPR attributes (e.g. Franseen et al., 2001).
We thank Shawnee Rock, Inc., Bonner Springs, Kansas, especially Frank Rockers, and Owen Crome, for kindly providing access to the quarry study site, cooperating in design of the project, and assisting during data acquisition. We thank Joe Anderson for the horizontal drilling and Julian Ivanov and Choon Park for valuable discussions during data acquisition and processing. We appreciate S. A. Arcone, Peter Annan, and Milton Porsani for their critical and constructive review on the concept of the deterministic deconvolution. We thank Milan Beres and one anonymous reviewer for their thorough review of the manuscript and constructive suggestions. We also thank Mary Brohammer and Julia Shuklaper for assistance in preparation of this manuscript. This study was funded by the National Science Foundation (EAR 9912062) and the Kansas Geological Survey.
Annan, A.P., 1996, Ground penetrating radar (workshop notes): Sensors & Software Inc., Canada.
Arcone, S.A., Chacho, E.F., Jr., and Delaney, A.J., 1992, Short-pulse radar detection of groundwater in the Sagavanirktok River flood plain in early Spring: Water Resource Research, 28, p. 2925-2936.
Arcone, S.A., 1996, High resolution of glacial ice stratigraphy: A ground-penetrating radar study of Pegasus Runway, McMurdo Station, Antarctica: Geophysics, 61, p. 1653-1663.
Arcone, S.A., Lawson, D.E., Delaney, A.J., Strasser, J.C. and Strasser, J.D., 1998, Ground-penetrating radar reflection profiling of groundwater and bedrock in an area of discontinuous permafrost: Geophysics, 63, 1573-1584.
Asprion, U., and Aigner, T., 1999, Towards realistic aquifer models: three-dimensional georadar surveys of Quaternary gravel deltas (Singen Basin, SW Germany): Sedimentary Geology, 129, p. 81-297.
Augustinus, P.C., and Nichol, S., 1999, Ground-penetrating radar imaging of Pleistocene sediments, Boco Plain, western Tasmania: Australian Journal of Earth Sciences, 46, p. 275-282.
Bano, M., Marquis, Nivier, G., Maurin, J.C., and Cushing, M., 2000, Investigating alluvial and tectonic features with ground-penetrating radar and analyzing diffractions patterns: Journal of Applied Geophysics, 43, p. 33-41.
Beres, M., and Haeni, F.P., 1991, Application of ground-penetrating-radar methods in hydrogeologic studies: Ground Water, 29, p. 375-386.
Beres, M., Green, A.G., Huggenberger, P., and Horstmeyer, H., 1995, Mapping the architecture of glaciofluvial sediments with three-dimensional georadar: Geology, 23, p. 1087-1090.
Beres, M., Huggenberger, P., Green, A.G., and Horstmeyer, H., 1999, Using two- and three-dimensional georadar methods to characterize glaciofluvial architecture: Sedimentary Geology, 129, p. 1-24.
Bridge, J.S., Alexander, J., Collier, R.E.L., Gawthorpe, R.L., and Jarvis, J., 1995, Ground-penetrating radar and coring used to study the large-scale structure of point-bar deposits in three dimensions: Sedimentology, 42, 839-852.
Bridge, J., Collier, R., and Alexander, J., 1998, Large-scale structure of Calamus River deposits (Nebraska, USA) revealed using ground-penetrating radar: Sedimentology, 45, p. 977-986.
Butler, J., Franseen, E., Xia, J., Schulmeister, M., Zheng, L., Weis, T., Byrnes, A., Healey, J., and Miller, R., 2000, Experimental assessments of the utility of direct-push profiling and ground-penetrating radar for hydrostratigraphic investigations: SEPM/IAS Research Conference, Environmental Sedimentology--Hydrogeology of Sedimentary Aquifers, Santa Fe, NM, September 24-27, p. 26-27.
Cardimona, S.J., Clement, W.P., and Kadinsky-Cade, K., 1998, Seismic reflection and ground-penetrating radar imaging of a shallow aquifer: Geophysics, 63, p. 1310-1317.
Claerbout, J.F., 1992, Earth soundings analysis: Processing versus inversion, Blackwell Scientific Publications, Boston.
Dagallier, G., Laitinen, A.I., Malartre, F., Campenhout, I.P.A.M., and Veeken, P.C.H., 2000, Ground penetrating radar application in a shallow marine Oxfordian limestone sequence located on the eastern flank of the Paris Basin, NE France: Sedimentary Geology, 130, p. 149-165.
Franseen, E.K., Xia, J., Byrnes, A.P., Miller, R.D., Weis, T.V., and Washburn, E., 2001, Controls on Ground-penetrating Radar Reflections in Pennsylvanian Carbonate Strata: Implications for Processing and Attribute Analysis, Kansas Geological Survey, Open-file Report 2001-58, 51 p.
Gawthorpe, R.L., Collier, R.E., Alexander, J., Bridge, J.S., and Leeder, M.R., 1993, Ground-penetrating radar-Application to sandbody geometry and heterogeneity studies: Geological Society, Special Publication no. 73, p. 421-432.
Gottsche, F.M., Stolte, C., and Nick, K.P., 1994, Two-sided deconvolution: a method to improve the temporal resolution in radar data: Extended abstracts of 56th meeting of European Association of Exploration Geophysicists, P049, Vienna.
Jol, H.M., Smith, D.G., Meyers, R.A., and Lawton, D.C., 1996, Ground penetrating radar: high resolution stratigraphic analysis of coastal and fluvial environments, in Proc., GCSSEPM Foundation 17th Annual Research Conference Stratigraphic Analysis, 8-11 December 1996, Houston, TX, p. 153-163.
Kruse, S.E., Schneider, J.C., Campagna, D.J., Inman, J.A., and Hickey, T.D., 2000, Ground penetrating radar imaging of cap rock, caliche and carbonate strata: Journal of Applied Geophysics, 43, p. 239-249.
Liner, C.L., and Liner, J.L., 1997, Application of GPR to a site investigation involving shallow faults: Leading Edge, 16, p. 1649-1651.
Martinez, A., Franseen, E.K., and Beaty, D.S., 1998a, Application of Ground-Penetrating Radar to Sedimentologic and Stratigraphic Studies: Examples from Pennsylvanian Siliciclastics and Limestones in Kansas: Proceedings, Vol. 2, Seventh International Conference on Ground Penetrating Radar, University of Kansas, Lawrence, KS, p. 687-692.
Martinez, A., Kruger, J.M., and Franseen, E.K., 1998b, Utility of ground-penetrating radar in near-surface, high-resolution imaging of Lansing-Kansas City (Pennsylvanian) limestone reservoir analogs: Current Research in Earth Sciences, Kansas Geological Survey, Bulletin 241, part 3, p. 43-59. [Available online]
McMechan, G.A., Gaynor, G.C., and Szerbiak, R.B., 1997, Use of ground-penetrating radar for 3-D sedimentological characterization of clastic reservoir analogs: Geophysics, 62, p. 786-796.
McMechan, G.A., Loucks, R.G., Zeng, X., and Mescher, P., 1998, Ground penetrating radar imaging of a collapsed paleocave system in the Ellenburger dolomite, central Texas: Journal of Applied Geophysics, 39, p. 1-10.
Moran, M.L., Greenfield, R.J., Arcone, S.A., and Delaney, A.J., 2000, Delineation of a complexly dipping temperate glacier bed using short-pulse radar arrays: Journal of Glaciology, 46, p. 274-286.
Neves, F.A., Roulston, M.S., and Miller, J.A., 1995, Source signature deconvolution of ground penetration radar data: Revista Brasileira de Geofisica, 13(2), p. 143-153.
Olhoeft, G.R., Powers, M.H., and Capron, D.E., 1994, Buried object detection with ground penetrating radar: Proceedings of Unexploded Ordnance (UXO) Detection and Range Remediation Conference, Golden, CO, May 17-19, 1994, p. 207-233.
Porsani, M.J., and Ursin, B., 1996, Mixed-phase deconvolution of seismic and ground-penetrating radar data, Annual Meeting Abstracts, Society of Exploration Geophysicists, Denver, CO, p. 1603-1606.
Powers, M.H., 1997, Modeling frequency-dependent GPR: The Leading Edge, 16, p. 1657-1662.
Powers, M.H., and Olhoeft, G.R., 1996a, Computer modeling to transfer GPR UXO detectability knowledge between sites: Proceedings, UXO Forum 1996 Conference, Department of Defense Explosives Safety Board, March 26-29, 1996, Alexandria, VA, p. 347-356.
Powers, M.H., and Olhoeft, G.R., 1996b, Modeling of GPR response of leaking, buried pipes: in Bell, R.S., Cramer, M.H. (eds.), Proceedings of SAGEEP 1996, Annual Meeting of Environmental and Engineering Geophysical Society, Keystone, CO, p. 525-534.
Pratt, B.R., and Miall, A.D., 1993, Anatomy of a bioclastic grainstone megashoal (Middle Silurian, southern Ontario) revealed by ground-penetrating radar: Geology, 21, 223-226.
Sigurdsson, T., and Overgaard, T., 1996, Application of GPR for 3-D visualization of geological and structural variation in a limestone formation: Proceedings, Sixth International Conference on Ground Penetrating Radar, Sendai, Japan, 39-42.
Smith, D.G., and Jol, H.M., 1992, Ground-penetrating radar investigation of a Lake Bonneville delta, Provo level, Brigham City, Utah: Geology, 20, p. 1083-1086.
Todoeschuck, J.P., LaFlèche, P.T., Jensen, O.G., Judge, A.S., and Pilon, J.A., 1992, Deconvolution of ground probing radar data: in Ground penetrating radar, ed. J. Pilon, Geological Survey of Canada, paper 90-4, p. 227-230.
Turner, G., 1994, Subsurface radar propagation deconvolution: Geophysics, 59, p. 215-223.
Van Dam, R.L., and Schlager, W., 2000, Identifying causes of ground-penetrating radar reflections using time-domain reflectometry and sedimentological analyses: Sedimentology, 47, p. 435-450.
Vandenberghe, J., and van Overmeeren, R.A., 1999, Ground penetrating radar images of selected fluvial deposits in the Netherlands: Sedimentary Geology, 128, p. 245-270.
Yilmaz, Ö., 1987, Seismic data processing, Society of Exploration Geophysicists, Tulsa, OK.
Young, R.A., Deng, Z., Marfurt, K.J., and Nissen, S.E., 1997, 3-D dip filtering and coherence applied to GPR data: A study: The Leading Edge, 16, 921-928.
Young, R.A., and Sun, J., 1999, Revealing stratigraphy in ground-penetrating radar data using domain filtering: Geophysics, 64, p. 435-442.
Young, R.A., Peterson, B., and Slatt, R., 1999, Imaging of turbidite outcrop analogs using ground-penetrating radar: Annual Meeting Abstracts, Society of Exploration Geophysicists, Houston, TX, p. 429-432.
Xia, J., Weis, T.V., Franseen, E.K., and Miller, R.D., 2001, Ground truth of ground-penetrating radar data at a limestone quarry: Proceedings of SAGEEP 2001, Annual Meeting of Environmental and Engineering Geophysical Society, March 4-7, 2001, Denver, CO, 12 pp, available on CD.
Xia, J., Franseen, E.K., Miller, R.D., Weis, T.V., and Byrnes, A.P., 2003, Improving ground-penetrating radar data in sedimentary rocks using deterministic deconvolution: Journal of Applied Geophysics, 54, p. 15-33.
Kansas Geological Survey, Geophysics
Placed online Feb. 10, 2006
Comments to webadmin@kgs.ku.edu
The URL for this page is http://www.kgs.ku.edu/Geophysics/OFR/2004/OFR04_41/index.html