


Kansas Geological Survey, Open-file Report 2001-10
Feasibility Study on Using the Electromagnetic Method to Locate Abandoned Brine Wells in Hutchinson, Kansas
by Jianghai Xia
Kansas Geological Survey
1930 Constant Avenue, Campus West
Lawrence, KS 66047
KGS Open File Report 2001-10
April 2001
Summary
An electromagnetic (EM) survey was conducted in Hutchinson, Kansas, as a part of effort to locate abandoned brine wells. EM anomalies identified in the field were verified immediately. Although no brine well was found on the proposed sites, the EM survey was successful from a geophysical point of view because it showed promise and effectiveness in locating the brine wells.
Introduction
On January 17, 2001, a natural gas explosion and fire destroyed two downtown Hutchinson businesses. The next day at a mobile home park 3 miles away, another explosion occurred. Two residents died of injuries from the explosion, which forced the evacuation of hundreds of people as gas geysers began erupting in the area. The geysers spewed a mixture of natural gas and saltwater. The pathways to the land surface at both the explosion sites and the geysers were abandoned brine wells used for solution mining of salt (http://www.kgs.ku.edu/Hydro/Hutch/Background/index.html).
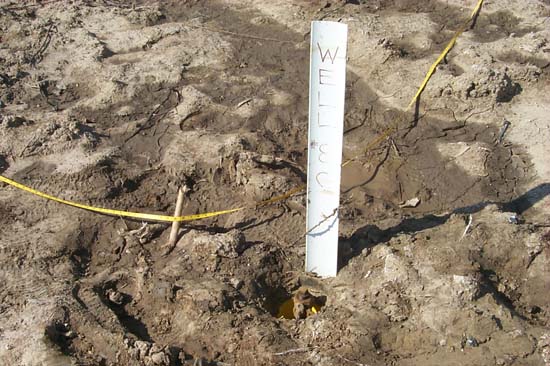
To find these abandoned brine wells is a part of the Hutchinson Response Project. Some known wells in the mobile home park had steel cased pipes (Figure 1). The length of vertical steel pipe normally is 400 - 700 ft. The maximum gravity signal cased by this pipe is only 4 - 6 microGal. The predicted anomaly is too weak to use a microgravity survey to find these wells because the sensitivity of the most advanced gravity meter is at a one microGal level. A ground penetrating radar (GPR) survey may be useful to locate these wells. The ground is dirt fill, however, and there could be a lot of reflected/diffracted events caused by objects other than the brine wells. Furthermore, time spent on GPR data acquisition and processing could be much longer than people expect.
Figure 1. Well 8C, the abandoned brine well
where the explosion occurred in the mobile home park.
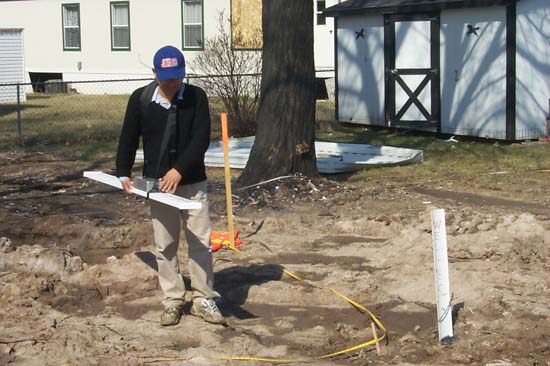
I proposed to use the eletromagnetic (EM) method to search for wells. A GEM2 (Figure 2) is an EM instrument that can survey an area quickly and with great detail (Won, 1980). Data can transferred into a notebook computer and maps generated within a few minutes after the survey is done. The GEM2 is a portable, digital, broadband electromagnetic sensor. Multi-frequency data are acquired simultaneously with a maximum sampling rate of 30 Hz when an instrument operator walks along a survey line. For each frequency, both in-phase and quadrature components of the induced EM field in ppm (parts per million relative to the primary field) were recorded. The measured in-phase and/or quadrature responses can be used to calculate apparent conductivity based on a homogeneous half-space assumption by Won et al. (1996 and 1997). Apparent conductivity is a parameter that in general is related to targeted electrical properties and has units of conductivity. Apparent conductivity is a method of normalization of the EM data; it makes data analysis and interpretation easier for both geophysicists and other scientists. If the earth were truly homogeneous, the apparent conductivity would be the same at all frequencies and equal the true earth conductivity data (Huang and Won, 2001). In the real world, conductivity measurements are "bulk" or apparent conductivity. We will omit a word "apparent" in the later discussion and figures.
Figure 2. Photo of GEM2 in operation.
Quadrature data are proportional to the ground conductivity in the low to middle induction numbers, but are inversely proportional to the conductivity at middle to high induction numbers. Thus, a moderate conductor may produce a strong quadrature anomaly, whereas a good conductor may produce a weak anomaly or no anomaly. In either case in-phase data have to be used for further analysis (Huang and Won, 2001). An anomaly shown on conductivity maps should also show on in-phase and/or quadrature data. The investigation depth is dependent on frequency of the instrument used in the survey. There is no exact relation between instrument frequency and the investigation depth.
Methodology
Three frequencies were chosen for this project: 2430 Hz, 7290 Hz, and 18270 Hz. For each frequency, both in-phase and quadrature components of the induced EM field in ppm were recorded. EM signals from a known well were first recorded to determine what kind of anomaly would be identified as possible buried wells. The signals then were compared with EM reconnaissance results acquired on an assigned area.
EM signals from Well 8C
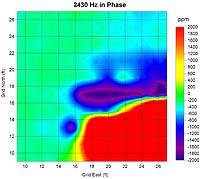
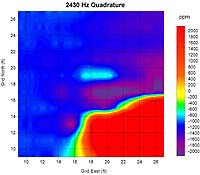
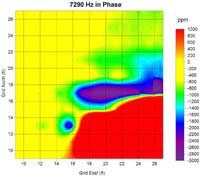
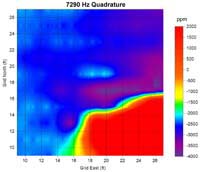
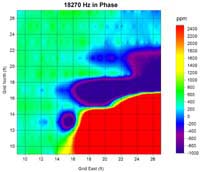
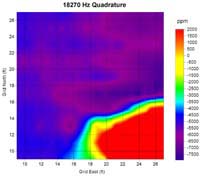
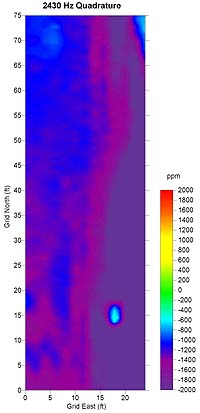
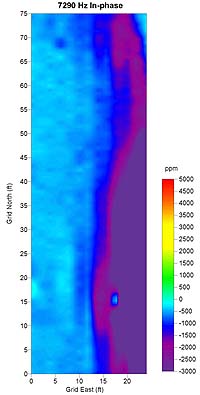
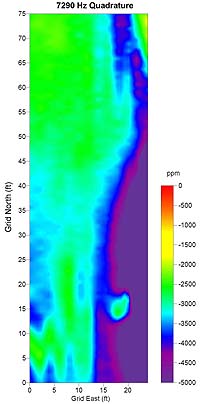
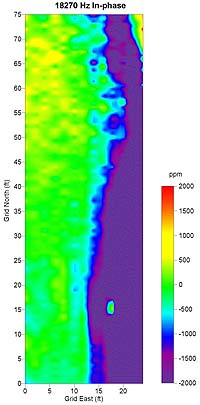
Well 8C is the well that cost two people their lives (Figure 3). I acquired GEM2 data on an area 18 ft by 18 ft along lines with 2 ft spacing (Figure 4). Well 8C is located at point (19, 17). The signals from the well are all negative bulls-eyes in both in-phase and quadrature components (Figures 5a - 5f). A positive anomaly in the southeast corner is caused by rebar in the driveway. Amplitudes of signals with 2430 Hz from the well are much higher than signals with the other two frequencies (Table 1).
Figure 3. A view of the area around well 8C.
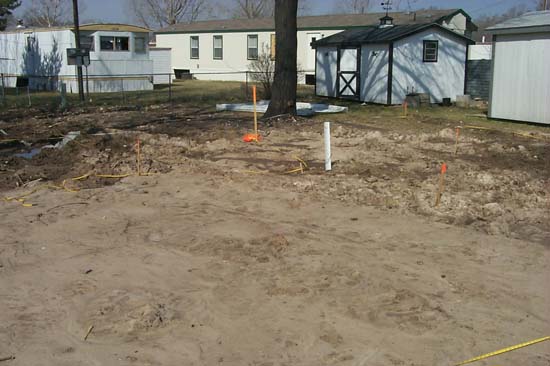
Figure 4. Pattern of data acquisition.
| Well 8C--Click on figures to view larger versions |
|
Figure 5a. 2430 Hz in Phase.
|
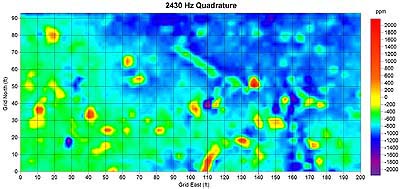
Figure 5b. 2430 Hz Quadrature.
|
|
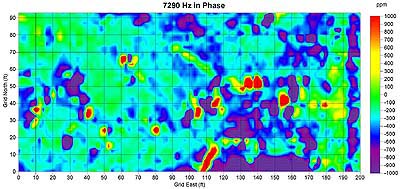
Figure 5c 7290 Hz in Phase.
|
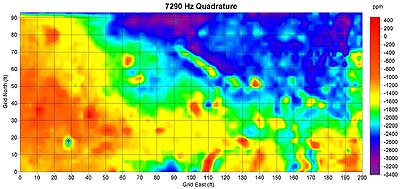
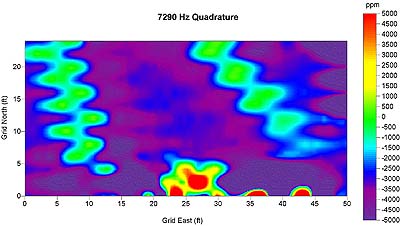
Figure 5d 7290 Hz Quadrature.
|
|
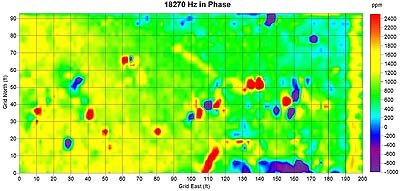
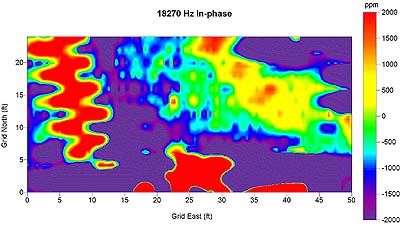
Figure 5e 18270 Hz in Phase.
|
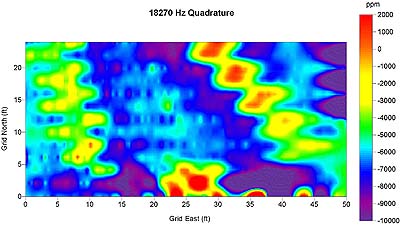
Figure 5f 18270 Hz Quadrature.
|
Table 1. Amplitudes (in ppm) of EM signals from well 8C.
| 2430 Hz (I) |
2430 Hz (Q) |
7290 Hz (I) |
7290 Hz (Q) |
18270 Hz (I) |
18270 Hz (Q) |
| 1700 |
1200 |
2500 |
1700 |
2700 |
2000 |
When using the signals to compare with data from an assigned area, two characters may be changed. The depth of a well header affects the size of a bulls-eye and amplitude of signals. The deeper the well is, the broader (in horizontal dimensions) the bulls-eye and the lower the amplitude. Abandoned wells were normally buried 3 - 4 ft under the ground. The signals from well 8C are the signals from a well header on the ground. Thus, the bulls-eye anomalies from buried wells should be broader than the bulls-eye (Figure 5) from well 8C with a normally lower amplitude.
EM Survey on the Southwest Corner of 11th and Chemical Streets
A 200 ft by 180 ft grid was surveyed on the on the southwest corner of 11th and Chemical Streets (Site 1 in Figure 6). Due to a data-storage limitation on the GEM2, the EM survey was split into a south part (from 0 to 93 ft) and north part (from 93 ft to 180 ft). The EM survey was performed by walking along lines, with 3 ft between lines. (The survey was done the same as shown in Figure 4, except for the line spacing.) Total survey length is 12,000 ft. It took two persons 5 hours to lay out grids and to finish the EM survey.
Figure 6. Location map of project areas.
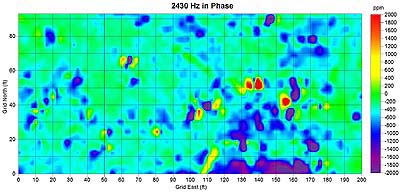
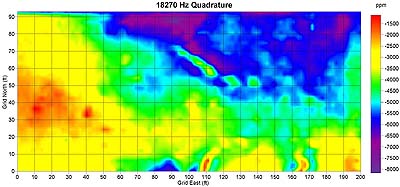
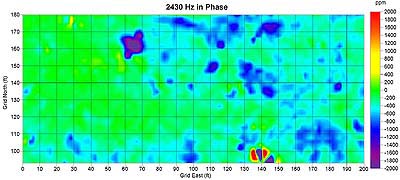
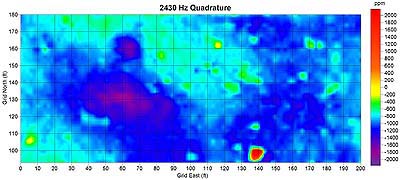
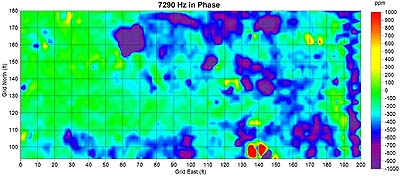
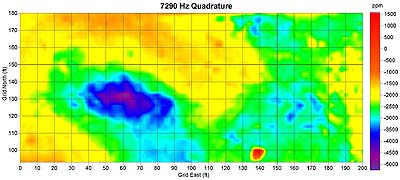
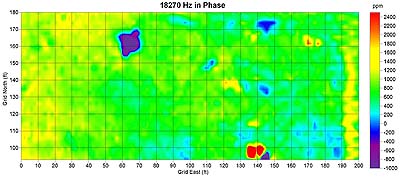
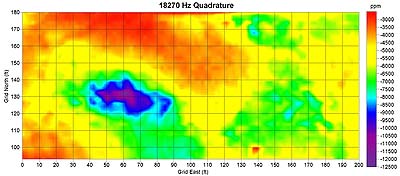
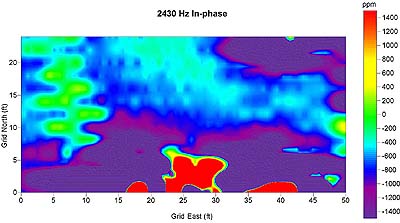
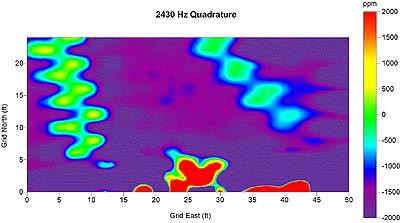
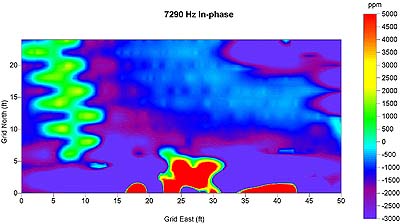
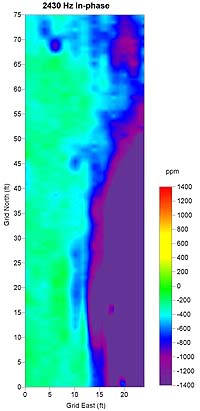
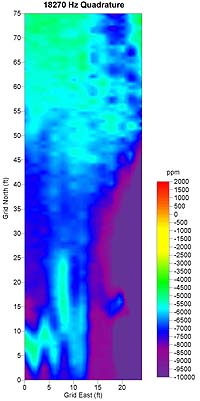
Figures 7a - 7f and Figures 8a - 8f present the south and north parts of the GEM2 results, respectively. The linear anomaly along a line (x = 195) in 7290 and 18270 Hz was caused by a gas pipe line. Anomaly 1 was identified at point (65, 161) (Table 2). No bulls-eyes were shown on quadrature components with 7290 Hz and 18270 Hz. For the lower frequency (2430 Hz) signals (Figure 8b), however, a broader and negative bulls-eye anomaly with lower amplitude clearly showed up. This anomaly also showed up on in-phase results with all three frequencies (Figure 8a, 8c, and 8e). This anomaly may be caused by a buried well.
South survey, Corner of 11th and Chemical
Click on figures to view larger versions |
|
Figure 7a. 2430 Hz in Phase.
|
|
Figure 7b. 2430 Hz Quadrature.
|
|
Figure 7c 7290 Hz in Phase.
|
|
Figure 7d 7290 Hz Quadrature.
|
|
Figure 7e 18270 Hz in Phase.
|
|
Figure 7f 18270 Hz Quadrature.
|
North survey, Corner of 11th and Chemical
Click on figures to view larger versions |
|
Figure 8a. 2430 Hz in Phase.
|
|
Figure 8b. 2430 Hz Quadrature.
|
|
Figure 8c 7290 Hz in Phase.
|
|
Figure 8d 7290 Hz Quadrature.
|
|
Figure 8e 18270 Hz in Phase.
|
|
Figure 8f 18270 Hz Quadrature.
|
Table 2. Amplitudes (in ppm) of EM signals from anomaly 1 at point (65, 161).
| 2430 Hz (I) |
2430 Hz (Q) |
7290 Hz (I) |
7290 Hz (Q) |
18270 Hz (I) |
18270 Hz (Q) |
| 2900 |
900 |
3500 |
n/a |
3600 |
n/a |
The second anomaly was identified at point (137, 99). This anomaly showed a high-low-high pattern in in-phase components (Figures 8a, 8c, and 8e) and a positive bulls-eye shape in quadrature components of three frequencies (Figures 8b, 8d, and 8f). The source for this anomaly was interpreted as something like metal junk but was not believed to be caused by a brine well.
The third anomaly was identified at point (137, 53). This anomaly showed the same pattern as the second anomaly. This anomaly showed a high-low-high pattern in in-phase components (Figures 7a, 7c, and 7e) and a positive bulls-eye shape in quadrature components of three frequencies (Figures 7b, 7d, and 7f). The source for this anomaly was also interpreted as possibly metal junk but not a brine well.
The fourth anomaly was not identified in the field. It is located at (110, 40). This anomaly showed a negative bulls-eye on all components except for the 18270 Hz quadrature component (Figures 7a - 7f). The 2430 Hz results showed the highest amplitude in three frequencies (Table 3). Comparing Table 3 with Table 1, we think this anomaly may be caused by a buried well.
Table 3. Amplitudes (in ppm) of EM signals from anomaly 4 at point (110, 40).
| 2430 Hz (I) |
2430 Hz (Q) |
7290 Hz (I) |
7290 Hz (Q) |
18270 Hz (I) |
18270 Hz (Q) |
| 2800 |
1400 |
3600 |
700 |
3600 |
n/a |
Verifications of Anomalies
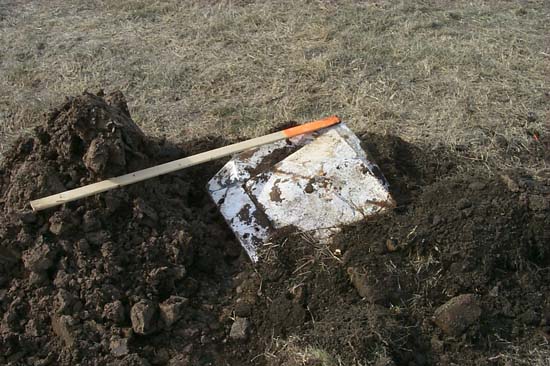
A backhoe was immediately called to dig up the first three anomalies. Anomaly one was caused by buried steel pipes (Figure 9 and the photo on this report cover) but not a brine well. Anomaly two was caused by several pieces of junk metals. I did not get a chance to take a photo because I was performing another EM survey at Site 2 (East 8th Street). Anomaly three was caused by a sheet of metal (Figure 10).
Figure 9. Anomaly one was caused by buried steel pipes.
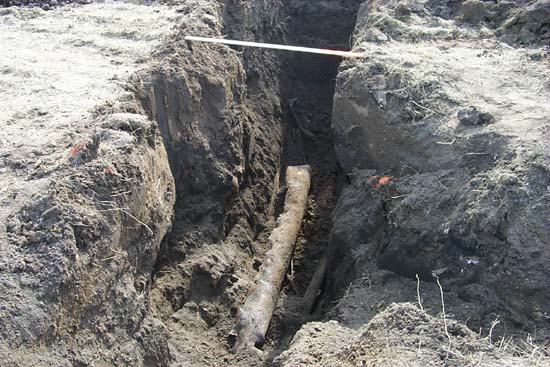
Figure 10. Anomaly two was caused by several pieces of junk metal.
Anomaly four was not identified in the field so it has not been verified so far.
EM Survey around the Office Building of Rawhide Trucking, Inc.
Gas was found next to the office building of Rawhide Trucking, Inc. Two patches around the office building were surveyed by GEM2 (Site 2 in Figure 6). The first patch was 24 ft by 50 ft with east-west survey lines spaced 2 ft apart (Figures 11a - 11f) and the second patch was 24 ft by 75 ft with north-south survey lines that were spaced 2 ft apart (Figures 12a - 12f).
First area, Office Building of Rawhide Trucking
Click on figures to view larger versions |
|
Figure 11a. 2430 Hz in Phase.
|
|
Figure 11b. 2430 Hz Quadrature.
|
|
Figure 11c 7290 Hz in Phase.
|
|
Figure 11d 7290 Hz Quadrature.
|
|
Figure 11e 18270 Hz in Phase.
|
|
Figure 11f 18270 Hz Quadrature.
|
Second area, Office Building of Rawhide Trucking
Click on figures to view larger versions |
|
Figure 12a. 2430 Hz in Phase.
|
Figure 12b. 2430 Hz Quadrature.
|
|
Figure 12c 7290 Hz in Phase.
|
Figure 12d 7290 Hz Quadrature.
|
|
Figure 12e 18270 Hz in Phase.
|
Figure 12f 18270 Hz Quadrature.
|
By comparing Figures 11 and 12 with signals from well 8C (Figure 4), it is easy to conclude that there was no anomaly that could be caused by brine wells. In Figure 11, one anomaly at approximately (25, 4) was caused by an air-conditioner water-drain system. This anomaly was strong and visible on both in-phase and quadrature components of three frequencies. Two linear anomalies with a northwest-southeast orientation were caused by a gas pipe and a water pipe. Theoretical speaking, anomalies due to utility pipes should be shown in a straight line pattern. The zigzag pattern shown in Figure 11 is due to the way the operator walked along the lines and the horizontal resolution of the GEM2. The quadrature results (Figures 11b, 11d, and 11f) possess higher resolution than in-phase results (Figures 11a, 11c, and 11e).
In patch 2 (Figure 12), one anomaly located at point (17, 15) was caused by the steel cap of a septic tank. It was visible on both components of three frequencies.
Conclusions
All anomalies identified on the EM results were verified in the field immediately after the survey was completed. One more anomaly (anomaly 4) needs to be verified. The sources of anomalies were consistent with preliminary interpretation in the field. The EM survey by a GEM2 in Hutchinson was successful from a geophysical perspective. Results of the EM survey by a GEM2 in Hutchinson showed promise and effectiveness in locating abandoned brine wells.
Acknowledgments
We greatly appreciate Dennis Clennan and Stephen William of the City of Hutchinson for their advice in locating the test site. We thank Kyle Parker of the Kansas Department of Health and Environment and Sihao Xia of the University of Kansas for their assistant in data acquisition. We also thank Mary Brohammer for her efforts in preparation of this report.
References
Huang, H, and Won, I.J., 2001, Conductivity and susceptibility mapping using broadband electromagnetic sensors: Proceedings of the Symposium on the Application of Geophysics to Engineering and Environmental Problems (SAGEEP 2001), March 4-7, 2001, Denver, CO.
Won, I.J., 1980, A wideband electromagnetic exploration method--Some theoretical and experimental results: Geophysics, 45, 928-940.
Won, I.J., Keiswetter, D., Hanson, D., Novikova, E., and Hall, T. 1997, GEM-3: A Monostatic Broadband Electromagnetic Induction Sensor: Journal of Environmental and Engineering Geophysics, 2, No. 1, pp. 53-64.
Won, I.J., Keiswetter, D.A., George, R. A. Fields, and Sutton. L.C., 1996, GEM-2: A new multifrequency electromagnetic sensor: Journal of Environmental & Engineering Geophysics, 1, 129-137.
Kansas Geological Survey, Geophysics
Placed online April 2001
Comments to webadmin@kgs.ku.edu
The URL for this page is http://www.kgs.ku.edu/Geophysics/OFR/2001/10/index.html