Kansas Geological Survey, Open-file Report 2000-4
by Richard D. Miller,
Choon B. Park,
Julian M. Ivanov,
Jianghai Xia,
David R. Laflen,
and Chadwick Gratton
Kansas Geological Survey
KGS Open-file Report 2000-4
January, 2000
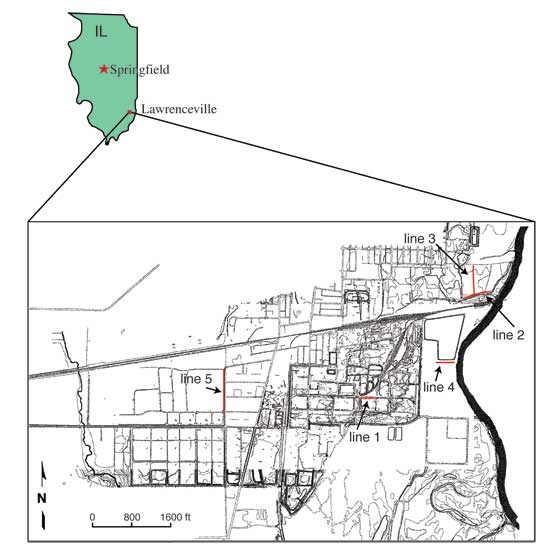
The shear wave velocity field, calculated using the Multi-channel Analysis of Surface Waves (MASW) method (Park et al., 1999; Xia et al., 1999), and disturbances observed in the groundroll wavetrain transformations (phase and amplitude) were used to help identify variability in the lateral continuity of near-surface layers beneath asphalt roads within the Lawrenceville Refinery, settling ponds in and around the refinery property, surface remediated burial pits, and containment berms (Figure 1). Depths of investigation extended from a few feet below ground surface (BGS) to as much as 100 ft BGS on line 5. Anomalies interpreted within the soft sediments along all five lines are related to lateral changes in material properties. Confirmation and/or enhancement of interpretations of these data will require subsurface sampling. When comparing results from this study to previous investigations using this surface wave imaging technology at sites around the country (Miller and Xia, 1999a; Miller and Xia, 1999b; Miller et al., 1999), it is interesting to note that in most cases interpreted zones of anomalous material possess a unique velocity pattern somewhat universally consistent with all features of the same kind (subsidence, fractures, bedrock, etc.). In most cases, low velocity closures within the shear wave velocity field are indicative of "anomalies." Each profile collected in association with this feasibility test at the Lawrenceville Refinery was designed with a specific imaging objective in mind. The success of each profile can only be determined by a drilling program specifically designed to evaluate these findings.
Figure 1. Site map and location of seismic lines.
Calculating the shear wave velocity field from surface wave arrivals can generally be accomplished with a high degree of accuracy regardless of cultural noise or obstacles. Data for this study were acquired in and around areas with occupied personal residences, railroad noise, site demolition activities, and normal industrial background noise (60 Hz, running motors, vehicle activity, etc.). A wide range of surface conditions required adaptations be made to optimize source and receiver coupling to cement and asphalt. Care was taken to insure no data carried artifacts related to surface features or background noise and that all data were acquired with special attention placed on the spread location relative to surface materials and structures. Comparisons of data characteristics recorded from geophones with steel baseplates to those with spikes revealed no significant difference in wavetrain properties or calculated dispersion curves. Unlike recording concerns prominent when using other types of acoustic waves, surface waves seem to have only limited dependence on changes in receiver coupling. Non-source noise recorded on surface wave data reduces the quality of the dispersion curve but does not usually prevent an accurate and robust inversion.
MASW provides shear wave velocity profiles that accurately (15%) represent average shear wave velocities for a particular subsurface volume (Xia et al., 2000). Velocities measured during this study ranged from just over 200 ft/sec to around 2500 ft/sec. Localized changes of over 700 ft/sec (300%) across distances less than 10 ft were common around areas with observed structural damage. Velocity inversions laterally consistent over significant distances are evident within the upper 10 ft along most lines and likely relate to stiffer clays or partially cemented sediments in close proximity to sand or gravel zones. The sensitivity of shear wave velocities to changes in sediment makeup within this alluvial setting allowed even subtle changes in nearsurface material properties to be identified on 2-D cross-sections. Uniquely locating localized zones of anomalous subsurface sediments (fill, sludge, or rubble) and/or objects (such as pipes, trenches, or old landfill materials) was possible with data from lines 1, 2, 3, and 4. Localized zones of lower velocity material can easily be picked out on lines 1 and 4. Line 3 provides a glimpse at an erosional surface beneath the base of the lower velocity fill materials. It takes very little imagination to interpret the well-defined low velocity zones extending down to depths of almost 10 ft at burial pits interpreted along line 4. Line 5 presents a reasonable depiction of the dike and relatively coherent sediments from the base of the dike down to about 100 ft BGS. Bedrock or a significant increase in velocity is evident at depth on lines 1, 2, 3, and 5. Each type of target imaged during this survey possesses a unique signature with each of the different imaging methods used. Interpreting these data requires incorporation of drilling, borehole measurements, and other geophysical soundings.
Interpreting changes in lithology with this technique has routinely involved correlating high velocity gradients and measured velocities to ground truth. Velocity fields along these five profiles possess relatively uniform increases in shear wave velocity from the surface to the maximum depth of the survey. Anomalous (relative to surrounding materials) high and low velocity closures, likely indicative of extreme lateral variability in material properties or foreign materials, are evident within the unconsolidated sediments along most of the lines. Several localized changes in shear wave velocity are strong candidates for drill investigation. Coherent layers (bedding, changes in lithology, structural features, etc.) were interpreted based on velocity gradients, consistent changes in velocity contours, and overall velocity trends. Several possible explanations exist for each of these velocity phenomena. With the inherent nonuniqueness of these data, precisely located borings would be necessary along each of these lines to increase the confidence and/or modify these interpretations.
Large velocity gradients in the shear wave velocity field are likely indicative of changes in lithology (i.e., alluvial/glacial contacts, alluvial/bedrock, glacial/bedrock), while localized lateral changes (contour closures) in the shear wave velocity within the unconsolidated section were considered evidence of infilling or altered native earth. Mapping the surface of lithologic contacts using shear wave velocity data combined with drill data will result in a significantly higher resolution subsurface map than grid style drilling alone at this site. Advantages of mapping variations in the shallow stratigraphy with the shear wave velocity field calculated from surface waves using MASW include sensitivity to velocity inversions, ease of generating and propagating surface wave energy in comparison to body wave energy, being oblivious to cultural noise (mechanical or electrical), and sensitivity to lateral changes in velocity.
Read the PDF version (4.5 MB)
Kansas Geological Survey, Geophysics
Comments to webadmin@kgs.ku.edu
The URL for this page is http://www.kgs.ku.edu/Geophysics/OFR/2000/4/index.html