|
|
|
|
Year 1 Progress |
|
|
4-D High-resolution seismic reflection monitoring of miscible CO2 injected into a carbonate reservoir: progress report year 1
by Richard D. Miller, Abdelmoneam E. Raef, Alan P. Byrnes, and William E. Harrison
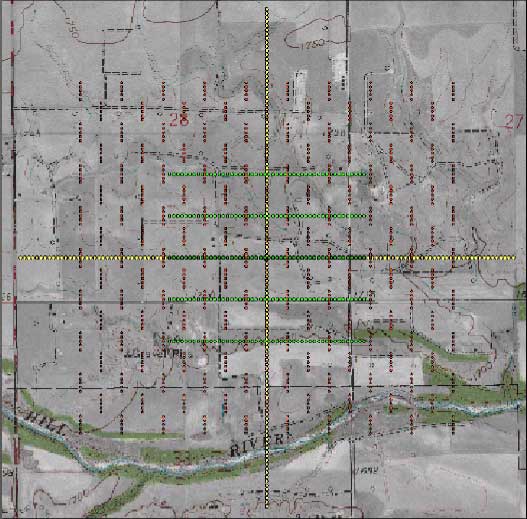
IntroductionThe objective of this research project is to acquire, process, and interpret multiple high-resolution 3-D compressional wave and 2-D, 2-C shear wave seismic data to observe changes in fluid characteristics in an oil field before, during, and after the miscible carbon dioxide (CO2) flood that began around December 1, 2003, as part of the DOE-sponsored Class Revisit Project (DOE #DE-AC26-00BC15124). Unique and key to this imaging activity is the high-resolution nature of the seismic data, minimal deployment design, and the temporal sampling throughout the flood. The 900 m deep test reservoir is located in central Kansas oomoldic limestones of the Lansing-Kansas City Group, deposited on a shallow marine shelf in Pennsylvanian time. Permits and access agreements were secured for the 810 shot points and 240 receiver stations that make up the 3.6 km2 3-D deployment (Figure 1). The design provides uniform 20- to 24-fold coverage across an approximately 600 m x 450 m area centered on the flood pattern from start-up to breakthrough. Moving further away from the CO2 injector, the two water injection wells planned for containment are all within the minimum 12-fold boundary. The 2-D, 2-C shear wave lines intersected near the injection well and extend about 400 m away from the injector. Even if the flood strays significantly from the current expected sweep pattern this 3-D design should provide the necessary offsets, offset distribution, azimuthal control, and fold to monitor the CO2 movement and eventual fate. Figure 1.--This orthophoto is from the Colliver lease southeast of Russell, Kansas. It is overlain by the current working 3-D compressional and shear wave, high-resolution seismic reflection survey to be acquired 12 times over the next six years. The center of this grid is approximately 20 ft north of the injection well. During a site visit on June 18, 2003, the grid was located with the KGS's Trimble DGPS system. With the grid centered on the CO2 injector, receiver line 4 (forth from the north) was in the center of the east/west county road and receiver line 2 crossed directly through the oil storage tanks and metal building located northwest of the injection well. Site reconnaissance left us with the opinion that with the exception of the shot location in the river and in few of the deeper ditches (approximately 10 to 15), all shot stations should be accessible.
Patch design has limited the bin (cell) size to a maximum 10 m x 10 m area while maintaining relatively uniform fold, offset, and azimuthal distributions. Shot lines are perpendicular to receiver lines and staggered to form a modified brick pattern. This pattern made access and movement along shot lines precarious in some areas. This style patch complicates the acquisition (source and receiver deployments), but it provides the optimum traces and trace distribution for each bin. A 240-channel Geometrics Geode distributed system networked to a StrataVisor NZ acquisition controller recorded the seismic data. A single IVI minivib2 with a prototype high-output Atlas rotary control valve swept five times at each source location. Sweep frequencies for the P-wave survey span from 25 to 250 Hz over a 10 second duration. Receivers were three digital grade 10 Hz Mark Products Ultra2w geophones wired in series with 14 cm oversized spikes. Geophones were planted in a fresh spot but within a half-km of the station location as defined during the baseline and previous three monitor surveys. The three-geophone spread formed a 0.5 m equilateral triangle. Baseline shear wave data were acquired using an IVI minivib1 with a sweep frequency that ranges from around 15 to 150 Hz and the same seismograph but with 14 Hz horizontal geophones. The spread design and recording parameters were identical to the baseline survey. The resulting data were initially processed in 2-D with follow-up work in 3-D. Absolute source and receiver location over the 3.6 km2 survey grid were maintained using a Trimble survey-grade DGPS system. The original digital map developed during the baseline survey was used to exactly relocate each station for each of the repeat 3-D surveys. 3-D stacked cubes ready for interpreting were generated using the 2-D/3-D ProMax (a product of Landmark) processing package currently running at the KGS on a dual processor SGI Octane workstation. Refinements to processing flows and reprocessing of previous data sets were continuous throughout year 1. Optimal processing of these 3-D data have involved techniques and algorithms developed for petroleum applications but carefully analyzed and applied in a fashion consistent with the needs of shorter wavelength and lower signal-to-noise ratio high-resolution data. Cross-equalization techniques have not been necessary with the consistency in data acquisition but will be appraised with each new data set. Interpretation of these seismic data began during year 1. Volumes including instantaneous frequency, amplitude, and phase, along with impedance and coherency, were generated, compared, and differenced in search of the seismic attribute or attributes most sensitive to CO2 (fluid) movement in the reservoir. Successes with instantaneous frequency were observed on initial surveys during year. Landmark's interpretation software Kingdom Suites has proven extremely adaptable to the high-resolution nature of these data and will continue to be the primary interpretation software used during year 2. Complete Report
|
|
Kansas Geological Survey, 4-D Seismic Monitoring of CO2 Injection Project Placed online Oct. 11, 2004 Comments to webadmin@kgs.ku.edu The URL is HTTP://www.kgs.ku.edu/Geophysics/4Dseismic/Reports/year_1.html |