|
|
|
|
Progress Report on Preliminary Interpretation and the Third Monitoring 3-D Seismic Survey--Fig. 7 |
|
|
|||
Return to Site Visit report...
Figure 7A--Baseline Survey-Lineaments based on changes in data character or texture were interpreted on baseline data from 24 msec time slices at around 560 msec. These lineaments are interpreted identically on both displays--instantaneous frequency (7A) and amplitude (7B).
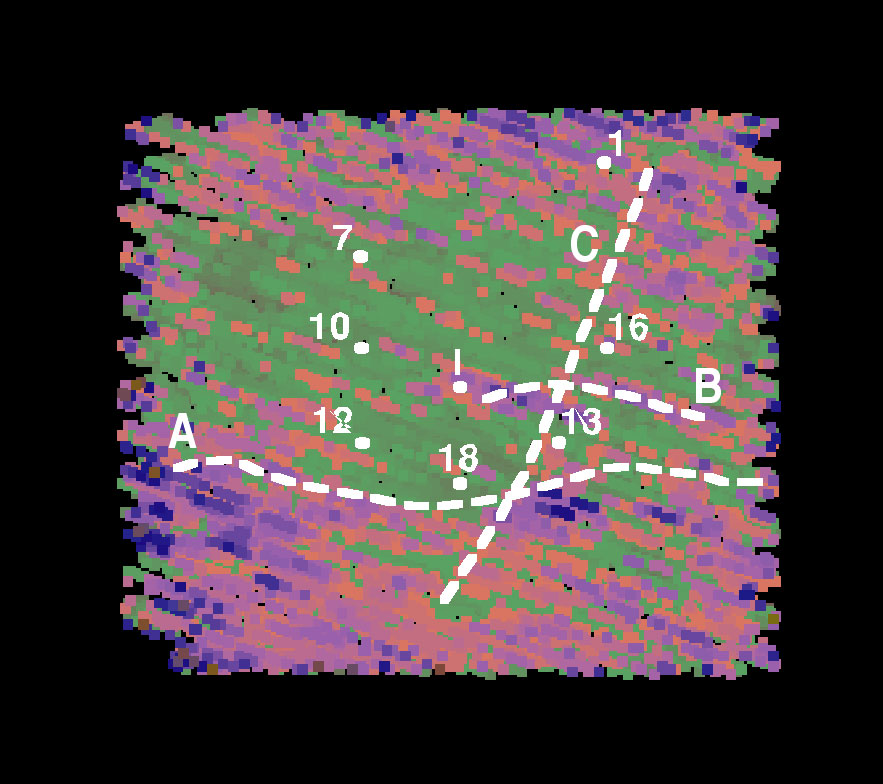
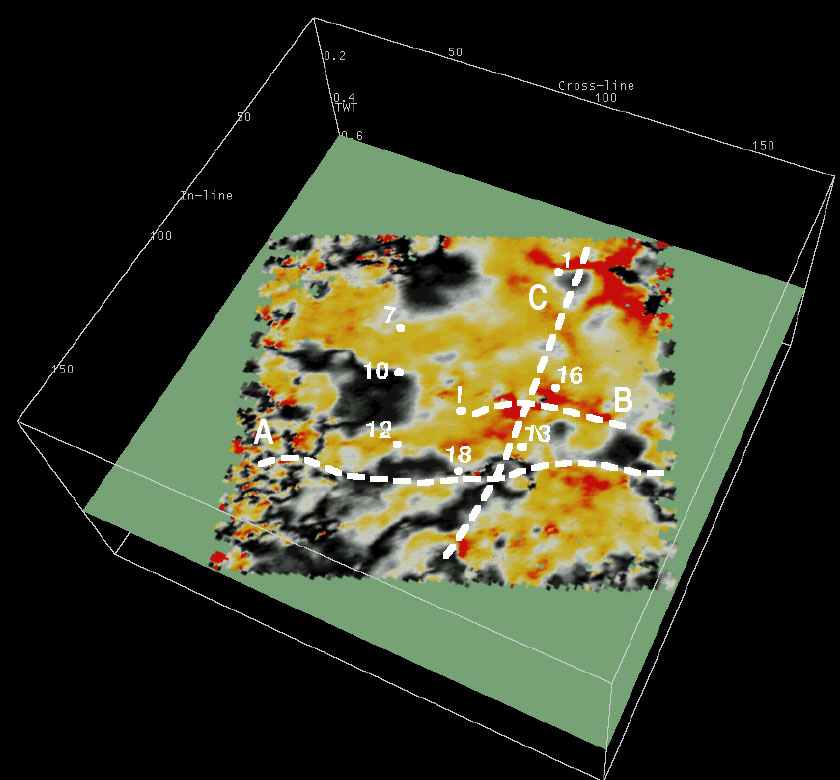
Figure 7B--Color representation of amplitude values along the 560 msec time slice with lineaments displayed.
Return to Site Visit report...
|
Kansas Geological Survey, 4-D Seismic Monitoring of CO2 Injection Project Placed online July 22, 2004 Comments to webadmin@kgs.ku.edu The URL is HTTP://www.kgs.ku.edu/Geophysics/4Dseismic/Reports/Jun23_2004/fig7.html |