|
|
|
|
Jan. 22 2004 Site Visit--Noise Identification |
|
|
|||
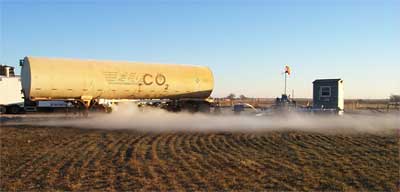
With time lapse (4-D) seismic imaging comes an exorbitant amount of attention paid to all sources of noise, especially noise that changes from record-to-record and day-to-day. This concern stems from the need for complete repeatability in every recorded data point. Sources of noise at the CO2 pilot study site in southeastern Russell County include wind, rain/sleet, injector pumps, injection wells, pipelines, oil-production pumps, vehicle traffic, livestock/wildlife, and power lines. Each of these noise sources produces seismic energy impacting the recorded signal in a wide range of ways.
| Click on any photo to view a larger version |
|---|
| Figure 1--During normal operations CO2 will occasionally vent from storage tanks. |
 |
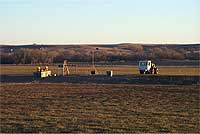
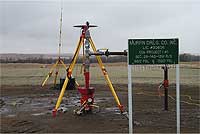
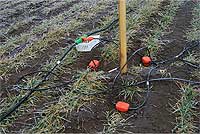
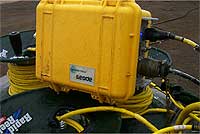
Changes in near-surface conditions that occurred during the acquisition of 3-D monitoring survey #1 (January 20 to January 30) had little to no effect on the recorded data (Figure 2). Receivers were well seated (14 cm) into solid material and all electronic connecting points were insulated from the ground by elevating the takeouts with plastic tubs and therefore protecting the takeout from leakage (Figure 3). The 240 channel Geometrics Geode recording system is designed to operate in all weather conditions (Figure 4). When noise from sleet hitting the receivers was observed, recording was halted until the sleet stopped.
| Click on any photo to view a larger version | |
|---|---|
| Figure 2--Data collection: Jan. 23 (50° F, calm, and clear) vs. Jan. 25 (25° F, frz rain, and cloudy). |
|
 |
 |
| Click on any photo to view a larger version | |
|---|---|
| Figure 3--Ten-hertz geophones w/tubs to insulate connector. |
Figure 4--Ice-covered Geode. |
 |
 |
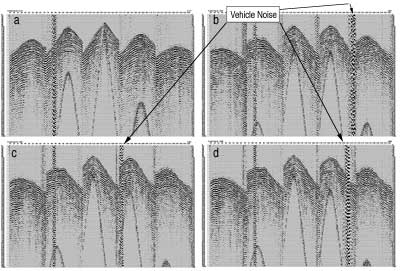
Coherent noise that moves either during the 10-second seismic sweep or from sweep to sweep at a single source station has the least impact on the eventual consistency in data characteristics between any two surveys acquired at different times of the year. Moving coherent noise is generally either a vehicle or an animal (including humans). Since the source point for this type of noise changes from shot to shot, throughout the recording time it can be muted or zeroed from one record in a surgical fashion (Figure 5). In this example, when the four sweeps from each station are vertically stacked, contributions from records with good signal are added to the zeroed or muted portions of records where noise had previously dominated to produce a continuous high signal-to-noise ratio section.
| Click on any photo to view a larger version |
|---|
| Figure 5--(a) Quiet record w/water injector pump at trace #84, compared to records (b), (c), and (d) with vehicle noise moving across the records. |
 |
Coherent noise that is stationary is a bigger problem to remove than moving coherent noise. Examples of sources of coherent stationary noise include injection wells, injection pumps, pipelines, oil-production pumps, and power lines (Figure 6). With the stationary nature of these noise sources, all records recorded for all source locations will have this noise at the same place (Figure 7). Therefore the trick used for moving noise sources, or muting bad segments and then adding the muted (zeroed) portion to good signal from other records taken at this site, will not work here. Two different techniques can be used to reduce or eliminate this type of noise, depending on the specific characteristics of the noise. One technique involves filtering in the frequency domain for the noise source, which has dominant frequency signatures within a narrow range or a range outside the seismic source bandwidth. Another technique is cancellation when the phase characteristics of the noise source vary through time and from record to record.
| Click on any photo to view a larger version | |
|---|---|
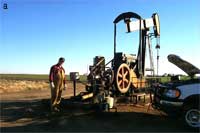
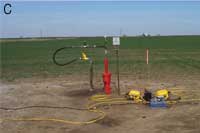
| Figure 6(a)--Single cylinder gas engine powered pump jack. |
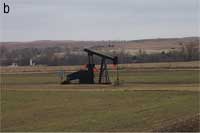
Figure 6(b)--electric-powered pump jack--Colliver #12. |
 |
 |
| Figure 6(c)--water injection well w/fluid flow meter. |
Figure 6(d)--piston pump for water injection. |
 |
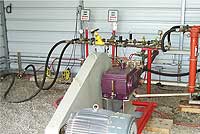 |
At this site there are two predominant sources of fixed, continuous, coherent noise: pumps and pipelines. Oil-production well pumps produce a periodic low-frequency long-duration pulse consistent with the stroke of the pump jack (Figure 6). Correlation of the pilot with the recorded sweep has a tendency to reduce this kind of noise, generally to levels that can be tolerated, but not preferred, on 4-D data sets. This kind of pump jack noise is bothersome but not nearly as detrimental to the overall data quality as ground vibrations emitted by high-pressure piston pumps. High-pressure piston pumps put continuous high amplitude relatively broadband noise into the ground.
In the case of the fresh-water injection pump located inside the utility shed on-site, all receivers within 150 ft are inundated with this high amplitude broadband noise (Figure 7, top). The only signal enhancement weapons that seem to work (although to a very limited degree) against this kind of noise are spectral balancing and vertically stacking. Fortunately, these pumps do not saturate the available dynamic range of the seismograph permitting some signal (be it extremely low amplitude) to be recorded. This extremely small percentage of signal increases relative to the noise by vertically stacking each sweep recorded at a shot station. Building the signal strength in this fashion is possible as a consequence of the uniformity in arrival times and character of signal on all shot gathers compared to the more random phase-time relationship that coherent and continuous single-point noise will have from shot-to-shot.
| Click on any photo to view a larger version |
|---|
| Figure 7--(top) Correlated shot gather with stationary noise. (bottom) 12-second uncorrelated shot gather with pump-jack noise (right) and without (left). |
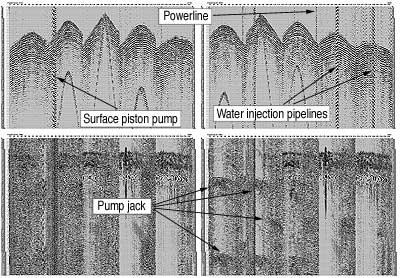 |
Pipelines used to move the fluid from pump to well bore emit noise generated by surface piston pumps, which are used to move fluid around an oil field (Figure 7, top). Tremendous amplitude of pump noise can be seen every place a pipeline passes beneath a receiver line. With water injection at this site used to contain the CO2, pumping of water through these pipes and into the injection wells occurs based on need as determined by borehole pressures. Therefore, high-amplitude pipeline noise dominates several traces on any line that passes over the pipeline for periods of 1 to 2 hours every 2 to 4 hours all day. This noise always affects the same receivers but is recorded at some shot stations and not at others, depending on when the well pressure dictates. As a result, no two complete 3-D data sets will have this pipeline noise on all the same shot gathers. Differences in this noise will show up as a change from baseline to later monitoring surveys.
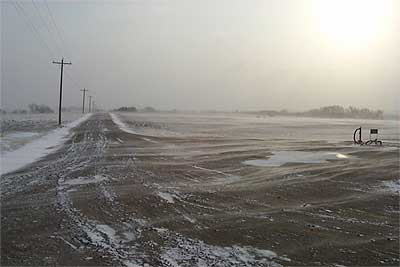
Wind is a source of noise that is the least controllable and can be the most detrimental to time-lapse seismic recording (Figure 8). With no two days having the same wind conditions it is impossible to record two data sets that will difference to equal zero even when using the same source, identical source locations, and exactly the same receiver grid. This project requires four to six days to record data from all the source locations. Across that six-day span, noise from wind is stronger some days than others, making shots recorded from one side of the grid noisier than shots from the other side, regardless of near-surface conditions or source-to-receiver offsets. On this project, no data are recorded when wind velocity exceeds 15 mph. This is an experience-based value that resulted in an acceptable signal-to-noise ratio on recorded seismic data.
| Click on any photo to view a larger version |
|---|
| Figure 8--Data acquisition was not possible on Jan. 26 (10° F, snowing, and 30 mph wind). |
 |
|
Kansas Geological Survey, 4-D Seismic Monitoring of CO2 Injection Project Placed online Jan. 28, 2004 Comments to webadmin@kgs.ku.edu The URL is HTTP://www.kgs.ku.edu/Geophysics/4Dseismic/Reports/Jan22_2004/index.html |