![]()
Prev Page--Recharge, Discharge || Next Page--Formations
Ground Water, continued
Utilization of Ground Water
During the course of the investigation information on 417 wells in the Wichita-Greeley area was obtained. Most of the irrigation wells and all the public-supply and industrial wells in the area were visited, and all available data concerning them were collected. Records of wells are listed in Tables 15 and 16. The principal uses of water are described below.
Domestic and Stock Supplies
All domestic supplies in the rural areas and in the towns of Selkirk, Coronado, and Marienthal in Wichita County, and in Whitelaw in Greeley County, which have no municipal water supplies, are obtained from wells. Most of the water used by livestock also comes from wells, although small amounts may be obtained from undrained depressions, stock ponds, or creeks. Ground water in both counties is moderately hard but is satisfactory for most domestic and stock purposes.
Public Supplies
At Leoti in Wichita County and at Tribune and Horace in Greeley County public supplies are obtained from wells.
Leoti--Leoti, the county seat of Wichita County, obtains its water supply from three wells (18-37-13cca, 18-37-13dca1, and 18-37-13dca2), all of which are within the city limits and derive their water from the Ogallala formation. Well 18-37-13dca1 is reported to be about 166 feet deep and its depth to water on August 24, 1948, was measured to be 71.05 feet. Well 18-37-13dca2 is reported to be 162 feet deep and its water level was measured at 71.94 feet on the same day. Both wells have 12-inch steel casing and are pumped by electrically driven vertical turbine pumps. Well 18-37-13cca was drilled in the fall of 1950. It is 170 feet deep, has 12-inch steel casing, and its depth to water is 73 feet. During a pumping test in November 1950 the well was pumped at about 700 gallons a minute. (The log of this well is included at the end of this report.) The pumps deliver water from the 3 wells directly into the mains, the excess being stored in a 50,000-gallon elevated tank. In 1948 the average daily consumption of water in Leoti was 150,000 gallons. The water is of good quality and is not treated.
Tribune--Prior to the fall of 1949, Tribune, the county seat of Greeley County, obtained its water from four wells within the city limits. These wells, which had yields ranging from 30 to 60 gallons a minute, did not furnish an adequate supply for the city. In 1949 a well (18-40-5dad) was drilled 3 miles north of Tribune and was tested at a maximum yield of 450 gallons a minute. This well is reported to be 192 feet deep and to have a static water level of about 128 feet; it has an 18-inch steel casing. In 1950 it was used exclusively to supply the water for Tribune. However, well 18-40-29aca was maintained in readiness to be used as a standby in case of an emergency. Data on wells 18-40-5dad and 18-40-29aca are given in Table 16. The Tribune municipal wells pump directly into the mains, the excess going to a 50,000-gallon elevated storage tank. The water is not treated.
Horace--Horace obtains its water from two wells located about 2 miles north of the town. Well 18-40-7cbb is an 80-foot dug well, about 12 feet in diameter and cased with concrete; it has a static water level of about 60 feet. Well 18-40-7cbc, also reported to be about 80 feet deep, is a drilled well and is cased with 10-inch steel casing. The yields of these wells are reported as 50 and 30 gallons a minute respectively. Water is piped from the wells to the mains in town and the excess water is stored in an elevated wooden tank having a capacity of 65,000 gallons. The water is not treated.
Industrial Supplies
At present ground water is not used for industrial purposes in Wichita and Greeley counties. Until about 1949, wells 18-38-20acc and 18-38-20acd at the town of Selkirk were used by the Missouri Pacific Railroad to fill the boilers of steam locomotives. During 1949 the railroad converted to diesel engines. The wells were sold and are now used for irrigation.
In 1901 the Missouri Pacific Railroad drilled a 1,370-foot test hole to the Dakota formation in an attempt to obtain sufficient water at Horace. Failure to do so was instrumental in transferring the railroad shops from Horace at that time. The driller's log of this well is included at the end of this report.
Irrigation Supplies
According to the 1940 Federal census, 256 acres of crop land were irrigated by 8 wells and harvested in Wichita County in 1939; no acreage was irrigated in Greeley County. During the next 10 years, however, especially from 1946 to 1950, irrigation in Wichita and Greeley counties increased considerably. In the summers of 1947 and 1948 when most of the field work of this investigation was done, information was obtained on 30 irrigation wells, 28 in Wichita County and 2 in Greeley County. By the end of 1951 a further, though incomplete, inventory showed a total of 66 irrigation wells in Wichita County and 7 in Greeley County. The acreage under irrigation is not known definitely but is probably between 10,000 and 12,000 acres in Wichita County and from 1,000 to 1,500 acres in Greeley County.
The amount of water pumped annually for irrigation is not known, but probably it is somewhat less than 1 acre-foot per irrigated acre.
The yields of 12 irrigation wells were tested during the summer of 1948. Average yields ranged from 370 to 1,800 gallons a minute. Only one well tested had a yield of less than 500 gallons a minute. Well 18-35-34abb was pumped at about 1,800 gallons a minute for 3 1/4 hours, at the end of which time the drawdown was 19 feet. Before the test ended the pumping rate was increased to 2,100 gallons a minute for half an hour. No measurement of drawdown was made at this rate of pumping.
Of the wells tested, drawdowns ranged from 14 to 44 feet and specific capacities ranged from 19 to 95 gallons a minute per foot of drawdown (Table 8). The tests emphasized that the irrigation wells in Wichita and Greeley counties differ greatly in yield and over-all efficiency. Many factors determine the yield of a well, including the method of construction, the character and thickness of the water-bearing formation, the diameter of the casing, the type of perforations or well screen, and the location of the perforated casing or screen.
Table 8--Yield, total lift, drawdown, and specific capacity of irrigation wells in Wichita and Greeley counties.
| Well number |
Date of test, 1948 |
Discharge, gallons a minute |
Total lift, feet |
Drawdown, feet |
Specific capacity, gallons a minute per foot of drawdown |
|---|---|---|---|---|---|
| 16-35-20ccc | August 17 | 820a 1,270b | 130 | 19 | 45 |
| 16-36-7bcb | August 18 | 570 | 104 | 18 | 32 |
| 16-42-22acb | August 16 | 680a 811b | |||
| 17-36-26caa | August 25 | 670a 910b | |||
| 18-35-27dcc | August 13 | 1,270 | |||
| 18-35-34abb | August 13 | 1,800a 2,100b | 108 | 19 | 95 |
| 18-35-36bcb | August 12 | 1,180 | 104 | 14 | 85 |
| 18-35-36cbc | August 12 | 680 | |||
| 18-36-18ddc | August 18 | 820 | 131 | 44 | 19 |
| 18-38-30bbb | August 19 | 370 | |||
| 18-38-30dbb | August 19 | 675 | 149 | 28 | 24 |
| 18-38-31dbc | August 10 | 610 | 127 | 17 | 33 |
| a Normal pumping rate. b Maximum pumping rate. |
|||||
Possibilities of Further Development of Irrigation Supplies
The quantity of water that can be pumped from an underground reservoir without causing excessive permanent lowering of the water table depends on the quantity of annual recharge to the reservoir. If water is withdrawn faster than it is replenished, the water table will decline and the supply eventually will be nearly depleted. The feasibility of developing additional water supplies for irrigation from wells in Wichita and Greeley counties depends on the rate of replenishment of the underground reservoir and on other geologic, hydrologic, and economic factors.
Figure 12, a map showing the thickness of water-bearing Pliocene and Pleistocene deposits, indicates that, although parts of southern Wichita County and several areas in Greeley County have no water-bearing material, much of the area has a considerable thickness of saturated sediments. The maximum thickness is about 170 feet on the northern border of Greeley County. In order to determine the volume of ground water contained in the saturated materials, the volume of saturated sediments was first determined by multiplying the area between each pair of contour lines on Figure 12 (measured with a planimeter) by the average saturated thickness. This was then multiplied by the specific yield of the sediments (assumed to be 15 percent). The volume of saturated sediments was found to be 45.4 million acre-feet and the volume of water was found to be 6.8 million acre-feet. The volume of saturated deposits and the total volume of water available for pumping is given by townships in Table 9. Theoretically, if completely drained, 6.8 million acre-feet of water would be available from the saturated sediments. Actually, however, much less than this amount would be economically recoverable. As the water table declined, yields also would decline and pumping lifts would be so increased as to make pumping infeasible. Although a discussion of economic factors is beyond the scope of this report, the depth to ground water in the parts of Wichita and Greeley counties that have sufficient water-bearing material seem not to prohibit the drilling and pumping of irrigation wells.
Fig. 12--Map showing the saturated thickness of Pliocene and Pleistocene deposits in Wichita and Greeley counties. A larger version of this figure is available.
Table 9--Volume of saturated water-bearing materials in Wichita and Greeley Counties and volume of water available for pumping based on a specific yield of 15 percent.
| (1) Township |
(2) Volume of water-bearing materials, acre-feet |
(3) Volume of water, acre-feet (15 percent of column 2) |
|---|---|---|
| T. 16 S., R. 35 W. | 1,230,000 | 184,500 |
| T. 16 S., R. 36 W. | 1,772,000 | 265,800 |
| T. 16 S., R. 37 W. | 2,171,000 | 325,800 |
| T. 16 S., R. 38 W. | 2,738,000 | 410,500 |
| T. 16 S., R. 39 W. | 2,173,000 | 326,000 |
| T. 16 S., R. 40 W. | 1,764,000 | 264,500 |
| T. 16 S., R. 41 W | 2,517,000 | 377,100 |
| T. 16 S., Rs. 42 and 43 W. | 1,357,000 | 203,500 |
| T. 17 S., R. 35 W. | 2,196,000 | 329,100 |
| T. 17 S., R. 36 W. | 2,534,000 | 380,000 |
| T. 17 S., R. 37 W. | 2,534,000 | 380,000 |
| T. 17 S., R. 38 W. | 1,547,000 | 232,000 |
| T. 17 S., R. 39 W. | 1,44O,000 | 216,000 |
| T. 17 S., R. 40 W. | 757,000 | 113,600 |
| T. 17 S., R. 41 W. | 64,000 | 9,600 |
| T. 17 S., Rs. 42 and 13 W. | 174,000 | 26,100 |
| T. 18 S., R. 35 W. | 1,592,000 | 238,800 |
| T. 18 S., R . 36 W. | 1,919,000 | 288,000 |
| T. 18 S., R. 37 W. | 2,218,000 | 332,500 |
| T. 18 S., R. 38 W. | 2,005,000 | 300,800 |
| T. 18 S., R. 39 W. | 650,000 | 97,400 |
| T. 18 S., R. 40 W. | 519,000 | 77,800 |
| T. 18 S., R. 41 W. | 141,000 | 21,500 |
| T. 18 S., Rs. 42 and 43 W. | 311,000 | 46,600 |
| T. 19 S., R. 35 W. | 612, 000 | 91,800 |
| T. 19 S., R. 36 W. | 428,000 | 64,200 |
| T. 19 S., R. 37 W. | 656, 000 | 98,400 |
| T. 19 S., R. 38 W. | 1,466,000 | 220,000 |
| T. 19 S., R. 39 W. | 452,000 | 67,800 |
| T. 19 S., R. 40 W. | 916,000 | 137,500 |
| T. 19 S., R. 41 W. | 381,000 | 57,200 |
| T. 19 S., Rs. 42 and 43 W. | 818,000 | 122,500 |
| T. 20 S., R. 35 W. | 619,000 | 92,800 |
| T. 20 S., R. 36 W. | 275,000 | 41,200 |
| T. 20 S., R. 37 W. | 300,000 | 45,000 |
| T. 20 S., R. 38 W. | 1,086,000 | 162,900 |
| T. 20 S., R. 39 W. | 414,000 | 62,100 |
| T. 20 S., R. 40 W | 304,000 | 45,600 |
| T. 20 S., R,. 41 W. | 224,000 | 33,600 |
| T. 20 S., Rs. 42 and 43 W. | 155,000 | 23,200 |
| Total volume | 45,429,000 | 6,813,300 |
At the present time essentially no ground water is being withdrawn from storage; that is, the amount of water pumped by wells is less than the amount of water added annually to the ground-water reservoir. If the present rate of recharge from precipitation continues and the rate of pumping does not increase appreciably, there is no danger of lowering the water level beyond the economic limit of use.
The measurements of the water level given in Tables 14, 15, and 16 indicate that the water in wells was generally slightly higher in 1951 than it was in 1947 or 1948, when first measured. Although irrigation increased during this period, precipitation was generally above average, and ground-water recharge exceeded ground-water discharge.
The total amount of recharge in Wichita and Greeley counties is roughly 4.5 billion gallons a year, 1.8 billion gallons coming from subsurface inflow and 2.7 coming from recharge from local precipitation. The amount of water pumped from wells is approximately 2 billion gallons a year and the amount to leave the area by subsurface flow is about 2.5 billion gallons a year. Although it should not be concluded that the amount of pumping could be doubled, it is apparent that many more irrigation wells could be drilled and pumped without danger of seriously lowering the water table. However, care should be exercised in the spacing and location of wells, and measurement of the water level in observation wells should be continued in order that remedial action might be taken before the lowering became excessive.
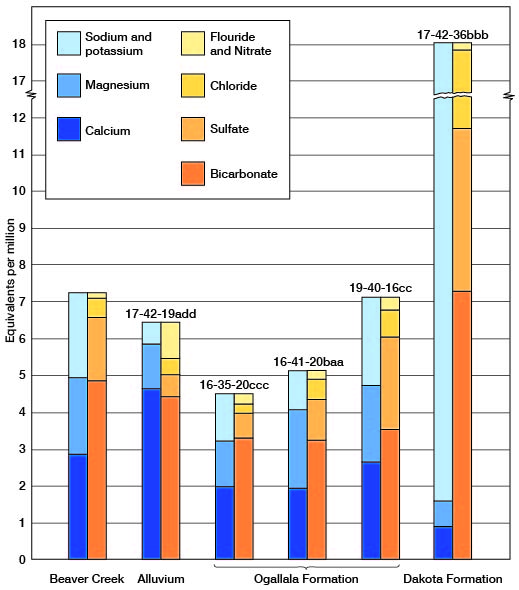
Chemical Character of Water
The chemical character of ground water in Wichita and Greeley counties is shown by 29 analyses of water from typical wells in the area (Tables 10, 11). In addition, one sample was taken from a test hole drilled to the Dakota formation and one was taken from Ladder Creek. Figure 13 shows graphically the chemical character of water from the Ogallala formation, alluvium, Dakota formation, and from Ladder Creek. The samples were analyzed by Howard A. Stoltenberg, chemist, in the Water and Sewage Laboratory of the Kansas State Board of Health, at Lawrence. The analyses show only the dissolved mineral content and do not indicate the sanitary condition of the water.
Table 10--Analyses of water from typical wells in Wichita County. Analyzed by H.A. Stoltenberg. Dissolved constituents given in parts per milliona, and in equivalents per millionb (in italics).
| Well no. | Depth (feet) |
Geologic source |
Date of collection, 1947 |
Temp. (°F) |
Dissolved solids |
Silica (SiO2) |
Iron (Fe) |
Calcium (Ca) |
Magnesium (Mg) |
Sodium and potassium (Na+K) |
Bicarbonate (HCO3) |
Sulfate (SO4) |
Chloride (Cl) |
Fluoride (F) |
Nitrate (NO3) |
Hardness as CaCO3 | ||
|---|---|---|---|---|---|---|---|---|---|---|---|---|---|---|---|---|---|---|
| Total | Carbonate | Noncarbonate | ||||||||||||||||
| 16-35-20ccc | 189 | Ogallala | Oct. 11 | 59 | 257 | 19 | 2.1 | 40 2.00 |
15 1.23 |
29 1.28 |
202 3.31 |
32 0.67 |
9.0 0.25 |
2.0 0.10 |
11 0.18 |
162 | 162 | 0 |
| 16-37-13cbb | 88 | Ogallala | Oct. 11 | 59 | 257 | 21 | 0.52 | 40 2.00 |
17 1.40 |
26 1.13 |
202 3.31 |
32 0.67 |
9.0 0.25 |
2.6 0.14 |
9.7 0.16 |
170 | 166 | 4 |
| 16-38-27ccc | 28 | Ogallala | Oct. 11 | 56 | 398 | 35 | 0 | 61 3.04 |
25 2.06 |
36 1.58 |
254 4.17 |
58 1.21 |
25 0.70 |
1.9 0.10 |
31 0.50 |
255 | 208 | 47 |
| 17-35-8bcb | Beaver Creek | Oct. 11 | 412 | 23 | 4.0 | 58 2.89 |
25 2.06 |
53 2.31 |
296 4.85 |
83 1.73 |
19 0.54 |
1.9 0.10 |
2.7 0.04 |
248 | 242 | 6 | ||
| 17-35-22dcc | 95 | Ogallala | Oct. 11 | 58 | 351 | 41 | 0.34 | 58 2.89 |
21 1.73 |
26 1.13 |
210 3.44 |
66 1.37 |
22 0.62 |
2.6 0.14 |
11 0.18 |
231 | 172 | 59 |
| 17-36-17daa | 33.0 | Ogallala | Oct. 11 | 57 | 368 | 32 | 0.38 | 62 3.09 |
25 2.06 |
32 1.40 |
307 5.03 |
48 1.00 |
15 0.42 |
1.1 0.06 |
2.4 0.04 |
258 | 252 | 6 |
| 18-37-8bcb | 113.0 | Ogallala | Oct. 13 | 58 | 289 | 43 | 0.86 | 41 2.05 |
20 1.64 |
23 1.00 |
199 3.26 |
41 0.85 |
12 0.34 |
2.0 0.10 |
8.8 0.14 |
184 | 163 | 21 |
| 18-37-13ddc | 98 | Ogallala | Oct. 14 | 59 | 340 | 39 | 0.03 | 56 2.79 |
22 1.81 |
23 0.99 |
189 3.10 |
42 0.87 |
40 1.13 |
2.2 0.12 |
23 O.37 |
230 | 155 | 75 |
| 18-38-17aad | 49.0 | Ogallala | Oct. 11 | 59 | 198 | 25 | 0.05 | 42 2.10 |
10 0.82 |
6.9 0.30 |
138 2.26 |
28 0.58 |
4.0 0.11 |
1.1 0.06 |
13 0.21 |
146 | 113 | 33 |
| 18-38-31dbc | 148.0 | Ogallala | Oct. 13 | 59 | 225 | 37 | 2.2 | 32 1.60 |
16 1.32 |
17 0.76 |
178 2.92 |
16 0.33 |
6.0 0.17 |
1.6 0.08 |
11 0.18 |
146 | 146 | 0 |
| 19-35-8add | 80 | Ogallala | Oct. 13 | 58 | 451 | 43 | 0.05 | 62 3.09 |
39 3.21 |
30 1.30 |
232 3.80 |
91 1.89 |
55 1.55 |
2.2 0.12 |
15 0.24 |
315 | 190 | 125 |
| 19-37-12cad | 69.0 | Ogallala | Oct. 13 | 58 | 278 | 40 | 0.13 | 42 2.10 |
20 1.64 |
19 0.82 |
202 3.31 |
35 0.73 |
12 0.34 |
0.7 0.04 |
8.8 O.14 |
187 | 166 | 21 |
| 19-38-25bbb | 97.0 | Ogallala | Oct. 16 | 59 | 342 | 4.7 | 0.27 | 46 2.30 |
20 1.64 |
34 1.47 |
200 3.28 |
68 1.41 |
17 0.48 |
1.6 0.08 |
10 0.16 |
197 | 164 | 33 |
| 20-35-15bbb | 88 | Ogallala | Oct. 13 | 58 | 198 | 11 | 0.18 | 47 2.34 |
7.7 0.63 |
15 0.67 |
193 3.16 |
10 0.21 |
5.0 0.14 |
0.4 0.02 |
6.6 0.11 |
148 | 148 | 0 |
| 20-37-13add | 24 | Ogallala | Oct. 13 | 57 | 385 | 26 | 0.46 | 100 4.99 |
17 1.40 |
7.6 0.33 |
333 5.46 |
12 0.25 |
5.0 0.14 |
0.4 0.02 |
53 0.85 |
320 | 273 | 47 |
| aOne part per million is equivalent to one pound of substance per million pounds of water or 8.33 pounds per million gallons of water. bAn equivalent per million is a unit chemical equivalent weight of solute per million unit weights of solution. Concentration in equivalents per million is calculated by dividing the concentration in parts per million by the chemical combining weight of the substance or ion. |
||||||||||||||||||
Table 11--Analyses of water from typical wells in Greeley County. Analyzed by H.A. Stoltenberg. Dissolved constituents given in parts per milliona, and in equivalents per millionb (in italics).
| Well no. | Depth (feet) |
Geologic source |
Date of collection, 1947 |
Temp. (°F) |
Dissolved solids |
Silica (SiO2) |
Iron (Fe) |
Calcium (Ca) |
Magnesium (Mg) |
Sodium and potassium (Na+K) |
Bicarbonate (HCO3) |
Sulfate (SO4) |
Chloride (Cl) |
Fluoride (F) |
Nitrate (NO3) |
Hardness as CaCO3 | ||
|---|---|---|---|---|---|---|---|---|---|---|---|---|---|---|---|---|---|---|
| Total | Carbonate | Noncarbonate | ||||||||||||||||
| 16-40-27ccd | 75 | Ogallala | Oct. 2 | 58 | 325 | 35 | 0.15 | 46 2.30 |
23 1.89 |
27 1.17 |
198 3.25 |
73 1.52 |
13 0.37 |
1.6 0.08 |
8.8 0.14 |
210 | 162 | 48 |
| 16-41-20baa | 153.0 | Ogallala | Oct. 2 | 57 | 308 | 38 | 0.29 | 39 1.95 |
26 2.14 |
24 1.05 |
198 3.25 |
54 1.12 |
19 0.54 |
2.0 0.10 |
8.0 0.13 |
204 | 162 | 42 |
| 16-42-20daa | 200 | Ogallala | Oct. 2 | 59 | 303 | 24 | 1.7 | 41 2.05 |
22 1.81 |
28 1.22 |
176 2.89 |
69 1.44 |
15 0.42 |
1.4 0.07 |
16 0.26 |
193 | 144 | 49 |
| 17-39-3bbc | 110.0 | Ogallala | Oct. 3 | 59 | 275 | 24 | 0.30 | 67 3.34 |
13 1.07 |
7.8 0.84 |
220 3.61 |
28 0.58 |
8.0 0.23 |
0.3 0.02 |
19 0.31 |
220 | 180 | 40 |
| 17-41-28bcc | 132.0 | Ogallala | Oct. 1 | 60 | 353 | 25 | 0.50 | 64 3.19 |
20 1.64 |
22 0.94 |
187 3.07 |
88 1.88 |
14 0.39 |
0.9 0.05 |
27 0.48 |
242 | 154 | 88 |
| 17-42-19add | 30 | Alluvium | Oct. 2 | 66 | 391 | 33 | 5.1 | 93 4.64 |
15 1.23 |
13 0.5 |
271 4.44 |
29 0.60 |
16 0.45 |
0.5 0.03 |
58 0.93 |
294 | 222 | 72 |
| 17-42-36bbb | 1,140 | Dakota | Dec. 17, 1948 | 1,065 | 8.4 | 1.8 | 18 0.90 |
8.8 0.72 |
377 16.40 |
446 7.31 |
212 4.41 |
217 6.12 |
3.0 0.16 |
1.1 0.02 |
81 | 81 | 0 | |
| 18-40-1ddc | 90.0 | Ogallala | Oct. 3, 1947 | 58 | 202 | 21 | 0.10 | 40 2.00 |
13 1.07 |
12 0.50 |
185 3.03 |
12 0.25 |
4.0 0.11 |
0.9 0.05 |
8.0 0.13 |
154 | 152 | 2 |
| 18-40-17ddb | 55 | Ogallala | Oct. 2 | 58 | 502 | 26 | 0.15 | 128 6.39 |
16 1.32 |
27 1.18 |
416 6.82 |
44 0.92 |
20 0.56 |
0.1 0.01 |
36 0.58 |
3S6 | 341 | 45 |
| 18-42-22ddd | 110.0 | Ogallala | Oct. 1 | 58 | 494 | 27 | 0.40 | 71 3.54 |
38 3.12 |
36 1.56 |
231 3.79 |
170 3.54 |
20 0.56 |
1.1 0.06 |
17 0.27 |
333 | 190 | 143 |
| 19-40-16cc | 126.0 | Ogallala | Sept. 30 | 60 | 430 | 27 | 0.27 | 54 2.69 |
25 2.06 |
55 2.38 |
217 3.56 |
120 2.50 |
26 0.73 |
2.4 0.13 |
14 0.22 |
238 | 178 | 60 |
| 19-41-2baa | 130 | Ogallala | Oct. 1 | 404 | 23 | 0.32 | 44 2.20 |
26 2.14 |
55 2.38 |
194 3.18 |
122 2.54 |
27 0.76 |
1.9 0.10 |
8.8 0.14 |
217 | 159 | 58 | |
| 19-42-35add | 95 | Ogallala | Oct. 1 | 58 | 608 | 17 | 1.3 | 67 3.34 |
31 2.55 |
94 4.08 |
210 3.44 |
245 5.10 |
48 1.35 |
1.0 0.05 |
2.0 0.03 |
294 | 172 | 122 |
| 20-39-3dd | 191.0 | Ogallala | Oct. 13 | 59 | 314 | 23 | 0.29 | 38 1.90 |
21 1.73 |
38 1.66 |
178 2.92 |
71 1.48 |
22 0.62 |
1.5 0.08 |
12 0.19 |
182 | 146 | 36 |
| 20-41-5bac | 150 | Ogallala | Sept. 30 | 60 | 603 | 19 | 0.21 | 70 3.49 |
32 2.63 |
82 3.55 |
170 2.79 |
257 5.34 |
45 1.27 |
1.6 0.08 |
12 0.19 |
306 | 140 | 166 |
| 20-41-10aa | 170 | Ogallala | Sept. 30 | 60 | 517 | 19 | 0.38 | 59 2.94 |
30 2.47 |
69 3.02 |
188 3.08 |
203 4.22 |
30 0.85 |
1.8 0.09 |
12 0.19 |
270 | 154 | 116 |
| aOne part per million is equivalent to one pound of substance per million pounds of water or 8.33 pounds per million gallons of water. bAn equivalent per million is a unit chemical equivalent weight of solute per million unit weights of solution. Concentration in equivalents per million is calculated by dividing the concentration in parts per million by the chemical combining weight of the substance or ion. |
||||||||||||||||||
Fig. 13--Graphical analyses of six water samples from Wichita and Greeley Counties.
Chemical Constituents in Relation to Use
The following discussion of the chemical constituents of ground water in relation to use has been adapted from publications of the U. S. Geological Survey and the State Geological Survey of Kansas.
Dissolved solids--When water is evaporated the residue consists mainly of the mineral constituents listed below and generally includes a small quantity of organic material and water of crystallization. The kind and quantity of the soluble mineral constituents in water determine its suitability for use. Water with less than 500 parts per million of dissolved solids generally is satisfactory for domestic use, except for difficulties resulting from hardness or occasionally excessive iron content. Water with more than 1,000 parts per million is likely to contain enough of certain mineral constituents to produce a noticeable taste or to make the water unsuitable in some other respect.
The dissolved solids in samples of water from Wichita and Greeley counties ranged from 198 to 1,065 parts per million. Five samples contained more than 500 parts per million but only one sample contained more than 1,000 parts per million (Table 12). The water is therefore suitable generally for most ordinary uses, in respect to dissolved solids.
Table 12--Summary of the chemical character of the samples of water from Wichita and Greeley counties.
| Range in parts per million |
Number of samples | |||
|---|---|---|---|---|
| Dakota formation |
Ogallala formation |
Alluvium | Ladder Creek |
|
| Dissolved solids | ||||
| 100-200 | 2 | |||
| 201-300 | 7 | |||
| 301-400 | 11 | 1 | ||
| 401-500 | 4 | 1 | ||
| 501-600 | 2 | |||
| More than 600 | 1 | 2 | ||
| Total hardness | ||||
| 0-100 | 1 | |||
| 101-200 | 11 | |||
| 201-300 | 13 | 1 | 1 | |
| 301-400 | 4 | |||
| Fluoride | ||||
| 0-0.5 | 4 | 1 | ||
| 0.6-1.0 | 4 | |||
| 1.1-1.5 | 5 | |||
| 1.6-2.0 | 10 | 1 | ||
| 2.1-2.5 | 3 | |||
| 2.6-3.0 | 1 | 2 | ||
| Iron | ||||
| Less then 0.10 | 4 | |||
| .10-.20 | 5 | |||
| .21-.30 | 6 | |||
| .31-.50 | 7 | |||
| .51-1.0 | 2 | |||
| 1.1-2.0 | 1 | 2 | ||
| 2.1-3.0 | 2 | |||
| 3.1-6.0 | 1 | 1 | ||
Hardness--The hardness of water is most commonly recognized by the quantity of soap needed to produce a lather in washing and by the curdy precipitate that forms before a permanent lather is obtained. Calcium and magnesium cause practically all the hardness of ordinary water and are the active agents in the formation of the greater part of all the scale formed in steam boilers and in other vessels in which water is heated or evaporated.
Hardness is of two types, carbonate hardness and noncarbonate hardness. Carbonate hardness is caused by calcium and magnesium bicarbonate and, because it can be removed almost entirely by boiling, it is often called temporary hardness. Noncarbonate, or permanent, hardness is caused by sulfates, chlorides, nitrates, and fluorides of calcium and magnesium and cannot be removed by boiling. In use with soap there is no difference between carbonate and noncarbonate hardness. In general, noncarbonate hardness forms harder scale on steam boilers.
Water having a hardness of less than 50 parts per million is considered as soft, and treatment to remove hardness is unnecessary. Hardness of 50 to 100 parts per million does not seriously interfere with the use of soap for most purposes but does increase the consumption of soap, and its removal by a softening process may be profitable for laundries or other industries using large quantities of soap. Hardness of more than 150 parts per million is easily noticeable and water having more than 200 parts per million is sometimes treated to soften it. Where municipal water supplies are softened the hardness is usually reduced to 100 parts per million or less.
Samples of water collected in Wichita and Greeley counties were moderately hard. Total hardness ranged from 81 to 386 parts per million.
Silica--Silica is a mineral constituent of most ground water. The silica in a water may be deposited with other scale-forming constituents in steam boilers, but otherwise it has no effect on the use of water for most purposes.
Iron--Normally if ground water contains much more than 0.2 to 0.3 part per million of iron, the excess will separate out and settle as a reddish sediment when exposed to the air. Iron, which may be present in sufficient quantity to give a disagreeable taste or to stain cooking utensils or bathroom fixtures, may be removed from most water by aeration and filtration, but some water requires additional treatment.
The maximum amount of iron in water samples collected in Wichita and Greeley counties was 5.1 parts per million, in a sample from alluvium. One sample contained no iron; only nine samples contained less than 0.2 part per million.
Fluoride--Fluoride is generally present only in small concentrations in ground water, but it is desirable to know the amount of fluoride in water that is used by children. Fluoride in water has been shown to be associated with the dental defect known as mottled enamel, which may appear on the teeth of children who, during the formation of the permanent teeth, drink water containing too much fluoride. Dean (1936, p. 1270) described as follows the mottling effects of fluoride in drinking water used by children:
From the continuous use of water containing about 1 part per million, it is probable that the very mildest forms of mottled enamel may develop in about 10 percent of the group. In waters containing 1.7 or 1.8 parts per million, the incidence may be expected to rise 40 or 50 percent, although the percentage distribtition would be largely of the very mild and mild types. At 2.5 parts per million an incidence of about 75 to 80 percent might be expected, with possibly 20 to 25 percent of all cases falling into the moderate or severe type. A scattering few may show the moderately severe type.
At 4 parts per million, the incidence is, in general, in the neighborhood of 90 percent, and as a rule, 35 percent or more of the children are classified as moderate or worse. In concentrations of 6 parts per million or higher an incidence of 100 percent is not unusual.
More recent studies have shown that concentrations of fluoride too small to cause objectionable mottling of tooth enamel--up to 1.0 to 1.5 parts per million--may help to prevent tooth decay. The United States Public Health Service (1946) has published standards that limit the amount of mineral constituents permissible in drinking water that is used in interstate commerce. The suggested maximum amount of fluoride is 1.5 parts per million.
The fluoride content of water samples collected in Wichita and Greeley counties ranged from 0.1 to 3.0 parts per million. Of the 31 samples collected 17 contained more than 1.5 parts per million.
Nitrate--The presence of nitrate in water was given new significance a few years ago when it was discovered that water high in nitrate might cause cyanosis in infants when used in the preparation of the baby's formula (Metzler and Stoltenberg, 1950). In cyanosis the baby becomes drowsy and listless and the skin takes on a blue color. In less severe cases recovery may take place in 8 to 24 hours if a change is made to water of low nitrate content, but death may result if the water supply is not changed. Nitrate in drinking water does not cause cyanosis in adults but may be responsible for certain digestive disorders.
Nitrate is derived from nitrate-bearing rocks and minerals in the water-bearing formations and from direct flow of nitrate-bearing surface water into the well or to percolation of surface water into the well from the soil zone at the top of the well. Soils, especially during the fall and winter, contain high concentrations of nitrate derived principally from plants, from animal wastes, and from nitro-bacterial action. Being very soluble, nitrate is readily dissolved from the soils by rainfall and carried into wells. Because privies, cesspools, and barnyards are sources of organic nitrogen, a large amount of nitrate in well water may indicate also the presence of harmful bacteria.
The Kansas State Board of Health considers that about 45 parts per million is the safe limit of nitrate (as NO3), and to use water in excess of this amount in the preparation of an infant's formula may be dangerous. All water samples from Wichita and Greeley counties contained nitrate, but only two contained more than 4.5 parts per million, the maximum concentration being 58 parts per million. Both wells were shallow, located in draws, and poorly covered. In addition, one was dug. Dug wells are usually less tightly sealed at the surface and less adequately cased than drilled wells, and as a consequence are more subject to contamination.
Water for Irrigation
The suitability of a water for irrigation depends mainly on the total quantity of dissolved mineral constituents and the percentage of sodium. The quantity of chloride may be large enough to affect the use of the water, and boron in some areas may be present in sufficient amounts to be harmful to plants. The total concentration of dissolved constituents may be expressed in terms of parts per million of dissolved solids, of total equivalents per million of anions and cations, or in terms of electrical conductivity. Electrical conductivity is a measure of the ability of inorganic salts in solution to conduct an electric current, and it is related to the concentration of dissolved solids. Approximate values for electrical conductivity can be obtained by multiplying total equivalents per million of anions or cations by 100, or by dividing dissolved solids in parts per million by 0.7 (Wilcox, 1948, pp. 4-5). The percentage of sodium is found by dividing the quantity of sodium, given in equivalents per million, by the sum of the quantities of calcium, magnesium, sodium, and potassium, also in equivalents per million, and expressing the result as a percentage.
The classification of water for irrigation use is shown in Table 13. (Wilcox, 1948a):
Table 13--Permissible limits for electrical conductivity and percentage of sodium of several classes of irrigation water.
| Classes of water | Electrical conductivity (micromhos at 25° C) |
Percent sodium |
|
|---|---|---|---|
| Rating | Grade | ||
| 1 | Excellent | less than 250 | less than 20 |
| 2 | Good | 250-750 | 20-40 |
| 3 | Permissible | 750-2,000 | 40-60 |
| 4 | Doubtful | 2,000-3,000 | 60-80 |
| 5 | Unsuitable | more than 3,000 | more than 80 |
Although the permissible limits of sodium and electrical conductance may vary with the type of soil, the crops, and the drainage, water containing more than 60 percent sodium or water having an electrical conductance of more than 2,000 is generally unfit for irrigation. With the exception of water from experimental well 17-42-36bbb, drilled to the Dakota formation, all samples of water from Wichita and Greeley counties are within the limits of safety suggested by Wilcox. No analysis was made for boron but it is probable that the quantity of boron was insufficient to be harmful to plants (Leonard, 1952, pp. 74, 76).
Sanitary Considerations
The analyses of water given in Tables 10 and 11 show only the amounts of dissolved mineral matter in the water and do not indicate its sanitary quality. The water in a well may contain mineral matter that imparts an objectionable taste or odor and yet may be free from harmful bacteria and may be safe for drinking. On the other hand, the water in a well may be clear and palatable and yet may contain harmful bacteria. An abnormal amount of certain mineral constituents, such as nitrate or chloride, sometimes indicates pollution.
Dug wells are more easily contaminated than properly constructed drilled wells, but great care should be taken to protect from pollution every well used for domestic or public supply. Drilled wells on the uplands generally penetrate relatively impervious silt above the water table and are less subject to pollution than shallow wells in valleys, where pervious sandy material may extend from the surface to the water table. Every well should be tightly sealed and, if possible, should be located in a raised area to prevent surface drainage from running into it. Wells should not be located near possible sources of contamination such as buildings, barnyards, or cesspools.
Quality of Water in Streams
A sample of water for analysis was taken from Ladder Creek on October 11, 1947, in eastern Wichita County in the SW NW sec. 8, T. 17 S., R. 35 W. Wichita County had received only a trace of precipitation in the first 10 days of October and only 0.81 inch of rainfall during September. Greeley County had received 0.04 inch of precipitation in the first 10 days of October and 0.67 inch during September. Because of the small amount of precipitation during September and October it is thought that the flow of Ladder Creek, which was only a few gallons a minute, was derived almost entirely from ground water. The chemical character of water from Ladder Creek was very similar to that of water collected from Ogallala and alluvial deposits in Wichita and Greeley counties.
Prev Page--Recharge, Discharge || Next Page--Formations
Kansas Geological Survey, Geology
Placed on web Jan. 11, 2008; originally published April, 1954.
Comments to webadmin@kgs.ku.edu
The URL for this page is http://www.kgs.ku.edu/General/Geology/Wichita/05_gw3.html