![]()
Prev Page--Ground Water Principles and Water Table || Next Page--Recovery, Utilization, Chemical character
Ground Water, continued
Recharge
Recharge is the addition of water to the ground-water reservoir and may be accomplished in several ways. Most usable ground water in Jewell County is derived from water that falls as rain or snow either within the county or on near-by areas north and west of the county. Once the water becomes a part of the ground-water body, it moves down the slope of the water table, later to be discharged at some point downstream.
The underground reservoir in Jewell County is recharged by local precipitation within the county, by percolation or subsurface inflow from areas north and west of the county, and by influent seepage from streams and ponds.
Recharge from Local Precipitation
The average annual precipitation in Jewell County is about 25 inches. Of this amount, part is returned to the atmosphere through evaporation, part is transpired by plants, and part is lost through immediate runoff as flood water. The remainder seeps downward through the soil and the underlying rocks into the zone of saturation.
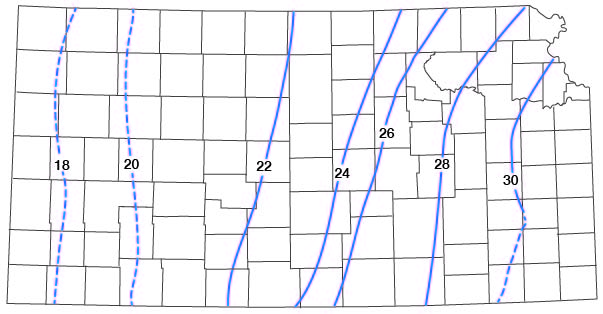
In Jewell County, the amount of the annual precipitation that is lost through evaporation and transpiration is about 22 or 23 inches, as shown in Figure 16. Thus, the amount of runoff, including both surface and ground-water runoff, averages about 2 or 3 inches a year.
Figure 16--Map of Kansas showing lines of mean annual water loss, in inches (Precipitation minus runoff), adapted from Williams and others (1940, Pl. 2).
The amount of recharge over an area as large as Jewell County is probably far from uniform because of variations in the amount of precipitation from one place to another and because of variations in the soil and geologic conditions affecting recharge.
Ground-water recharge may be determined by several recognized methods. A rise of ground-water levels and a decrease or halt in the decline of ground-water levels following precipitation or the melting of snow may indicate recharge. Increase in the discharge of springs or an increase of the ground-water discharge into a stream also may indicate recharge. Lysimeters for measuring the moisture penetration of soils and direct measurements of infiltration on experimental plots also have been used to determine the rate of recharge.
The records of 12 observation wells (Figs. 11-14) in the Limestone Creek area have been selected for a special study to determine the amount of ground-water recharge. The wells range in depth from 31 to 88 feet. They are water-table wells and most of them are not affected by pumping. In the following discussion the statements refer to the average water level in the 12 wells.
The annual cumulative rise of the water level in each well was determined from weekly and monthly measurements and is given in Table 9. The relation between the annual precipitation and the annual cumulative rise (summation of all the rises of the water level during the year) of the average water level in the 12 wells (Fig. 17A) indicates that for a year of normal precipitation (24.56 inches) the water levels rise an average of 2.86 feet, but when the annual precipitation is less than about 10 inches, generally the water levels do not rise. High rates of precipitation tend to steepen the curve, indicating that recharge to the zones of soil belt and aeration remains fairly constant in a favorable condition for recharge and a small increase in the annual precipitation results in a greater rise of the water levels. A higher percentage of the precipitation is ground-water recharge during years of above-normal precipitation and a lower percentage during years of below-normal precipitation.
Table 9--Annual cumulative rise of water levels, in feet (Based on weekly measurements)
| Well number |
Year | |||||||
|---|---|---|---|---|---|---|---|---|
| 1935 | 1936 | 1937 | 1938 | 1939 | 1940 | 1941 | 1942 | |
| 3-9-5cd | 0.41 | 0.80 | 4.31 | 1.09 | 0.97 | 0.72 | 5.05 | 3.67 |
| 3-9-30 (1) | 5.07 | 0.00 | 0.80 | 3.31 | 3.45 | 0.68 | 10.64 | 7.17 |
| 3-9-31 (1) | 5.00 | 3.47 | 2.89 | 5.63 | 4.64 | 7.95 | 13.63 | 12.83 |
| 3-10-29cd | 4.34 | 1.12 | 2.73 | 1.30 | 1.36 | 0.15 | 1.28 | 10.99 |
| 4-9-15bd | 1.43 | 1.45 | 1.18 | 1.95 | 1.17 | 0.67 | 1.16 | 4.38 |
| 4-9-28ca | 6.04 | 3.05 | 3.31 | 3.68 | 4.38 | 2.54 | 4.55 | 6.28 |
| 4-10-23cc | 6.92 | 0.96 | 3.04 | 1.96 | 3.27 | 1.55 | 6.45 | 11.51 |
| 4-10-24ca | 7.34 | 1.38 | 1.71 | 1.91 | 0.56 | 0.25 | 4.90 | 4.43 |
| 5-9-6 (2) | 6.85 | 1.35 | 2.52 | 2.96 | 2.11 | |||
| 5-9-10ab | 6.46 | 2.12 | 2.31 | 2.73 | 2.94 | 0.92 | 8.30 | 2.24 |
| 5-9-29bb | 3.58 | 1.87 | 3.33 | 1.89 | 9.011 | 0.20 | 4.23 | 4.82 |
| 6-9-27ab | 8.22 | 1.40 | 2.57 | 2.38 | 4.10 | 0.47 | 7.49 | 1.45 |
| Average | 5.13 | 1.58 | 2.56 | 2.57 | 2.632 | 1.463 | 6.153 | 6.283 |
| 1. Probably some surface inflow during period. 2. Average of 11 wells; well 5-9-29bb omitted. 3. Average of 11 wells. well 5-9-6(2) omitted; dry most of year. |
||||||||
Figure 17--Graphs showing the relation of annual precipitation at Burr Oak to A, annual cumulative rise of water levels; B, annual net change of water levels; and C, annual cumulative decline of water levels.
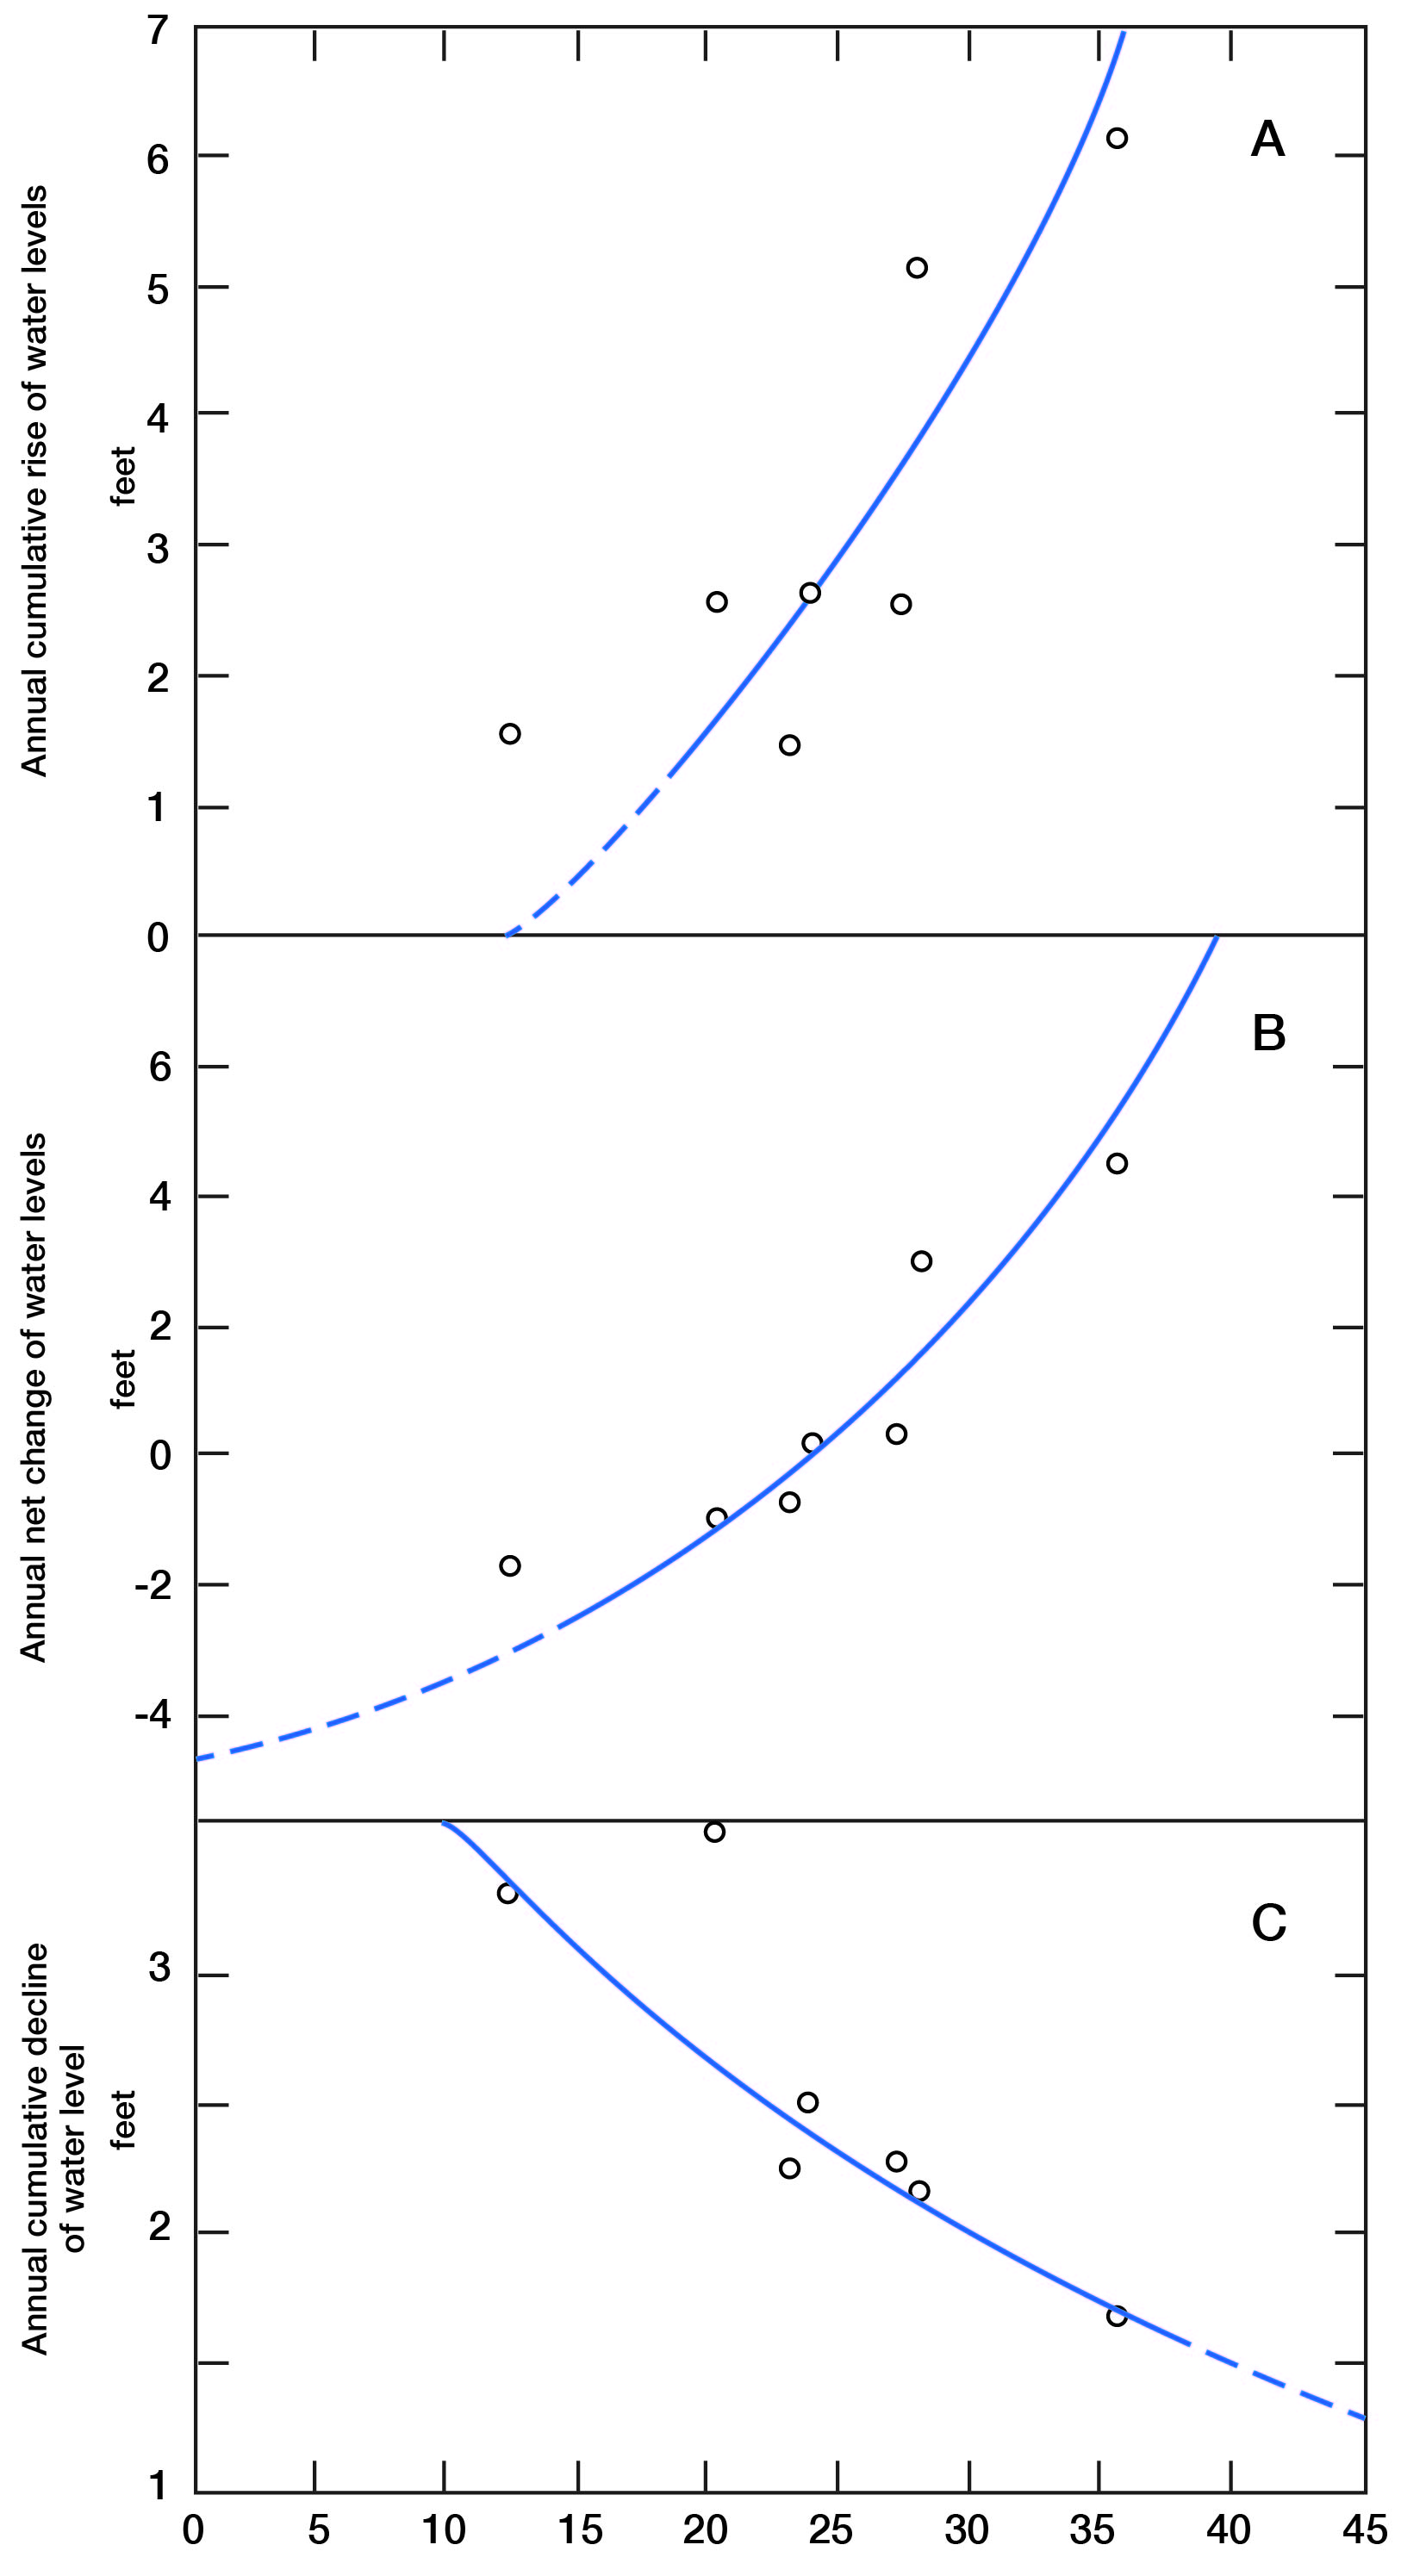
The annual net rise or decline of the water levels is given in Table 10. The relation between the annual net change and precipitation (Fig. 17B) indicates that for a year of no precipitation the net decline of the water levels would be about 4.6 feet. For normal precipitation, the water levels would have a small net rise. A longer record of measurements or a larger number of wells might show that for normal precipitation there would be no net annual change of the water levels.
Table 10--Annual net rise or net decline of water levels, in feet, in 12 wells in Jewell County
| Well number |
Year | |||||||
|---|---|---|---|---|---|---|---|---|
| 1935 | 1936 | 1937 | 1938 | 1939 | 1940 | 1941 | 1942 | |
| 3-9-5cd | -0.20 | -1.00 | -0.50 | -0.11 | +0.71 | +0.10 | +3.48 | +1.40 |
| 3-9-30 (1) | +2.90 | -2.68 | -1.50 | +2.21 | +1.62 | -2.35 | +6.12 | +2.83 |
| 3-9-31 (1) | +5.60 | -1.48 | -1.86 | +2.17 | -0.23 | -0.80 | +9.00 | +7.34 |
| 3-10-29cd | +4.17 | -4.14 | +0.27 | -0.04 | +0.44 | -0.80 | +0.90 | +10.32 |
| 4-9-15bd | -0.06 | +0.02 | -0.30 | +0.24 | +0.18 | +0.02 | +0.53 | +3.38 |
| 4-9-28ca | +2.80 | -1.60 | -1.12 | -0.10 | -0.03 | -1.27 | +2.22 | +2.47 |
| 4-10-23cc | +4.80 | -2.88 | -0.75 | -1.07 | +1.10 | +0.84 | +6.76 | +1.90 |
| 4-10-24ca | +4.00 | -2.80 | -1.59 | -0.53 | -1.08 | -1.35 | +4.25 | +3.29 |
| 5-9-6 (2) | +3.60 | -1.80 | -0.68 | -0.70 | -0.97 | |||
| 5-9-10ab | +3.15 | -0.29 | -1.14 | +0.63 | +0.18 | -0.87 | +7.69 | +2.00 |
| 5-9-29bb | +1.62 | +0.20 | -1.60 | +0.48 | -0.70 | -0.60 | +4.00 | +1.06 |
| 6-9-27ab | +3.40 | -1.90 | -0.95 | +0.45 | +0.50 | -1.55 | +4.60 | -0.12 |
| Average | +2.98 | -1.70 | -0.98 | +0.30 | +0.14 | -0.78 | +4.50 | +3.26 |
For a year of normal precipitation, the water levels have a normal cumulative rise of about 2.86 feet. The cumulative departure from the normal cumulative rise of the average water levels is given in Table 11. Graphs of the cumulative departure from normal annual rise of the average water levels, and the cumulative departure from normal precipitation are shown in Figure 18. The graphs indicate that for a large part of the record there is a close correlation between precipitation and rise of the water levels and that for normal precipitation there is a normal rise of the water levels.
Figure 18--Relation between A, cumulative departure from normal annual rise of average water levels, and B, cumulative departure from normal precipitation.
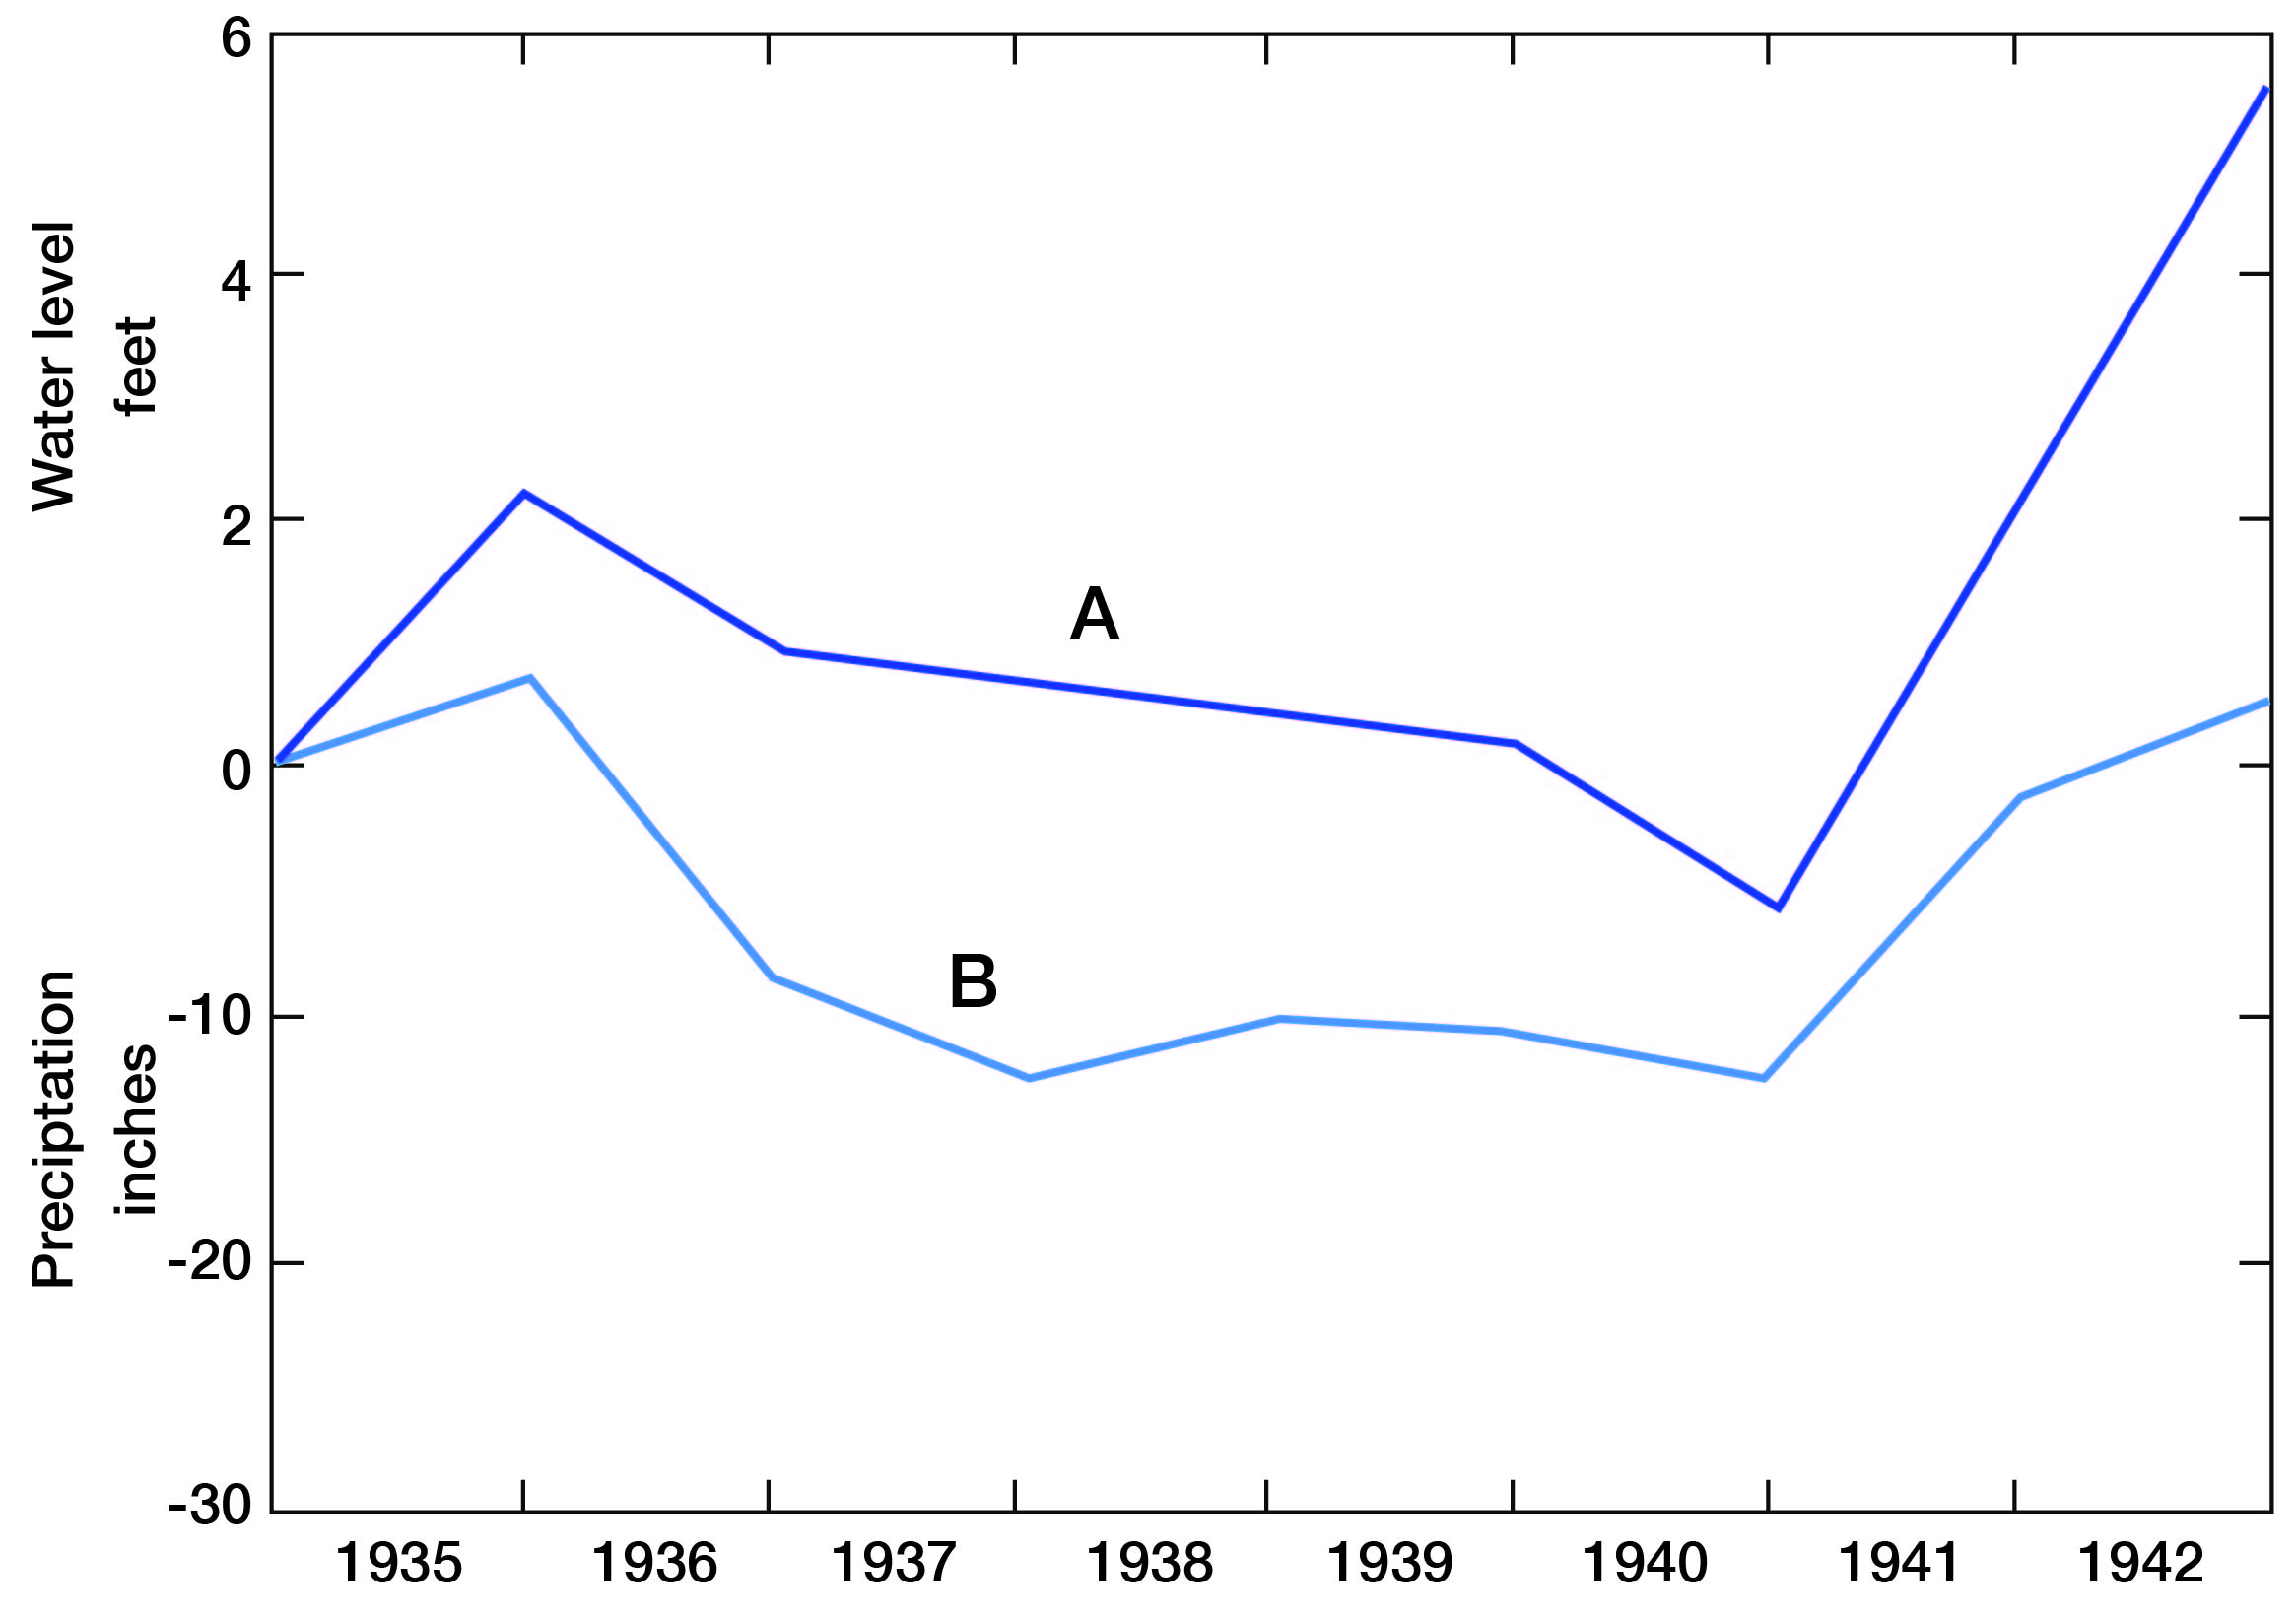
Table 11--Average annual cumulative rise of the water levels in 12 observation wells in Jewell County, and departure from normal average cumulative rise of water levels, and cumulative departure from normal precipitation near Burr Oak.
| Year | Cumulative rise of water levels, feet |
Departure from normal cumulative rise of average water levels, feet |
Cumulative departure from normal cumulative rise of average water levels, feet |
Precipitation, inches |
Departure from normal precipitation, inches |
Cumulative departure from normal precipitation, inches |
|---|---|---|---|---|---|---|
| (A)1 | (B)2 | (C)3 | (D) | (E)4 | (F)5 | |
| 1935 | 5.13 | +2.27 | +2.27 | 28.02 | +3.46 | +3.46 |
| 1936 | 1.58 | -1.28 | +0.99 | 12.38 | -12.18 | -8.72 |
| 1937 | 2.56 | -0.30 | +0.69 | 20.37 | -4.19 | -12.91 |
| 1938 | 2.57 | -0.29 | +0.40 | 27.20 | +2.64 | -10.27 |
| 1939 | 2.63 | -0.23 | +0.17 | 23.89 | -0.67 | -10.94 |
| 1940 | 1.46 | -1.40 | -1.23 | 23.01 | -1.55 | -12.49 |
| 1941 | 6.15 | +3.29 | +2.06 | 35.60 | +11.04 | -1.45 |
| 1942 | 6.28 | +3.42 | +5.48 | 28.10 | +3.54 | +2.09 |
| 1. From Table 8. 2. Column A-2.86. 3. Column B cumulative. 4. Column D-24.56. 5. Column E cumulative. |
||||||
Percolation from Outside the Area
The movement of ground water in Jewell County is, in general, from the northwest to the southeast. The drainage basin of White Rock Creek extends into Smith County. Thus, part of the ground-water recharge in Smith County percolates into Jewell County. As the permeability of the deposits overlying bedrock is very low, the amount of ground-water recharge to the water table by percolation from outside the county is very small.
Some wells in Jewell County obtain part of their water supply from the Dakota. The direction of movement of the water in the Dakota in Jewell County has not been determined, but this movement is limited by the permeability of the sandstone and the hydraulic gradient, neither of which is known. The Dakota is not an important source of ground water in Jewell County as the water is generally too highly mineralized for domestic use.
Seepage from Streams and Ponds
Two factors determine whether a stream or pond is capable of supplying water to the underground reservoir. First, the water surface of the stream or pond must be above the water table; and second, the material between the stream channel or pond and the water table must be sufficiently permeable to permit water to percolate downward. If the water surface of the stream or pond is lower than the water table, the process is reversed--that is, the ground-water reservoir will discharge water into the stream or pond.
Republican River and part of White Rock Creek are the only perennial streams in Jewell County. The water table was below the bed of the other creeks at the time of this investigation during the summer of 1941. Most of the streams flow during and for a short time after a storm and the stream flow is composed almost entirely of surface runoff. The streams have an opportunity to recharge ground water only during intermittent periods of surface runoff.
A prevalent opinion among local residents is that nearly all ground-water recharge comes from streams and ponds. If this were true, the slope of the water table would be away from the streams instead of toward them as pointed out in the section discussing the shape and slope of the water table. In Jewell County the amount of recharge from streams is negligible compared to the recharge from local precipitation.
During 1934 and 1936, when many domestic wells went dry, many farmers constructed ponds for watering their stock and replenishing their ground-water supply. The farm-pond program, sponsored by Federal and State agencies, has proved very successful in Jewell County. Many farmers have been able to keep more stock by watering them directly from the ponds than would have been possible if they had depended on the meager ground-water supplies. Also, many data are available showing that the ponds contribute considerable recharge that becomes available to wells down gradient from the pond. Reports have been received from the farmers that many wells, which are now furnishing adequate water supplies for domestic use, had been dry prior to the construction of up-gradient ponds. Additional qualitative evidence that the water table receives recharge from the ponds is the luxurious growth of vegetation in the valley down gradient from the ponds.
Thirteen wells were bored near a pond on the L. C. Beeler farm northwest of Ionia to determine the effect of the pond on the water table. Periodic measurements of the water levels were made for several years subsequent to 1934 and have been published in the annual series of water-level reports of the Federal Geological Survey. The location of the wells with respect to the pond is shown by Meinzer and Wenzel (1938, p. 109). The water table slopes from the pond, showing that the movement of ground water is away from the pond. The water-level measurements show that the greatest effect of the pond is a short distance down gradient. At a greater distance downstream, much of the ground-water recharge is intercepted by transpiration and the effect of the pond on ground-water recharge is obscured.
Discharge
Seepage into Streams
A stream whose bed is lower than the water table receives water from the zone of saturation, but a stream whose bed is above the water table cannot receive water from the zone of saturation. All streams in Jewell County except Republican River and part of White Rock Creek are above the water table and carry water only after storms. Information for determining the amount of ground water discharged into streams in Jewell County is not available.
Discharge from Springs
There are a few small springs in Jewell County. Many seeps from the Fort Hays limestone member have been observed following periods of heavy precipitation. Percolating ground water in the Fort Hays limestone member reaches the impervious Carlile shale where it cannot continue to move downward so it moves laterally and seeps out on the hillsides.
Discharge by Transpiration and Evaporation
Water may be taken into the roots of plants directly from the zone of saturation or from the capillary fringe and discharged from the plants by transpiration (Meinzer, 1923a, p. 48). The discharge of ground water by transpiration and evaporation varies considerably with different plants. White (1932, p. 89) estimated that the seasonal discharge of ground water by alfalfa in the Escalante Valley, Utah, is about 24 inches, which is only 1 inch less than normal precipitation in Jewell County. According to the census reports, 10 percent of the county was in alfalfa at one time. The large alfalfa acreage may account for some of the reported declines in water level.
The total ground-water discharge--transpiration and evaporation, percolation out of the area, and discharge from wells and springs--in Jewell County is equal to the total recharge, as expressed by the cumulative rise of water levels minus or plus the annual net change of the water levels. Ground-water discharge from wells and springs is computed to be about 1 percent of the total discharge. The annual change in water level indicating ground-water discharge from 1935 to 1942 is given in Table 12 and is shown in Figure 17C. The graph shows that ground-water discharge decreases as precipitation increases, indicating that the greater part of the ground-water discharge may be by transpiration. During years of high precipitation, most of the water required for transpiration may be derived from soil moisture. During dry years, the soil moisture becomes nearly depleted and water to supply the needs of the vegetation is obtained from the zone of saturation. The curve indicates that for a year of normal precipitation, the total decline representing ground-water discharge is about 2.3 feet.
Table 12--Annual cumulative rise of water levels, annual net change of the water levels, and annual ground-water discharge as expressed by decline of water levels in observation wells in Jewell County
| Year | Annual cumulative rise of water levels, feet |
Annual net change of water levels, feet |
Annual ground-water discharge, feet* |
|---|---|---|---|
| 1935 | 5.13 | +2.98 | 2.15 |
| 1936 | 1.58 | -1.70 | 3.28 |
| 1937 | 2.56 | -0.98 | 3.54 |
| 1938 | 2.57 | +0.30 | 2.27 |
| 1939 | 2.63 | +0.14 | 2.49 |
| 1940 | 1.46 | -0.78 | 2.24 |
| 1941 | 6.15 | +4.50 | 1.65 |
| 1942 | 6.28 | +3.26 | 3.02 |
| *Annual cumulative rise of water levels minus annual net change of water levels. |
|||
The cumulative rise of water levels, the net change of water levels, and the annual ground-water discharge depend not only on the amount of precipitation during the current year but also on the seasonal distribution of precipitation and on soil-moisture conditions at the beginning of the year, which are related to the precipitation during the preceding year. The curves in Figure 17 indicate the amount of ground-water recharge and discharge that might be expected for a given amount of annual precipitation. The annual cumulative rise of water levels, the annual net change of water levels, and the annual decline indicating ground-water discharge that might be expected for a given amount of precipitation are given in Table 13. If the precipitation in a given year amounted to less than about 10 inches, the curves in Figure 17 indicate that there would be little or no rise of the water levels and the net decline of the water levels in that year would be about equal to the ground-water discharge.
Table 13--Expected annual cumulative rise, annual net change, and annual decline of water levels indicating ground-water discharge for given amounts of precipitation in the Limestone Creek area (From Fig. 17)
| Annual precipitation, inches |
Annual cumulative rise of water levels, feet |
Annual net change of water levels, feet |
Annual ground-water discharge, feet* |
|---|---|---|---|
| 0 | 0 | -4.60 | 4.60 |
| 10 | 0 | -3.58 | 3.58 |
| 15 | 0.52 | -2.58 | 3.10 |
| 20 | 1.69 | -1.01 | 2.70 |
| 24.56 | 2.86 | 0.52 | 2.34 |
| 25 | 2.90 | 0.56 | 2.34 |
| 30 | 4.45 | 2.43 | 2.02 |
| 35 | 6.52 | 4.78 | 1.74 |
| 40 | 10.00 | 8.50 | 1.50 |
| *Annual cumulative rise of water levels minus annual net change of water levels. |
|||
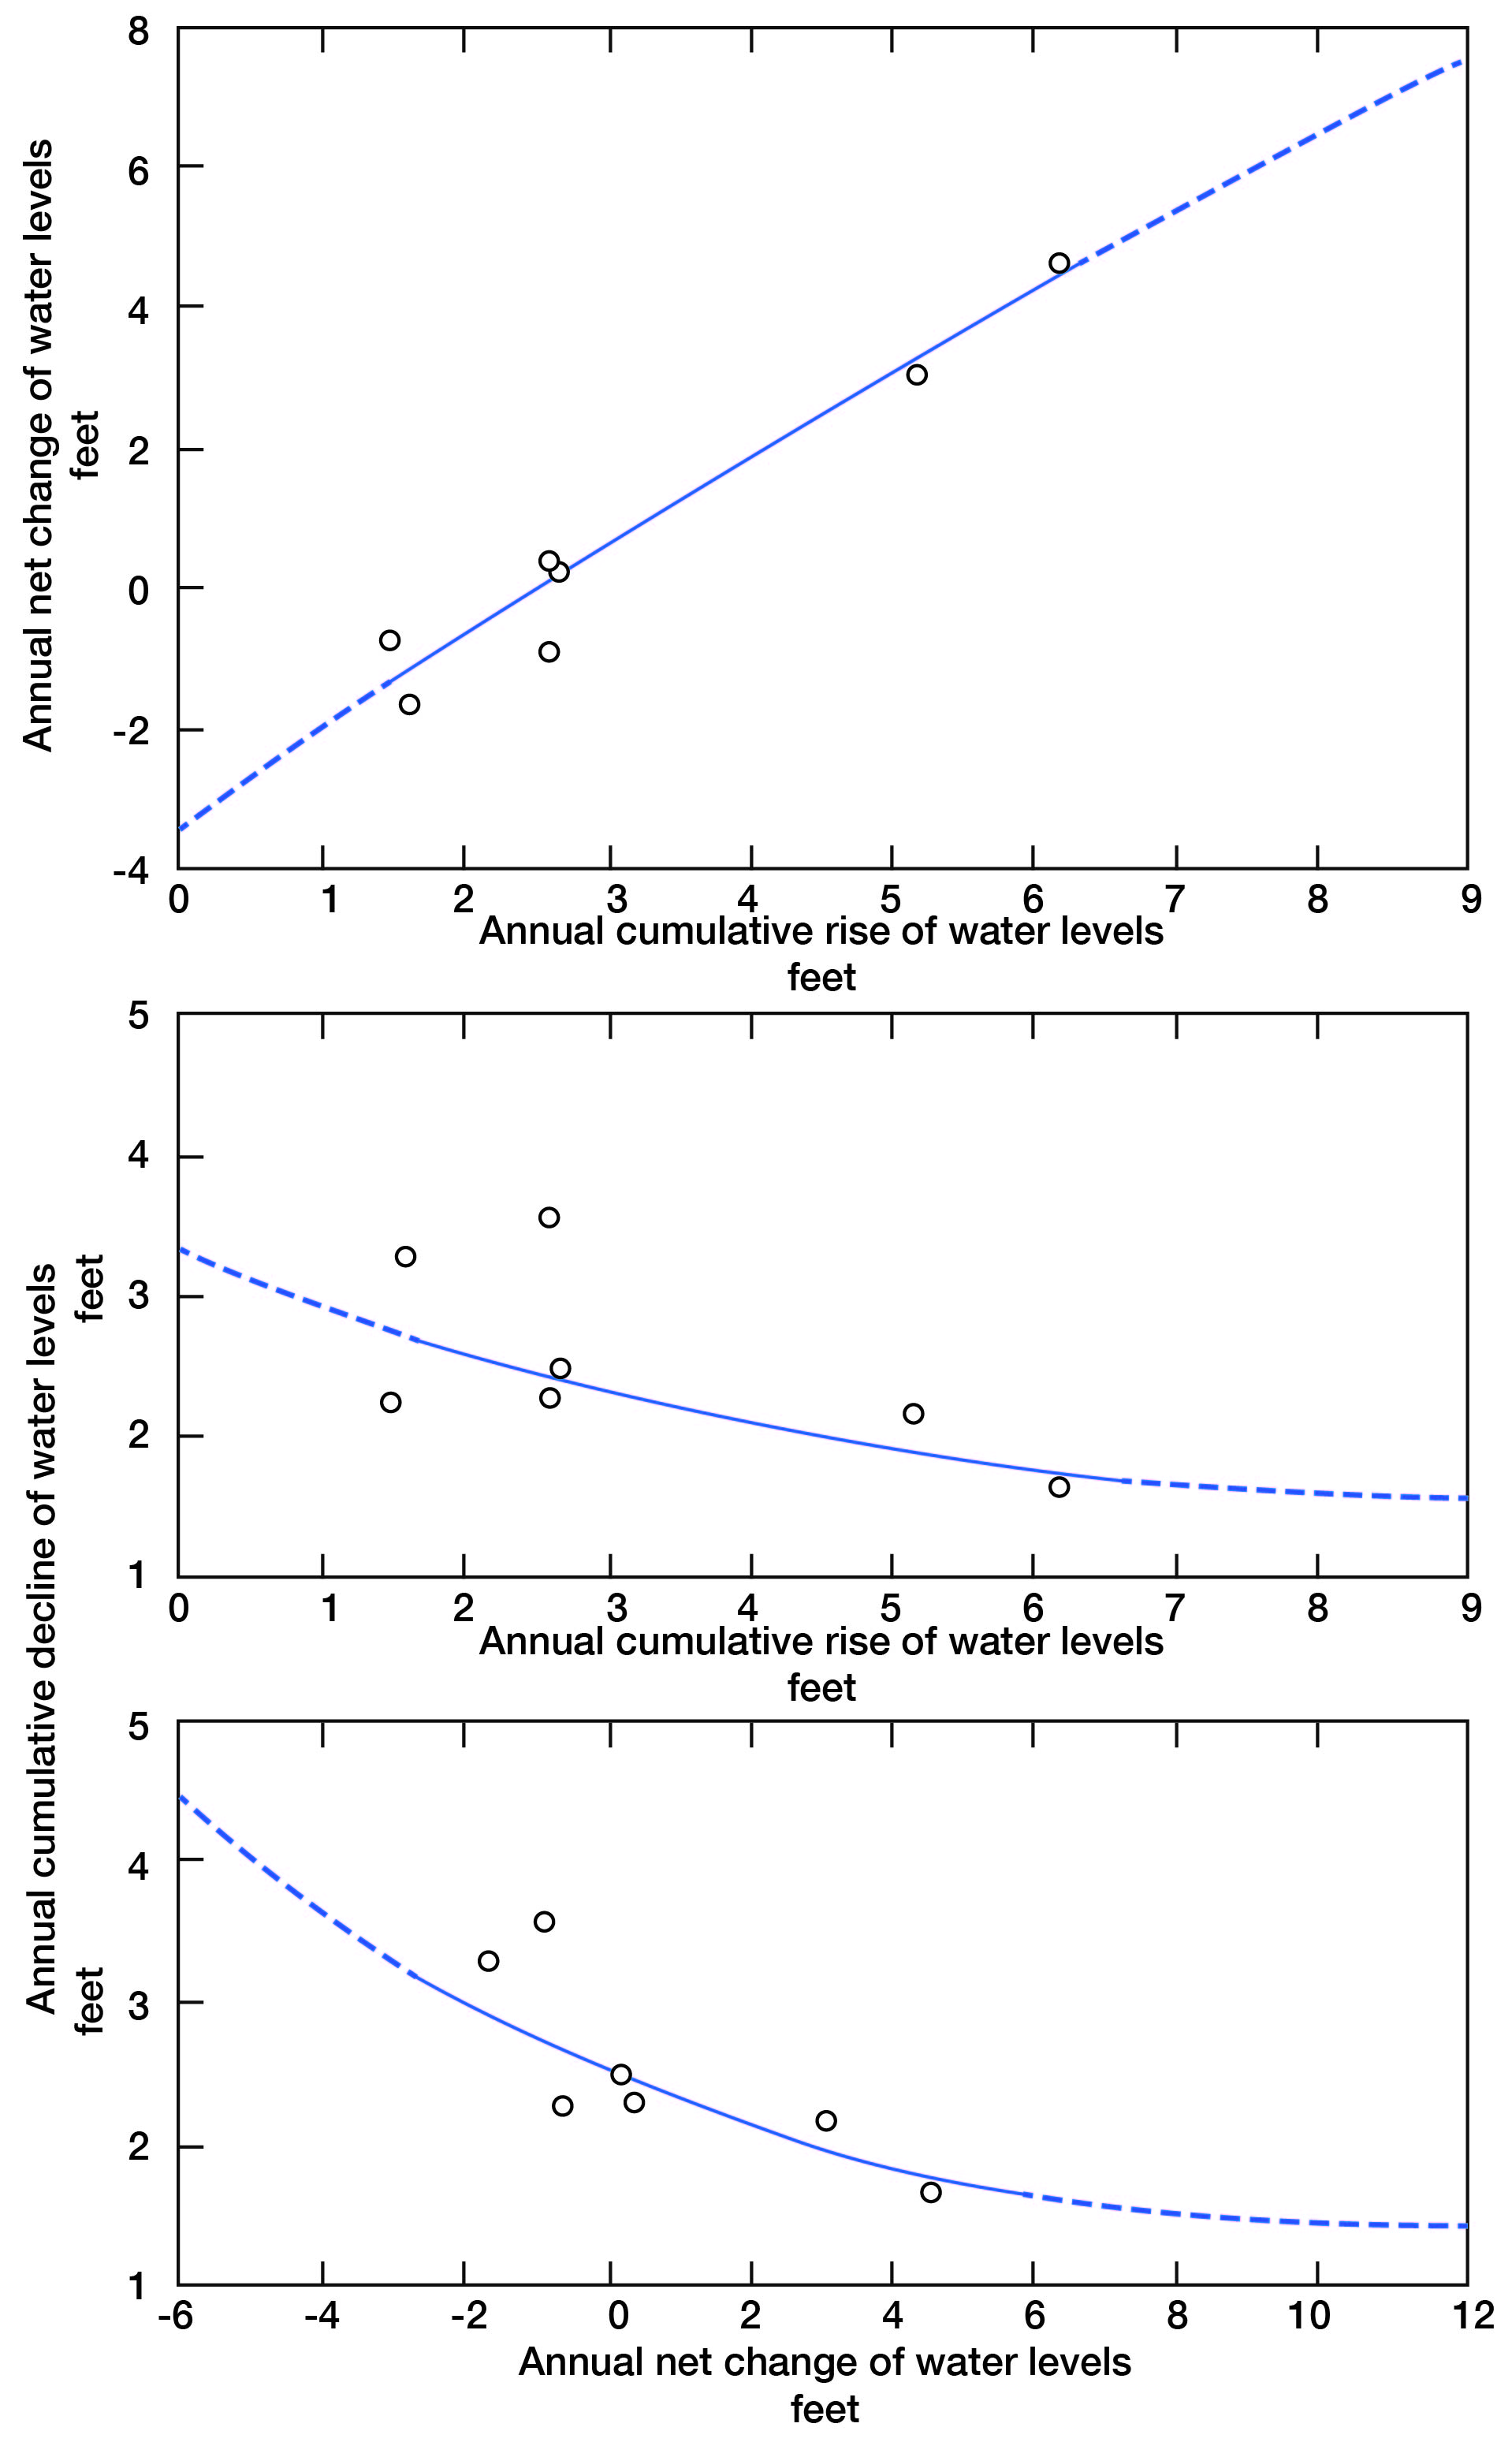
In Figure 17 it was shown that a relation exists between the amount of annual precipitation and the following three variables: (1) cumulative rise of water levels, (2) annual net change of water levels, and (3) annual ground-water discharge. If these three variables are related to precipitation, then each of the variables is related to the other two. These relations are illustrated in Figure 19.
Figure 19--Graphs showing the relation of A, annual net change of water levels to annual cumulative rise of water levels; B, annual cumulative decline of water levels to annual cumulative rise of water levels; and C, annual cumulative decline of water levels to annual net change of water levels.
Discharge by Percolation
The water table in Jewell County slopes to the southeast, indicating that ground water is moving by percolation southeastward out of the county. Well records and test holes indicate that the saturated water-bearing material has an average thickness of about 15 feet. A pumping test at Jewell City indicated a permeability of about 25 gallons per day per square foot. However, judging from the character of the water-bearing material at Jewell City and that in other parts of the county, the average permeability throughout the county is probably less than 25. The water table has a slope of about 10 feet to the mile. The south and east sides of the county are 30 miles in length which gives a cross sectional length perpendicular to the direction of flow of about 42 miles. For the given conditions, the underflow leaving the county would be equal to the coefficient of permeability (25) times the hydraulic gradient in feet per mile (10) times the saturated thickness in feet (15) times the length of the cross section in miles (42), which is equal to about 150,000 gallons a day or about 7 million cubic feet a year. This would be equivalent to about 0.003 inch of water spread evenly over the county--a very low figure, yet one that probably is too high because of the assumed value of permeability.
Figure 17C indicates that when the amount of annual precipitation is high, the loss of ground water by transpiration will be small and underflow will constitute most of the natural ground-water discharge. The annual discharge by underflow remains approximately constant. If the curve in Figure 17C is correct as drawn and can be extrapolated to the right, it would flatten for high values of annual precipitation. Under such conditions of high precipitation, practically no ground water would be discharged by transpiration, and the ground-water discharge shown by the flattened part of the curve would be almost entirely in the form of percolation out of the basin (excepting a negligible amount of discharge by pumping). If the precipitation became sufficient to produce effluent seepage, the curve would rise to the right, indicating an increase in ground-water discharge as the annual precipitation increases. If the flattened part of the curve were extended to the left, the extended line would indicate approximately the amount of discharge by percolation during years of normal or subnormal precipitation, and the remaining part above this extended line would represent the discharge of ground water by transpiration and evaporation.
Discharge from Wells
The discussion above relates to natural discharge of ground water in Jewell County. The remainder of the ground water discharged within the county comes from wells and is very small in comparison with the natural discharge.
According to the 1940 census, Jewell County had a population of 11,970. The total number of livestock was listed at about 65,000 and poultry at about 250,000. On the assumption that the average per-capita use of water is about 50 gallons a day, that each head of livestock averages 10 gallons a day, and that poultry averages 0.05 gallon a day, the average daily use of water in Jewell County is about 1,300,000 gallons. The annual use of ground water would amount to about 470,000,000 gallons or about 1,400 acre-feet, which would be equal to about 0.03 inch of water spread over the county.
Permeability of Water-bearing Materials
General Considerations
The permeability of a water-bearing formation is expressed by Meinzer's coefficient of permeability (Stearns, 1928, p. 148), as the rate of flow, in gallons per day, through a square foot of its cross section under a hydraulic gradient of 100 percent at a temperature of 60° F., or as the number of gallons a day, at 60° F., that is conducted laterally through each mile of water-bearing bed under investigation (measured at right angles to the direction of flow), for each foot of thickness of the bed and for each foot per mile of hydraulic gradient. Thus, the quantity of water that will percolate through a given cross section of water-bearing material under a known hydraulic gradient is directly proportional to the coefficient of permeability of the material. In order to compute the quantity of ground water that percolates into or out of a ground-water basin, reservoir, specific well, or well field, the coefficient of permeability of the material must be determined. The coefficient of transmissibility is equal to the field coefficient of permeability (same as the coefficient defined above, except that it is for the prevailing temperature of the ground water) multiplied by the saturated thickness of the aquifer, in feet.
Pumping Test
The pumping-test method of determining permeability consists of pumping a well that penetrates water-bearing material whose permeability is to be determined and observing the decline of the water table around the pumped well and the rate of recovery of the water level in the pumped well. In the above tests the rate of decline of the water table was determined by boring 3-inch observation wells in the vicinity of the pumped well and periodically measuring the depths to the water level in the observation wells.
Thiem method--The Thiem method was used in computing the coefficient of permeability from the data collected at the Jewell City pumping test. This method is described by Wenzel (1942, pp. 81-87).
The Thiem formula for water-table conditions is
P = Q(loger2 - loger1) / π(h2+h1)(s1-s2)
in which P is the coefficient of permeability, Q is the discharge of the pumped well, h1 is the saturated thickness of the water-bearing material at the nearer of two observation wells at a distance r1 from the pumped well, h2 is the thickness of the saturated water-bearing material at the other observation well at a distance r2 from the pumped well, and s1 and s2 are the drawdowns in the observation wells. If m is defined as the average of the thickness of the saturated part of the water-bearing material at the two observation wells and if the logarithms with base e are converted to logarithms with base 10, the formula is reduced to the formula given by Wenzel 1942, p. 81).
P = [527.7qlog10(r2/r1)] / [m(s1-s2)]
in which P is the coefficient of permeability as defined above and q is the rate of pumping in gallons a minute.
Jewell City pumping test--A pumping test was made on well 4-7-30da2 (Jewell City municipal well 2) from 9:20 a. m. September 26, 1941, to 10:08 a.m. October 17, 1941. The locations of the pumped well and observation wells are shown in Figure 10 and their descriptions, water-level measurements, and the cumulative discharge of the pumped well are given in Table 14. The well, which was equipped with an electrically driven lift pump with a capacity of about 3.2 gallons a minute, discharged through a water meter into the city main. The yield of the well was less than the capacity of the pump resulting in a diminishing of the pumping rate from about 3.2 gallons a minute at the beginning of pumping to about 1.9 gallons a minute after 10 days of pumping. The rates of pumping for the first 10 days are shown in Figure 20. The curve in Figure 20 is extended to show what the pumping rate would be from 10 to 100 days after pumping started. The extension is based on the assumption that the yield of the well would continue to diminish at a rate defined by the equation of the curve for the first 10 days of pumping.
Table 14--Water levels in observation wells, in feet above datum plane, and cumulative discharge of well 4-7-30da2 (Jewell City well 2), in gallons a minute, during the Jewell City pumping test. (For location of wells refer to Figure 7. The datum is 100 feet below a benchmark on south guard rail on bridge, 0.3 mile west of well.)
| J1. 60 feet west of pumped well, diameter 3 inches, depth 38.4 feet. Measuring point, top of casing, 1.5 feet above land surface, 95.64 feet above datum. | ||
| Date, 1941 | Hour | Water level |
|---|---|---|
| Sept. 24 | 3:30 p.m. | 64.08 |
| 25 | 8:30 a.m. | 64.01 |
| 26 | 8:35 | 64.15 |
| 26 | 9:20 | a |
| 26 | 11:25 | 64.10 |
| 26 | 11:45 | 64.10 |
| 26 | 12:25 p.m. | 64.06 |
| 26 | 1:00 | 64.03 |
| 26 | 1:25 | 64.00 |
| 26 | 2:00 | 63.97 |
| 26 | 2:26 | 63.95 |
| 26 | 2:53 | 63.93 |
| 26 | 3:25 | 63.91 |
| 26 | 3:55 | 67.89 |
| 26 | 4:25 | 63.86 |
| 26 | 4:55 | 63.84 |
| 26 | 10:50 | 63.56 |
| 27 | 8:28 a.m. | 63.17 |
| 27 | 10:37 | 63.10 |
| 27 | 11:55 a.m. | 63.06 |
| 27 | 2:10 p.m. | 62.98 |
| 27 | 3:25 | 62.94 |
| 27 | 6:36 | 62.64 |
| 28 | 8:17 a.m. | 62.42 |
| 28 | 10:30 | 62.35 |
| 28 | 11:40 | 62.35 |
| 28 | 2:00 p.m. | 62.27 |
| 28 | 4:00 | 62.25 |
| 28 | 4:40 | 62.26 |
| 29 | 8:55 a.m. | 62.04 |
| 30 | 9:10 | 62.01 |
| 30 | 3:45 p.m. | 61.96 |
| Oct. 1 | 10:00 a.m. | 61.89 |
| 2 | 9:06 | 61.97 |
| 5 | 12:10 p.m. | 61.74 |
| 6 | 3:00 | c |
| 7 | c | |
| 8 | 10:20 a.m. | 68.97 |
| 10 | 4:10 p.m. | 76.46 |
| 11 | 4:05 | 73.83 |
| 13 | 2:15 | 70.94 |
| 14 | 3:45 | 69.14 |
| 16 | 9:05 a.m. | 67.98 |
| 17 | 9:55 | 67.79 |
| 17 | 10:08 | b |
| 17 | 10:24 | 67.79 |
| 17 | 10:53 | 67.78 |
| 17 | 11:08 | 67.78 |
| 17 | 11:48 | 67.80 |
| 17 | 12:35 p.m. | 67.83 |
| 17 | 1:30 | 67.88 |
| 17 | 3:00 | 67.95 |
| 17 | 4:00 | 67.98 |
| 17 | 4:48 | 68.00 |
| 18 | 9:10 a.m. | 68.01 |
| 18 | 2:15 p.m. | 68.02 |
| J2. 30 feet west of pumped well, diameter 3 inches, depth 39.4 feet. Measuring point, top of casing, at land surface, 95.26 feet above datum. | ||
| Date, 1941 | Hour | Water level |
|---|---|---|
| Sept. 24 | 3:31 p.m. | 64.94 |
| 25 | 8:31 a.m. | 64.55 |
| 26 | 8:36 | 64.12 |
| 26 | 9:20 | a |
| 26 | 11:26 | 64.04 |
| 26 | 11:46 | 64.03 |
| 26 | 12:26 p.m. | 63.98 |
| 26 | 1:00 | 63.94 |
| 26 | 1:26 | 63.91 |
| 26 | 2:01 | 63.88 |
| 26 | 2:27 | 63.86 |
| 26 | 2:54 | 63.83 |
| 26 | 3:26 | 63.80 |
| 26 | 3:56 | 63.77 |
| 26 | 4:26 | 63.74 |
| 26 | 4:56 | 63.71 |
| 26 | 10:51 | 63.42 |
| 27 | 8:29 a.m. | 63.07 |
| 27 | 10:38 | 63.01 |
| 27 | 11:55 a.m. | 62.96 |
| 27 | 2:10 p.m. | 62.89 |
| 27 | 3:24 | 62.86 |
| 27 | 6:37 | 62.68 |
| 28 | 8:18 a.m. | 62.27 |
| 28 | 10:30 | 62.27 |
| 28 | 11:40 | 62.26 |
| 28 | 2:00 p.m. | 62.23 |
| 28 | 4:00 | 62.18 |
| 28 | 4:41 | 62.16 |
| 29 | 8:56 a.m. | 61.96 |
| 30 | 9:02 | 62.46 |
| 30 | 3:45 p.m. | 62.30 |
| Oct. 1 | 10:02 a.m. | 62.02 |
| 2 | 9:05 | 61.86 |
| 5 | 12:10 p.m. | 61.82 |
| 6 | 3:00 | 62.11 |
| 7 | 5:00 | 63.02 |
| 8 | 10:20 a.m. | 64.02 |
| 9 | 4:05 p.m. | 69.61 |
| 10 | 4:10 | 63.17 |
| 11 | 4:05 | 62.96 |
| 13 | 2:15 | 62.88 |
| 14 | 3:45 | 63.57 |
| 16 | 9:05 a.m. | 63.09 |
| 17 | 9:55 | 63.07 |
| 17 | 10:08 | b |
| 17 | 10:52 | 63.18 |
| 17 | 11:10 | 63.41 |
| 17 | 11:49 | 63.69 |
| 17 | 12:36 p.m. | 64.14 |
| 17 | 1:31 | 64.64 |
| 17 | 3:01 | 65.19 |
| 17 | 4:01 | 65.45 |
| 17 | 4:50 | 65.61 |
| 18 | 9:13 a.m. | 66.68 |
| 18 | 2:13 p.m. | 66.81 |
| J3. 10 feet west of pumped well, diameter 3 inches, depth 39.2 feet. Measuring point, top of casing, 0.3 foot above land surface, 96.51 feet above datum. | ||
| Date, 1941 | Hour | Water level |
|---|---|---|
| Sept. 24 | 3:30 p.m. | 65.20 |
| 25 | 8:32 a.m. | 65.16 |
| 26 | 8:36 | 65.36 |
| 26 | 9:20 | a |
| 26 | 11:27 | 64.98 |
| 26 | 11:47 | 64.88 |
| 26 | 12:27 p.m. | 64.62 |
| 26 | 1:00 | 64.30 |
| 26 | 1:27 | 63.98 |
| 26 | 2:02 | 63.52 |
| 26 | 2:28 | 63.28 |
| 26 | 2:54 | 62.99 |
| 26 | 3:27 | 62.70 |
| 26 | 3:54 | 62.47 |
| 26 | 4:27 | 62.26 |
| 26 | 4:57 | 62.11 |
| 26 | 10:52 | 61.01 |
| 27 | 8:30 a.m. | 60.69 |
| 27 | 10:40 | 60.66 |
| 27 | 11:55 a.m. | 60.64 |
| 27 | 2:10 p.m. | 60.62 |
| 27 | 3:24 | 60.59 |
| 27 | 6:37 | 60.55 |
| 28 | 8:19 a.m. | 60.41 |
| 28 | 10:30 | 60.38 |
| 28 | 11:40 | 60.36 |
| 28 | 2:04 p.m. | 60.36 |
| 28 | 4:02 | 60.33 |
| 28 | 4:43 | 60.32 |
| 29 | 8:59 a.m. | 60.25 |
| 30 | 9:04 | 60.35 |
| 30 | 3:45 p.m. | 60.32 |
| Oct. 1 | 10:00 a.m. | 60.29 |
| 2 | 9:06 | 60.28 |
| 5 | 12:10 p.m. | 60.32 |
| 6 | 3:00 | 60.37 |
| 7 | 5:00 | 60.55 |
| 8 | 10:20 a.m. | 63.09 |
| 9 | 4:10 p.m. | 66.09 |
| 10 | 4:10 | 66.95 |
| 11 | 4:05 | 66.95 |
| 13 | 2:15 | 66.64 |
| 14 | 3:45 | 65.69 |
| 16 | 9:05 a.m. | 65.34 |
| 17 | 9:55 | 65.26 |
| 17 | 10:08 | b |
| 17 | 10:51 | 65.36 |
| 17 | 11:12 | 65.47 |
| 17 | 11:53 | 65.78 |
| 17 | 12:37 p.m. | 66.16 |
| 17 | 1:33 | 66.57 |
| 17 | 3:03 | 67.00 |
| 17 | 4:02 | 67.20 |
| 17 | 4:51 | 67.32 |
| 18 | 9:14 a.m. | 68.25 |
| 18 | 2:11 p.m. | 68.36 |
| J4. 10 feet east of pumped well, diameter 3 inches, depth 40.4 feet. Measuring point, top of casing, 0.3 foot above land surface, 97.09 feet above datum. | ||
| Date, 1941 | Hour | Water level |
|---|---|---|
| Sept. 24 | 3:30 p.m. | 65.08 |
| 25 | 8:32 a.m. | 65.28 |
| 26 | 8:36 | 65.26 |
| 26 | 9:20 | a |
| 26 | 11:27 | 65.37 |
| 26 | 11:48 | 65.35 |
| 26 | 12:28 p.m. | 65.33 |
| 26 | 1:05 | 65.30 |
| 26 | 1:27 | 65.28 |
| 26 | 2:02 | 65.26 |
| 26 | 2:28 | 65.25 |
| 26 | 2:54 | 65.23 |
| 26 | 3:27 | 65.21 |
| 26 | 3:58 | 65.20 |
| 26 | 4:28 | 65.19 |
| 26 | 4:58 | 65.18 |
| 26 | 10:53 | 65.09 |
| 27 | 8:32 a.m. | 65.00 |
| 27 | 6:37 p.m. | 65.29 |
| 28 | 8:19 a.m. | 64.88 |
| 28 | 10:30 | 64.83 |
| 28 | 11:40 | 64.80 |
| 28 | 2:04 p.m. | 64.82 |
| 28 | 4:02 | 64.85 |
| 28 | 4:43 | 64-82 |
| 29 | 8:59 a.m. | 64.86 |
| 30 | 9:05 | 64.91 |
| Oct. 1 | 3:47 p.m. | 64.89 |
| 2 | 9:03 a.m. | 64.93 |
| 5 | 12:08 p.m. | 64.99 |
| 6 | 2:58 | 65.11 |
| 7 | 5:00 | 65.09 |
| 8 | 10:20 a.m. | 65.57 |
| 9 | 4:05 p.m. | 66.61 |
| 10 | 4:10 | 67.87 |
| 11 | 4:05 | 68-52 |
| 13 | 2:15 p.m. | 68.65 |
| 14 | 3:45 | 68.50 |
| 16 | 9:05 a.m. | 68.31 |
| 17 | 9:55 | 68.32 |
| 17 | 10:08 | b |
| 17 | 10:56 | 68.32 |
| 17 | 11:14 | 68.31 |
| 17 | 11:50 | 68.33 |
| 17 | 12:35 p.m. | 68.34 |
| 17 | 1:35 | 68.35 |
| 17 | 3:05 | 68.39 |
| 17 | 4:03 | 68.41 |
| 17 | 4:52 | 68.42 |
| 18 | 9:15 a.m. | 68.65 |
| J5. 30 feet east of pumped well, diameter 3 inches, depth 39.0 feet. Measuring point, top of casing, 0.1 foot above land surface, 96.70 feet above datum. | ||
| Date, 1941 | Hour | Water level |
|---|---|---|
| Sept. 24 | 3:30 p.m. | 64.85 |
| 25 | 8:32 a.m. | 64.87 |
| 26 | 8:36 | 64.70 |
| 26 | 9:20 | a |
| 26 | 11:33 | 64.62 |
| 26 | 11:49 | 64.50 |
| 26 | 12:29 p.m. | 63.94 |
| 26 | 1:04 | 63.51 |
| 26 | 1:32 | 63.21 |
| 26 | 2:09 | 62.92 |
| 26 | 2:30 | 62.77 |
| 26 | 2:58 | 62.57 |
| 26 | 3:29 | 62.40 |
| 26 | 3:58 | 62.20 |
| 26 | 4:28 | 62.04 |
| 26 | 4:59 | 62.00 |
| 26 | 10:58 | 61.65 |
| 27 | 8:34 a.m. | 61.26 |
| 27 | 10:44 | 61.24 |
| 27 | 11:59 a.m. | 61.24 |
| 27 | 2:13 p.m. | 61.20 |
| 27 | 3:29 | 61.17 |
| 27 | 6:39 | 61.15 |
| 28 | 8:31 a.m. | 61.01 |
| 28 | 10:44 | 60.98 |
| 28 | 11:54 | 60.98 |
| 28 | 2:09 p.m. | 60.95 |
| 28 | 4:09 | 60.95 |
| 28 | 4:54 | 60.92 |
| 29 | 8:03 a.m. | 60.85 |
| 30 | 9:07 | 60.90 |
| 30 | 3:45 p.m. | 60.86 |
| Oct. 1 | 10:05 a.m. | 60.78 |
| 2 | 9:00 | 60.71 |
| 5 | 12:02 p.m. | 60.58 |
| 6 | 3:00 | 60.52 |
| 7 | 5:00 | 60.56 |
| 8 | 10:20 a.m. | 60.61 |
| 9 | 4:05 p.m. | 61.43 |
| 10 | 4:10 | 61.78 |
| 11 | 4:05 | 61.72 |
| 13 | 2:15 | 61.14 |
| 14 | 3:45 | 61.95 |
| 16 | 9:05 a.m. | 62.56 |
| 17 | 9:55 | 62.92 |
| 17 | 10:08 | b |
| 17 | 10:58 | 62.95 |
| 17 | 11:15 | 62.98 |
| 17 | 11:51 | 63.04 |
| 17 | 12:39 p.m. | 63.13 |
| 17 | 1:36 | 63.13 |
| 17 | 3:06 | 63.77 |
| 17 | 4:04 | 164.22 |
| 17 | 4:52 | 64.53 |
| 18 | 9:16 a.m. | 66.98 |
| 18 | 2:09 p.m. | 67.14 |
| J6. 60 feet east of pumped well, diameter 3 inches, depth 38.5 feet. Measuring point, top of casing, 0.4 foot above land surface, 96.30 feet above datum. | ||
| Date, 1941 | Hour | Water level |
|---|---|---|
| Sept. 24 | 3:30 p.m. | 64.94 |
| 25 | 8:32 a.m. | 64.90 |
| 26 | 8:36 | 64.86 |
| 26 | 9:20 | a |
| 26 | 11:34 | 64.82 |
| 26 | 11:50 | 64.81 |
| 26 | 1:05 p.m. | 64.78 |
| 26 | 1:32 | 64.72 |
| 26 | 2:09 | 63.08 |
| 26 | 2:31 | 62.53 |
| 26 | 2:59 | 62.08 |
| 26 | 3:30 | 61.78 |
| 26 | 3:59 | 61.60 |
| 26 | 4:29 | 61.46 |
| 26 | 5:00 | 61.36 |
| 26 | 10:59 | 61.03 |
| 27 | 8:35 a.m. | 60.90 |
| 27 | 10:45 | 60.89 |
| 27 | 11:59 | 60.90 |
| 27 | 2:14 p.m. | 60.87 |
| 27 | 3:29 | 60.87 |
| 27 | 6:39 | 60.84 |
| 28 | 8:31 a.m. | 60.75 |
| 28 | 10:45 | 60.71 |
| 28 | 11:55 | 60.71 |
| 28 | 2:10 p.m. | 60.69 |
| 28 | 4:10 | 60.67 |
| 28 | 4:55 | 60.65 |
| 29 | 9:04 a.m. | 60.62 |
| 30 | 9:08 | 60.61 |
| 30 | 3:50 p.m. | 60.61 |
| Oct. 1 | 10:10 a.m. | 60.60 |
| 2 | 9:00 | 60.60 |
| 5 | 12:01 p.m. | 60.42 |
| 6 | 3:00 | 60.32 |
| 7 | 5:00 | 61.14 |
| 8 | 10:20 a.m. | 61.20 |
| 9 | 4:05 p.m. | 62.31 |
| 10 | 4:10 | 62.42 |
| 11 | 4:05 | 62.32 |
| 13 | 2:15 | 62.21 |
| 14 | 3:45 | 62.06 |
| 16 | 9:05 a.m. | 61.98 |
| 17 | 9:55 | 62.01 |
| 17 | 10:08 | b |
| 17 | 10:57 | 62.02 |
| 17 | 11:18 | 62.10 |
| 17 | 11:52 | 62.51 |
| 17 | 12:40 p.m. | 63.05 |
| 17 | 1:37 | 63.76 |
| 17 | 3:08 | 64.67 |
| 17 | 4:05 | 65.06 |
| 17 | 4:53 | 65.31 |
| 18 | 9:17 a.m. | 67.00 |
| 18 | 2:08 p.m. | 67.12 |
| J7. 160 feet east of pumped well, diameter 3 inches, depth 37.5 feet. Measuring point, top of casing, at land surface, 97.21 feet above datum. | ||
| Date, 1941 | Hour | Water level |
|---|---|---|
| Sept. 27 | 8:25 a.m. | 65.06 |
| 27 | 12:05 p.m. | 65.04 |
| 27 | 2:15 | 65.01 |
| 27 | 3:35 | 65.01 |
| 27 | 6:44 | 64.91 |
| 28 | 8:40 a.m. | 64.65 |
| 28 | 10:50 | 64.65 |
| 28 | 11:59 | 64.61 |
| 28 | 2:15 p.m. | 64.65 |
| 28 | 4:15 | 64.67 |
| 28 | 5:00 | 64.68 |
| 29 | 9:10 a.m. | 64.68 |
| 30 | 9:10 | 64.71 |
| 30 | 3:50 p.m. | 64.72 |
| Oct. 1 | 10:14 a.m. | 64.71 |
| 2 | 8:59 | 64.76 |
| 5 | 12:01 p.m. | 64.57 |
| 6 | 2:55 | 64.71 |
| 7 | 5:00 | 64.97 |
| 8 | 10:20 a.m. | 65.16 |
| 9 | 4:05 p.m. | 65.75 |
| 10 | 4:10 | 66.10 |
| 11 | 4:05 | 66.17 |
| 13 | 2:15 | 66.27 |
| 14 | 3:45 | 66.13 |
| 16 | 9:05 a.m. | 66.21 |
| 17 | 9:55 a.m. | 66.29 |
| 17 | 10:40 | b |
| 17 | 11:00 | 66.29 |
| 17 | 11:19 | 66.30 |
| 17 | 12:01 p.m. | 66.33 |
| 17 | 12:41 | 66.35 |
| 17 | 1:38 | 66.38 |
| 17 | 3:10 | 66.43 |
| 17 | 4:06 | 66.46 |
| 17 | 4:57 | 66.47 |
| 18 | 9:18 a.m. | 66.64 |
| 18 | 2:06 p.m. | 66.70 |
| 4-7-30da2. Pumped well, depth 47.7 feet, diameter 13.0 inches. Measuring point, floor of shelter, 0.4 foot above land surface, 97.22 feet.above datum. | ||
| Date, 1941 | Hour | Water level |
|---|---|---|
| Sept. 18 | 10:30 a.m. | 65.04 |
| 19 | 8:30 | 65.38 |
| 26 | 9:20 | a |
| 26 | 11:18 | 56.00 |
| 26 | 12:32 p.m. | 54.34 |
| 26 | 12:58 | 53.55 |
| 26 | 1:35 | 52.80 |
| 26 | 2:14 | 51.91 |
| 26 | 2:32 | 51.49 |
| 26 | 3:W | 51.43 |
| 26 | 3:31 | 51.42 |
| 26 | 4:M | 51.43 |
| 26 | 4:30 | 51.41 |
| Oct. 17 | 9:30 a.m. | 51.42 |
| 17 | 10:08 | b |
| 17 | 10:09 | 52.78 |
| 17 | 10:11 | 52.43 |
| 17 | 10:13 | 53.38 |
| 17 | 10:15 | 53.73 |
| 17 | 10:20 | 55.11 |
| 17 | 10:24 | 55.99 |
| 17 | 10:28 a.m. | 56.70 |
| 17 | 10:32 | 57.26 |
| 17 | 10:35 | 57.63 |
| 17 | 10:40 | 58-11 |
| 17 | 10:45 | 58-50 |
| 17 | 10:50 | 58.85 |
| 17 | 10:55 | 59-19 |
| 17 | 11:02 | 59.51 |
| 17 | 11:06 | 59.69 |
| 17 | 11:10 | 59.89 |
| 17 | 11:15 | 60.11 |
| 17 | 11:20 | 60.32 |
| 17 | 11:25 | 60.53 |
| 17 | 11:30 | 60.74 |
| 17 | 11:35 | 60.94 |
| 17 | 11:41 | 61.18 |
| 17 | 11:47 | 61.42 |
| 17 | 11:55 | 61.70 |
| 17 | 12:00 noon | 61.86 |
| 17 | 12:06 p.m. | 62.04 |
| 17 | 12:13 | 62.23 |
| 17 | 12:22 p.m. | 62.46 |
| 17 | 12:32 | 62.70 |
| 17 | 12:42 | 62.94 |
| 17 | 12:50 | 63.12 |
| 17 | 1:00 | 63.34 |
| 17 | 1:10 | 63.58 |
| 17 | 1:30 | 63.75 |
| 17 | 1:30 | 63.90 |
| 17 | 1:35 | 63.96 |
| 17 | 2:00 | 64.23 |
| 17 | 2:20 | 64.42 |
| 17 | 2:40 | 64.58 |
| 17 | 3:00 | 64.72 |
| 17 | 3:30 | 64.93 |
| 17 | 4:00 | 65.09 |
| 17 | 4:30 | 65.24 |
| 17 | 5:00 | 65.38 |
| 17 | 8:30 | 66.19 |
| 17 | 11:30 | 66.56 |
| 18 | 9:15 a.m. | 67.12 |
| 18 | 2:05 p.m. | 67.22 |
| 4-7-30da2. Cumulative discharge in gallons. | |||
| Date, 1941 | Hour | Cumulative discharge, gallons |
|
|---|---|---|---|
| Sept. 26 | 9:20 a.m. | a0 | |
| 26 | 11:18 | 356 | |
| 26 | 12:32 p.m. | 580 | |
| 26 | 12:58 | 660 | |
| 26 | 1:35 | 775 | |
| 26 | 2:14 | 890 | |
| 26 | 2:32 | 945 | |
| 26 | 2:52 | 1,000 | |
| 26 | 3:00 | 1,028 | |
| 26 | 3:31 | 1,114 | |
| 26 | 4:00 | 1,194 | |
| 26 | 4:30 | 1,278 | |
| 26 | 5:01 | 1,360 | |
| 26 | 10:50 | 2,240 | |
| 27 | 8:35 a.m. | 3,654 | |
| 27 | 10:45 | 3,953 | |
| 27 | 12:00 noon | 4,126 | |
| 27 | 2:15 p.m. | 4,434 | |
| 27 | 3:30 | 4,602 | |
| 27 | 6:40 | 5,050 | |
| 28 | 8:32 a.m. | 6,860 | |
| 28 | 10:45 | 7,130 | |
| 28 | 2:10 p.m. | 7,562 | |
| 28 | 4:10 | 7,814 | |
| 28 | 4:55 | 7,911 | |
| 29 | 9:04 a.m. | 9,945 | |
| 30 | 9:10 | 12,970 | |
| 30 | 3:50 p.m. | 13,770 | |
| Oct. 1 | 10:14 a.m. | 16,000 | |
| 2 | 9:03 | 18,765 | |
| 5 | 12:06 p.m. | 27,660 | |
| 6 | 2:57 | 30,780 | |
| 7 | 4:52 | 34,000 | |
| 8 | 10:25 a.m. | 36,342 | |
| 9 | 4:05 p.m. | 40,640 | |
| 10 | 4:10 | 44,480 | |
| 11 | 4:05 | 48,300 | |
| 13 | 2:15 | 55,490 | |
| 14 | 3:45 | 59,380 | |
| 16 | 9:05 a.m. | 65,570 | |
| 17 | 9:55 | 69,310 | |
| J8. 105 feet west and 60 feet north of well 4-7-30da1 (Jewell City well 1). Depth 40.1 feet. Measuring point, top edge of hole, 98.81 feet above datum. Water level September 18, 1941, 60.02 feet above datum. J9. 54 feet south and 50 feet west of NE cor. NE SE sec. 30, T. 4 S., R. 7 W. Depth, 34.2 feet. Measuring point, top edge of hole, 97.75 feet above datum. Water level September 18, 1941, 66.71 feet above datum. J10. 845 feet south and 105 feet east of well 4-7-30da2 (Jewell City well 2). Depth 24.2 feet. Measuring point, top edge of hole, 92.33 feet above datum. Water level September 18, 1941, 69.25 feet above datum. J11. 470 feet west and 30 feet north of J10. Depth 43.0 feet. Measuring point, top edge of hole, 94.67 feet above datum. Water level September 17, 1941, 52.81 feet above datum. 4-7-30da1. (Jewell City municipal well 1). Measuring point, 99.49 feet above datum. Water level September 18, 1941, 66.99 feet above datum. 4-7-30dd. (Jewell City municipal well 4). Measuring point, 90.45 feet above datum. Water level Sept ember 12, 1941, 55.43 feet above datum. 4-7-31aa. Measuring point, 90.23 feet above datum. Water level September 12, 1941, 55.24 feet above datum. |
| a. Pumping started at 9:20 a.m., September 26. b. Pumping stopped at 10:08 a.m., October 17. c. Flood water surrounded well 1-6-4dc. |
Figure 20--Graph showing the decrease of the yield of well 4-7-30da2 at Jewell City during an extended pumping test.
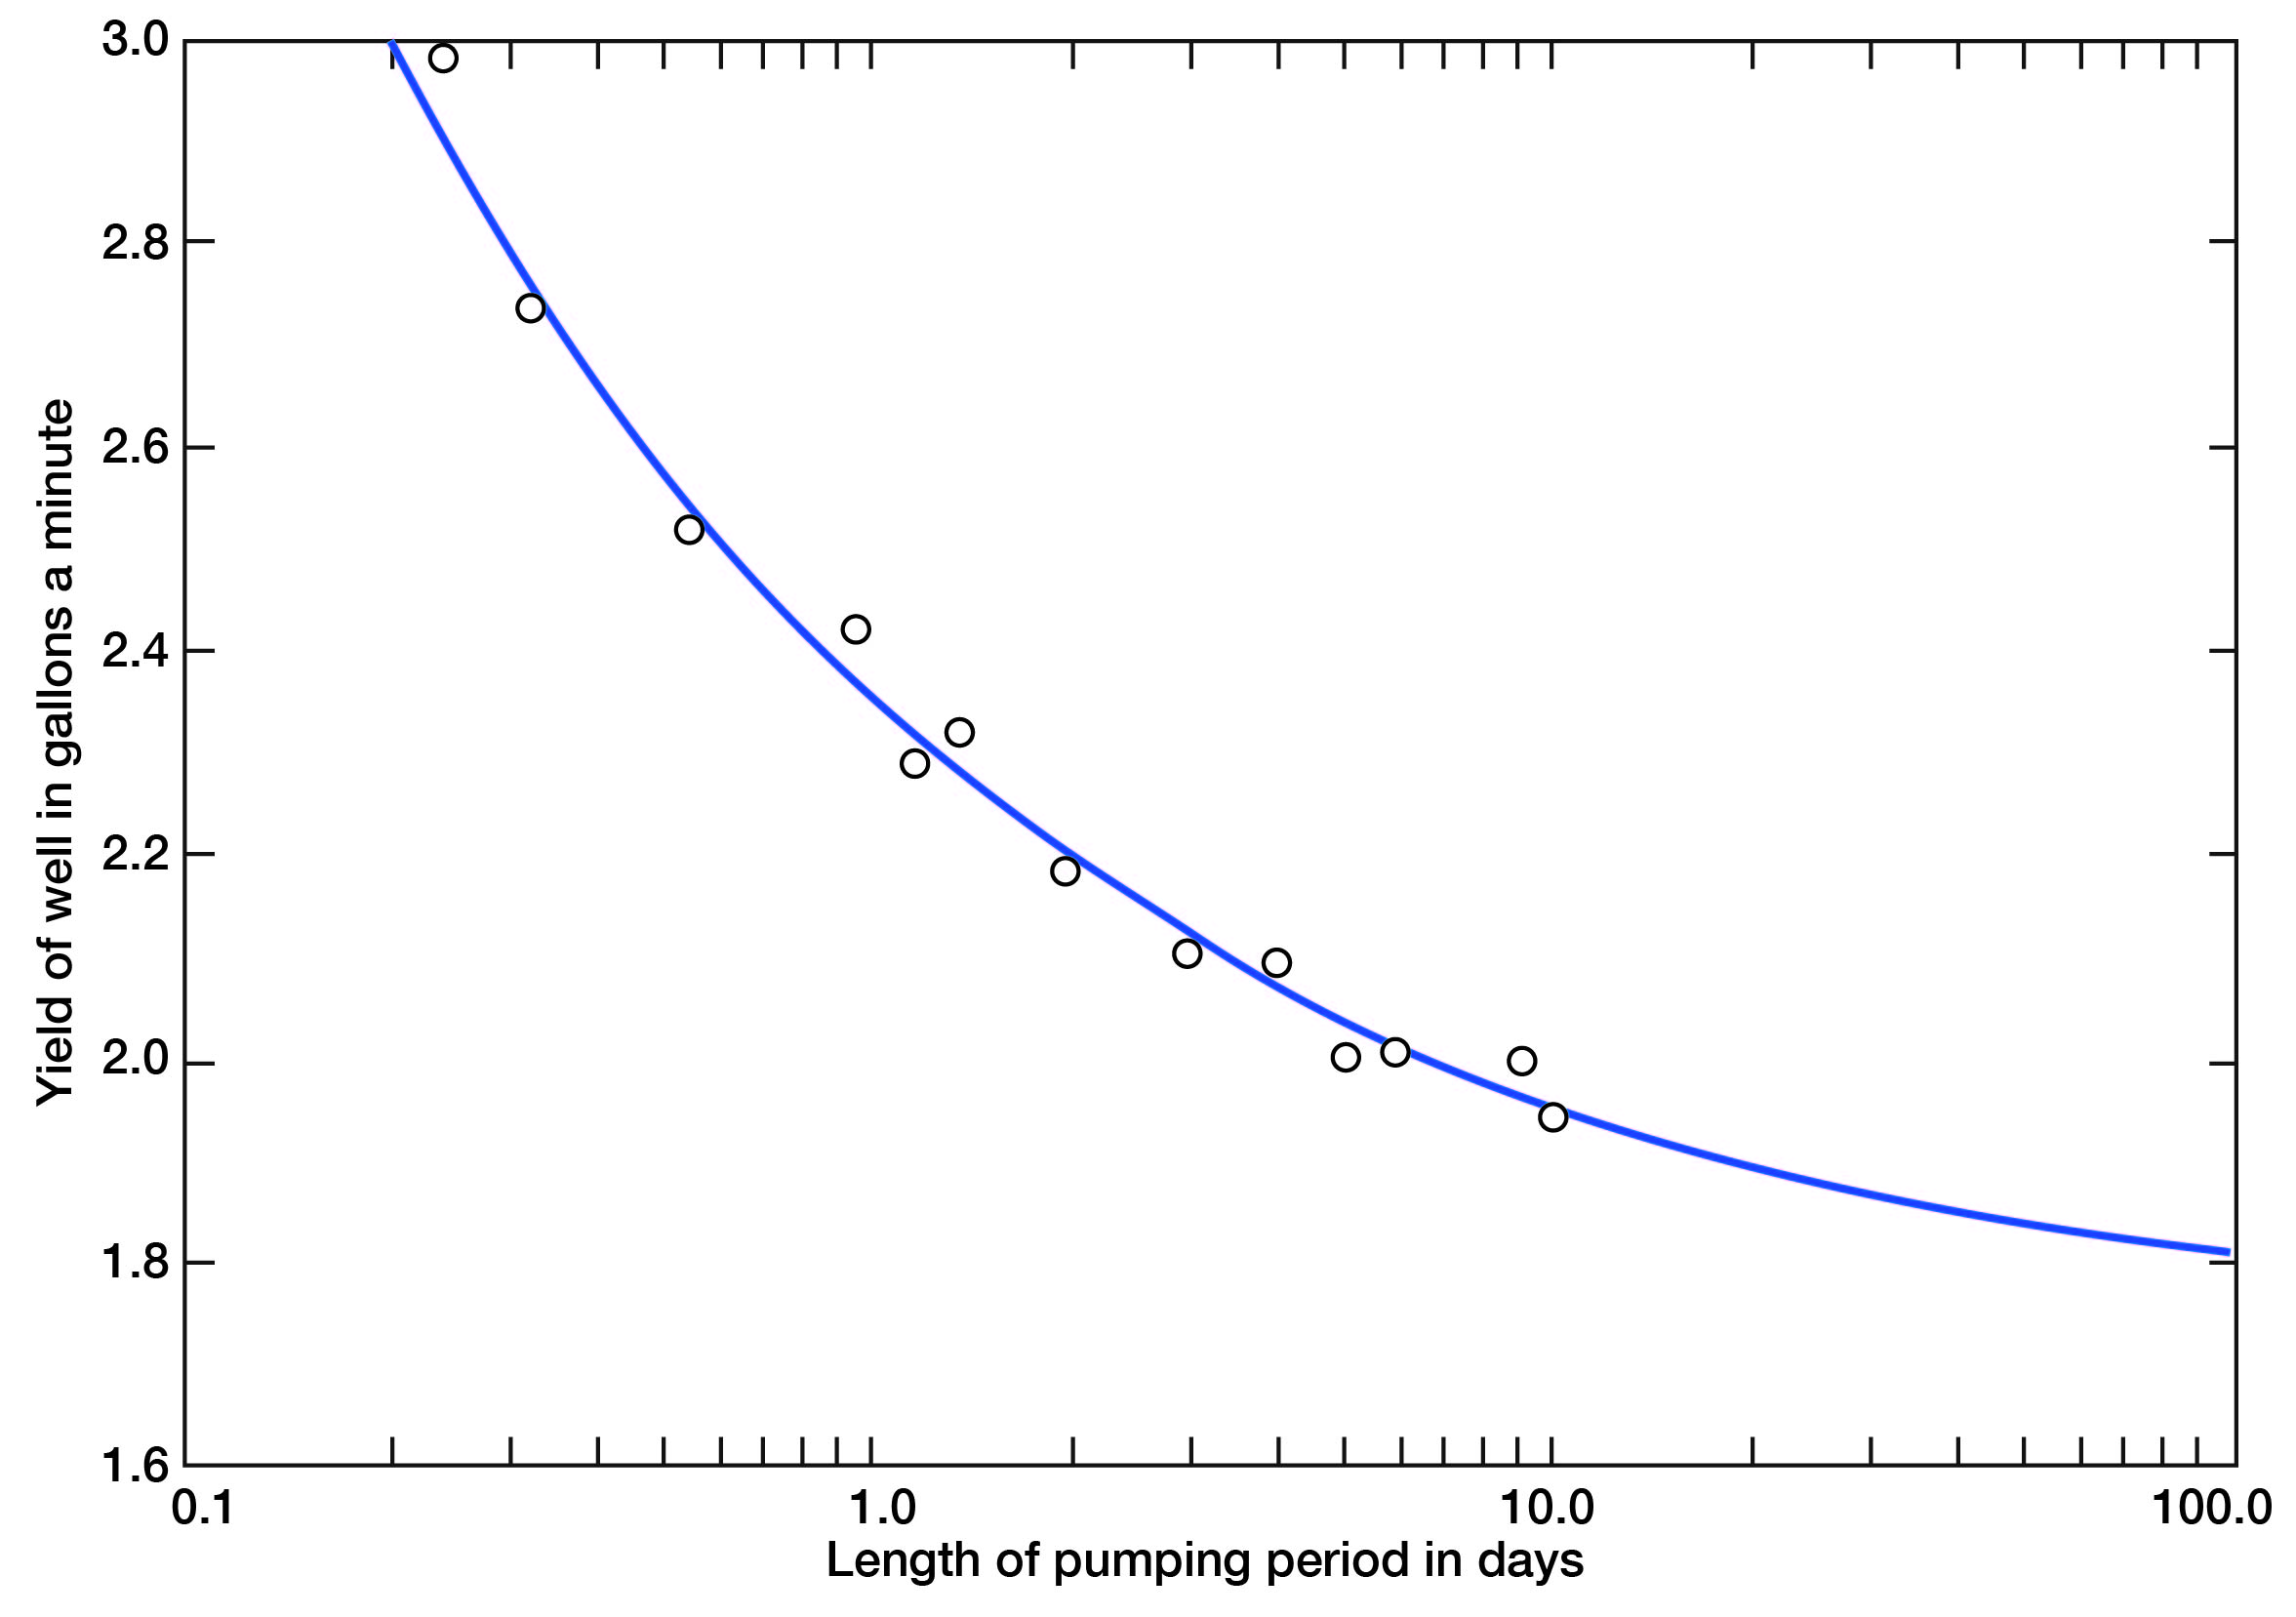
The Thiem method for determining the permeability of water-bearing materials assumes a constant pumping rate, a condition that was not fulfilled in this pumping test. The rate of pumping ranged from about 3.2 gallons a minute at the beginning of the test to about 1.9 gallons a minute on October 7 and averaged about 2.25 gallons a minute. The yield of the well was very low throughout the test and probably the coefficient of permeability computed from the pumping data is of the right order of magnitude.
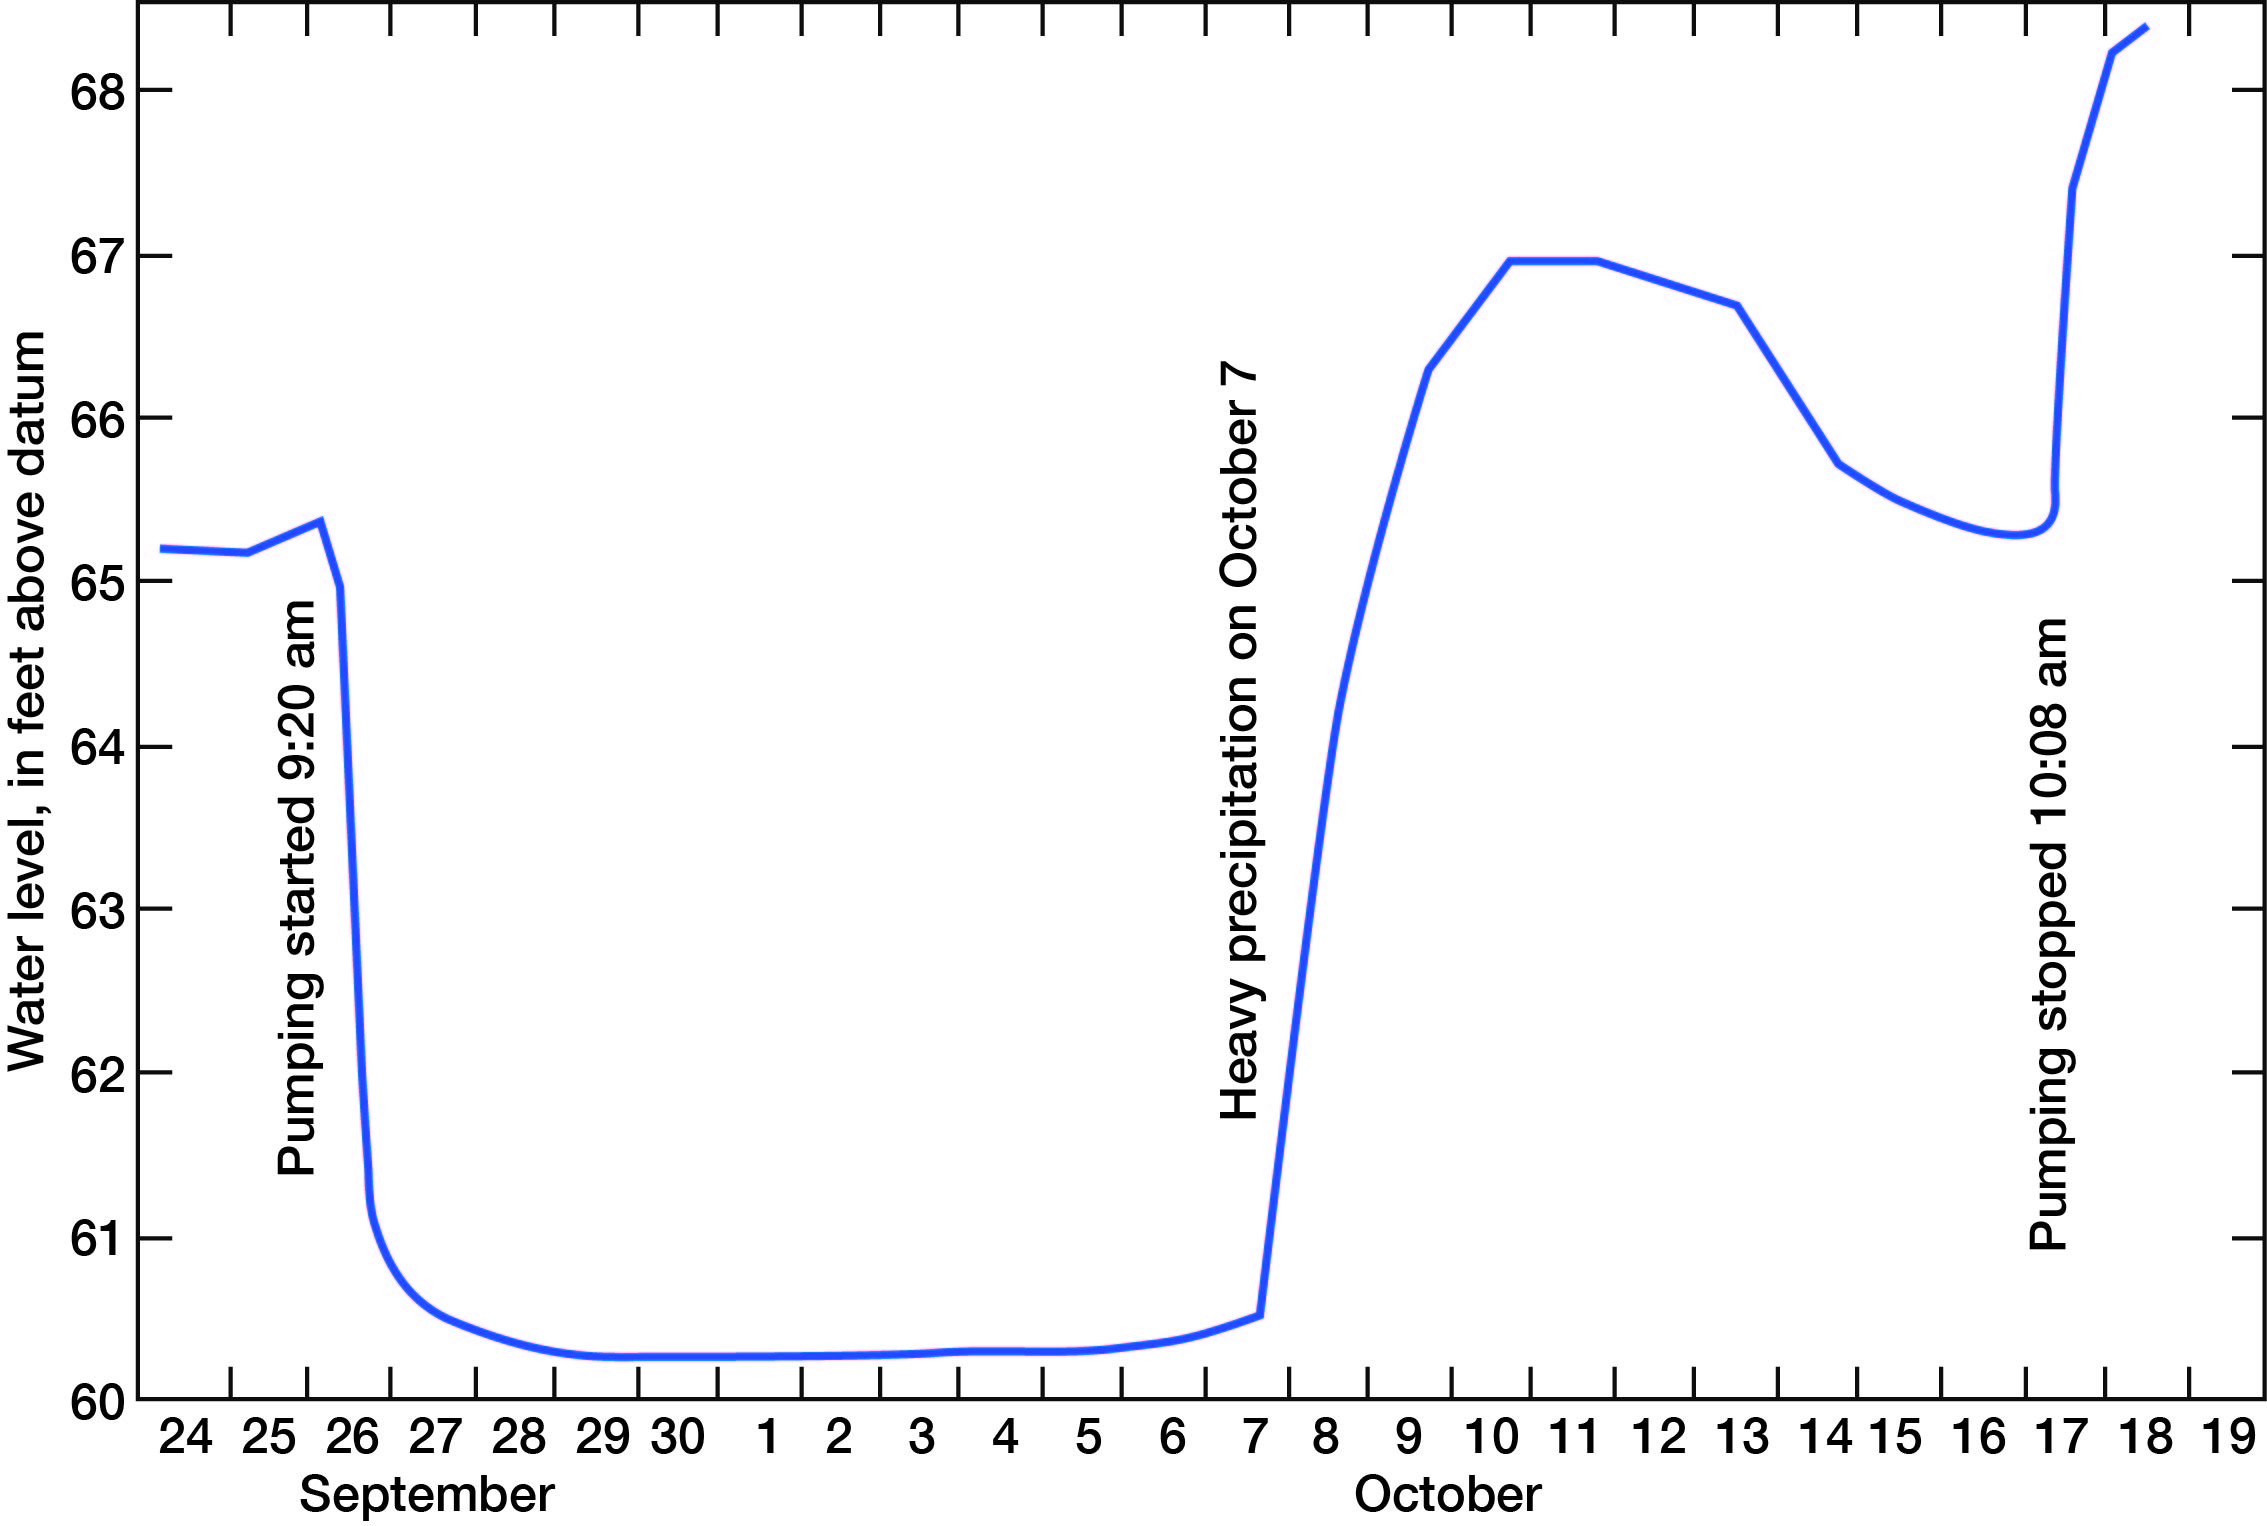
Heavy rains during October resulted in considerable groundwater recharge. The pumping test data collected subsequent to October 5 were vitiated for use in computing the permeability. The water level in the observation well 10 feet west of the pumped well was 1.97 feet higher on October 10 than at the beginning of pumping on September 26 (Fig. 21).
Figure 21--Hydrograph of observation well 10 feet west of pumped well during Jewell City pumping test.
When the data collected during the pumping test were applied to the Thiem formula, an average field coefficient of permeability of about 25 gallons a day per square foot was obtained.
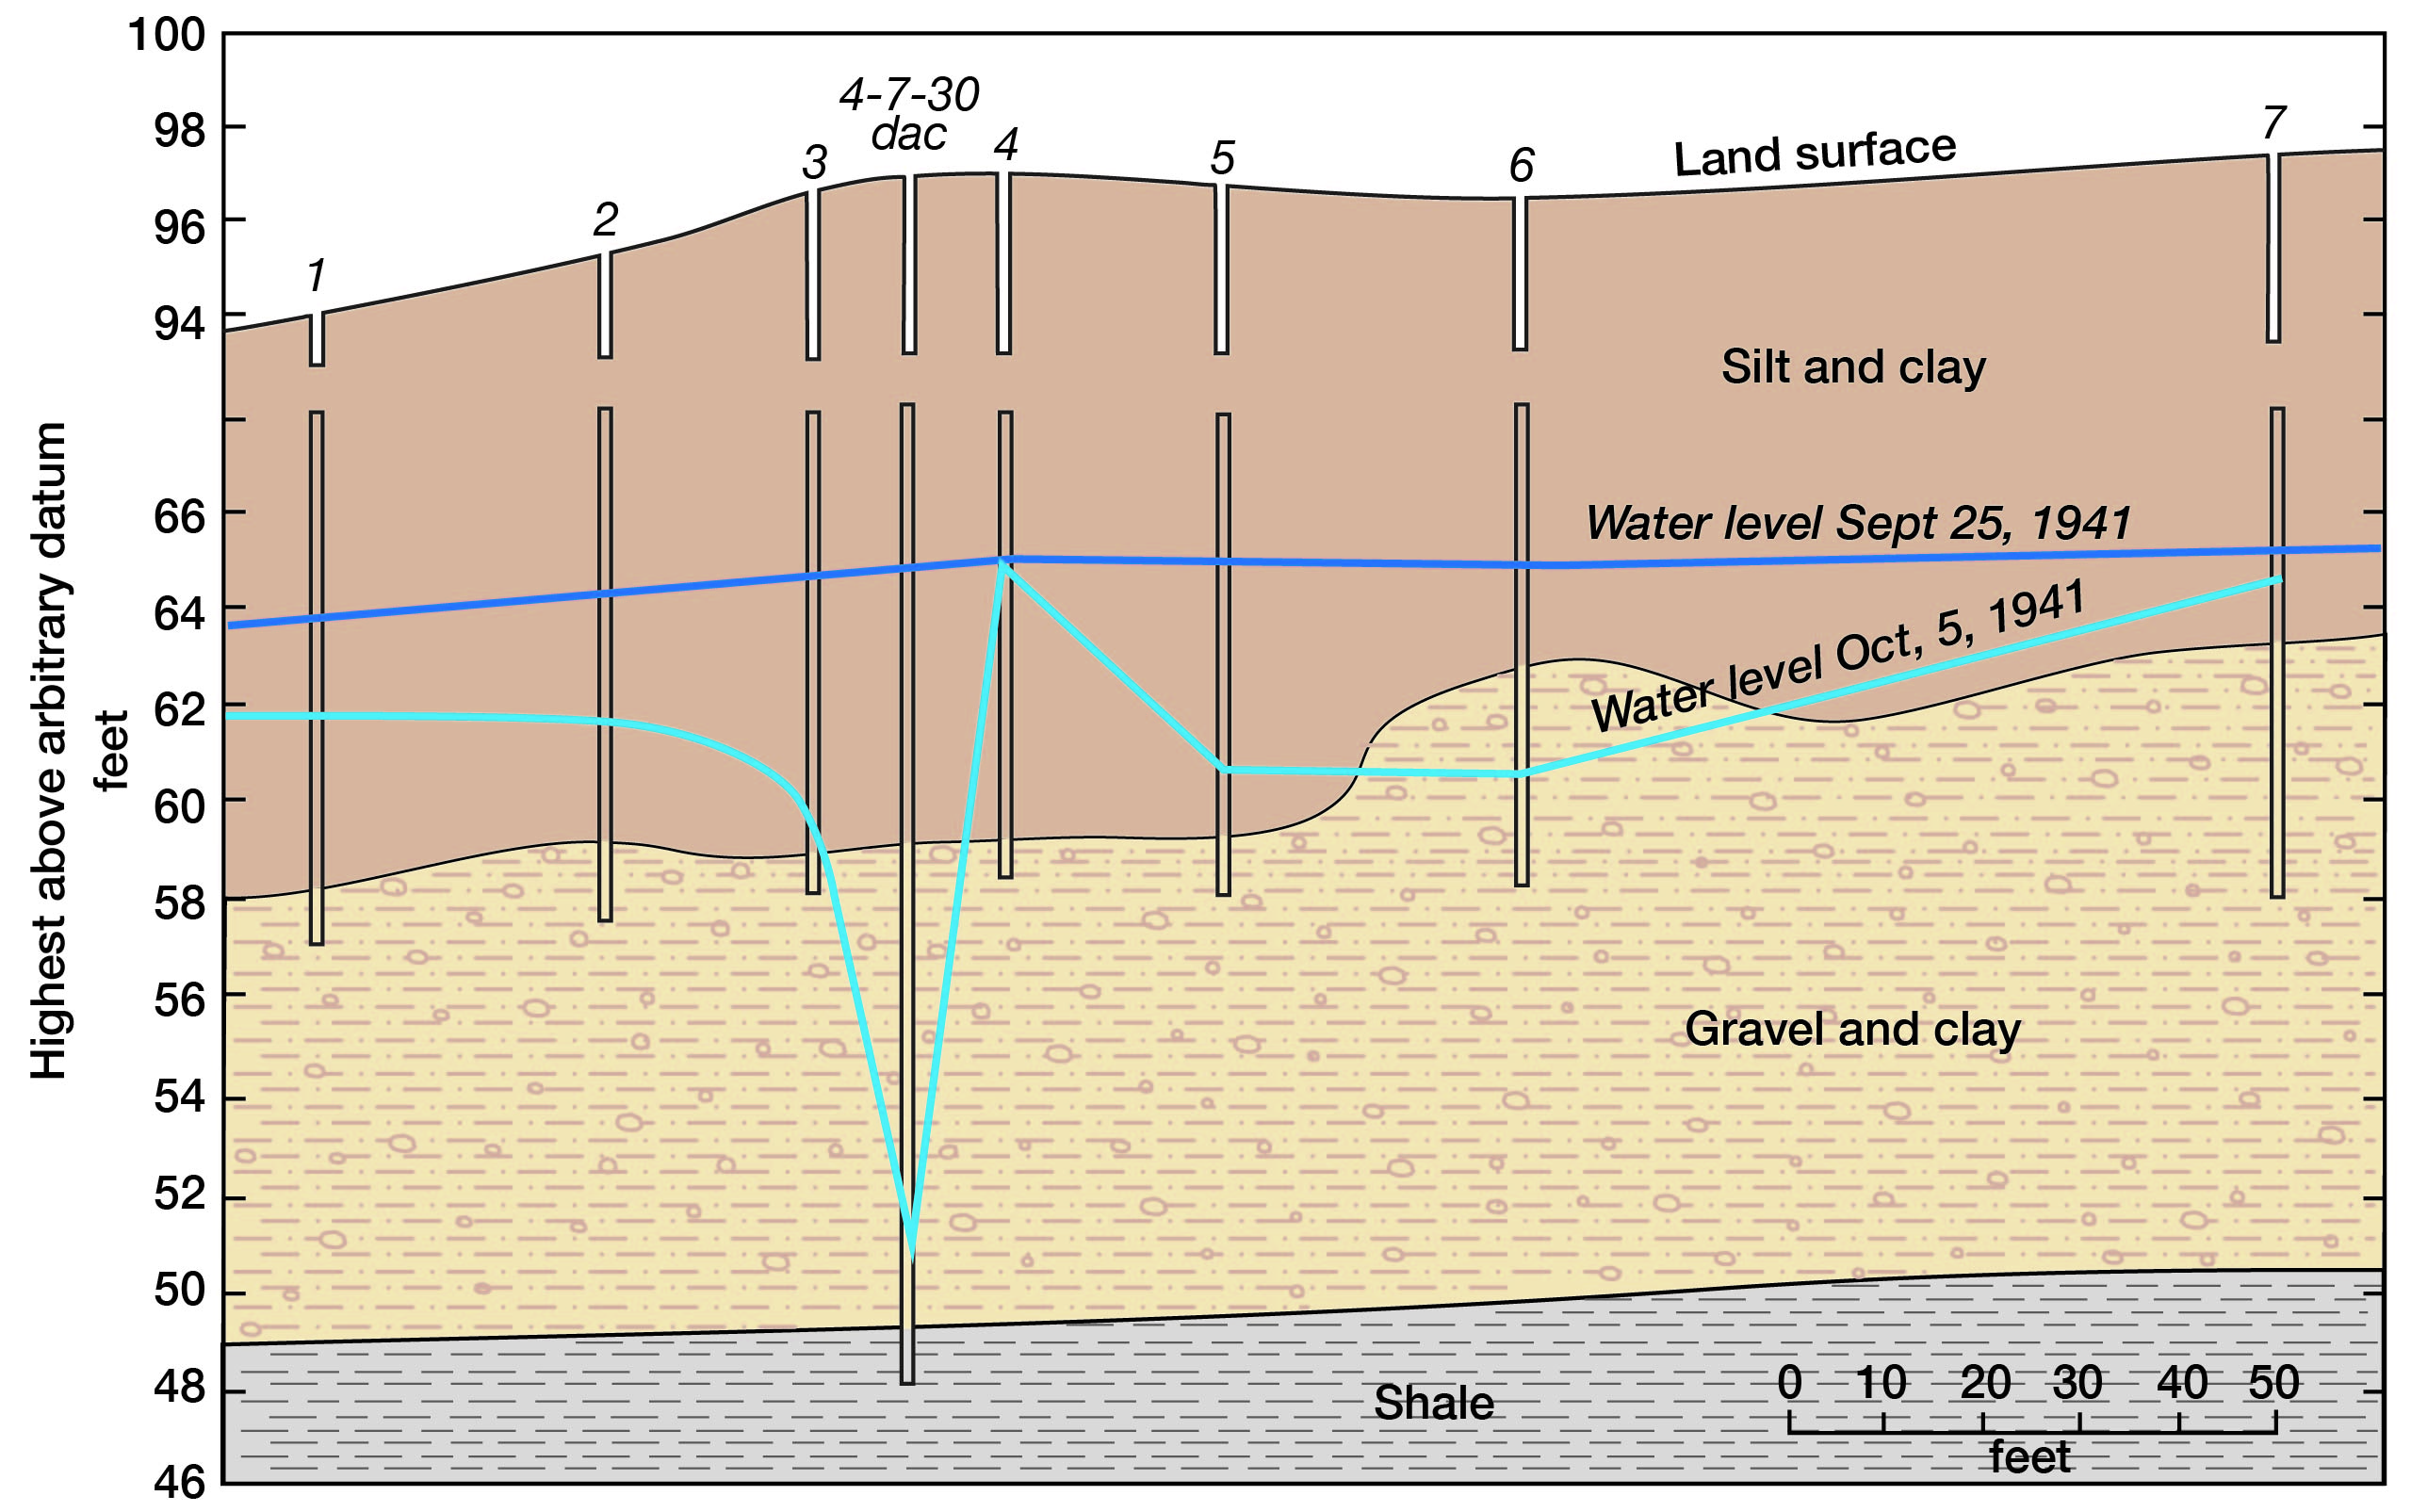
The aquifer is not homogeneous at Jewell City, as shown by the irregular fluctuations of the water levels in the observation wells. The water level in the observation well 10 feet east of the pumped well was affected only slightly by the pumping. The water level in the well 60 feet east of the pumped well declined to a lower level than the water level in the well 30 feet east of the pumped well (Fig. 22).
Jewell City has four municipal wells in the E2 of SE sec. 30, T. 4 S., R. 7 W. The locations of the wells and the water-table contours are shown in Figure 10. The ground water is moving in a southeasterly direction and has a hydraulic gradient of approximately 35 feet per mile. The quantity of water moving daily across the east boundary of the SE sec. 30 that would become available for pumping is equal to the coefficient of transmissibility (25 times a thickness of about 12 feet = 300) times the length of the cross section in miles (0.5) times the hydraulic gradient in feet per mile (35) which is equal to about 5,000 gallons daily. The water-table contours at some distance west of the wells were not appreciably affected by the pumping from the wells, indicating that only a small part of the underflow was intercepted by the wells. The total pumpage from the four wells amounted to about 20 gallons a minute or about 29,000 gallons a day, which is several times the amount of underflow. This indicates that most of the pumping is from storage within an area of a few hundred feet of each well and that the ground-water reservoir must be periodically replenished by recharge from precipitation as there was no persistent decline of water level.
Figure 22--Static water levels and water levels in observation wells after 9 days of pumping during Jewell City pumping test.
Prev Page--Ground Water Principles and Water Table || Next Page--Recovery, Utilization, Chemical character
Kansas Geological Survey, Geology
Placed on web Nov. 21, 2008; originally published Oct. 1955.
Comments to webadmin@kgs.ku.edu
The URL for this page is http://www.kgs.ku.edu/General/Geology/Jewell/05_gw2.html