![]()
Prev Page--Geology || Next Page--Ground-water Utilization, Quality
Ground Water
Principles of Occurrence
The following discussion of the occurrence of ground water is adapted largely from Meinzer (1923). Moore and others (1940) discussed the principles of ground-water occurrence with special reference to Kansas.
The rocks that form the crust of the earth are rarely, if ever, solid throughout but contain many open spaces called interstices or pores. These open spaces range in size from minute openings between particles of silt or clay through larger openings between grains or pebbles in sandstone, sand, or gravel to open channels formed by fractures and solution. The percentage of the total volume of material that consists of open spaces is termed the porosity. A formation in which the openings are interconnected and large enough to allow water to move to a well is called an aquifer. Although the amount of water that can be stored in an aquifer depends on the porosity, it is the permeability of an aquifer that determines the rate at which ground water can move. The permeability of an aquifer depends upon the number and size of its open spaces, or interstices, and the extent to which these interstices are interconnected.
All the water below the surface of the earth is called subsurface water to distinguish it from surface water and from atmospheric water. Water percolating from the surface into the rocks of the earth is drawn downward by gravity and capillarity. Some of this water will reach a zone where all the open spaces are filled with water under hydrostatic pressure. This zone is called the zone of saturation. A part of the water percolating downward will not reach the zone of saturation, but will be held by molecular attraction, or surface tension, to the walls of the open spaces through which the water passes in its descent. This zone of suspended water above the water table is termed the zone of aeration. The zone of aeration consists of three parts: the belt of soil water, the intermediate belt, and the capillary fringe. The belt of soil water, lying just below the land surface, consists of soil and loose materials from which water may be discharged into the atmosphere by plant transpiration or by direct evaporation. The open spaces of the intermediate belt below the belt of soil water are usually filled with air and water and may at times contain appreciable amounts of water in transit to the water table. The intermediate belt may be absent, however, where the water table is near the surface. The capillary fringe lies directly above the water table and contains water drawn up by capillary action from the zone of saturation and water in transit downward to this zone. In general, the thickness of the capillary fringe varies inversely with the size of the interstices. In clean gravel, the capillary fringe almost disappears; in silt or clay, the fringe may be several feet thick. Figure 7 shows, in general, the divisions of subsurface water.
Figure 7--Diagram showing generalized divisions of subsurface water. (After Meinzer, 1923a, fig. 2)
Under water-table conditions, the term water table designates the surface between that part of the zone of saturation where water is free to move by gravity and the zone of aeration. Where a water-bearing formation is confined between relatively impermeable beds and water is supplied to it from an adjacent area of higher altitude, the water table is absent and the water is said to be confined or under artesian pressure. Under artesian conditions, water enters the water-bearing formation at the intake area, percolates downdip, and exerts pressure on the confining layers. Under these conditions, water is confined under hydraulic pressure similar to water in a pipe connected to a reservoir at a higher altitude. When an aquifer under artesian pressure is penetrated by a well, water will rise in the well to a height equal to the hydraulic head. The imaginary surface connecting this level in wells is called the piezometric surface. For an artesian well to flow the piezometric surface must be at a higher altitude than the land surface.
Ground water in Gove County occurs under both water-table and artesian conditions. Water-table conditions are present in shallow aquifers such as alluvial deposits in the valleys. Most of the ground water in the Ogallala Formation is under water-table conditions although some is confined under silt and clay beds at least locally. Ground water in the Dakota Formation in Gove County is under artesian pressure.
The Water Table and Movement of Ground Water
The water table has been defined as the upper surface of that part of the zone of saturation where water is free to move by gravity. The water table is not a static, level surface, but is generally a sloping surface having many irregularities in the form of mounds, depressions, and ridges caused by differences in permeability of the water-bearing material and by unequal additions or withdrawals of ground water. Where recharge to an aquifer is exceptionally great because of very permeable overlying material, the water table may build up a low mound from which water slowly spreads out. Depressions in the water table are formed where ground water is discharging, generally where water is withdrawn by wells or along streams that are below the level of the water table. Streams that gain water from the flow of ground water are said to be gaining or effluent streams. Conversely, streams that are above the water table and contribute water to the ground-water reservoir are said to be losing or influent streams (Fig. 8).
Figure 8--Diagrammatic sections showing influent and effluent streams. Longitudinal section showing (right) how an effluent stream gains water and (left) how and influent stream loses water. Transverse section across influent part of a stream (lower left). Transverse section across effluent part of a stream (lower right). (After Meinzer, 1923a, fig. 26.)
In central and west-central Gove County, a considerable amount of ground water moves from the Ogallala Formation into Hackberry Creek and its tributaries. In extreme north-central and northeastern Gove County, ground water moves from the Ogallala Formation toward Saline River. Some ground water moves from the Ogallala into the alluvium of Big Creek and then discharges from the alluvium into Big Creek as effluent seepage. In the Smoky Hill valley, the water table in the alluvium is separated from the water table in the Ogallala Formation by the relatively impervious Cretaceous bedrock. Although the Smoky Hill alluvial valley is small in areal extent, some ground water discharges into the river from the alluvium. During extended periods of below-normal precipitation, however, the amount of such discharge is negligible.
The configuration of the water table in the northern part of Gove County is shown on Plate 2 by means of water-table contours. The direction of ground-water movement is at right angles to the contours and in a down-slope direction. This movement is very slow because of frictional resistance of the small interstices through which the water must pass. The slope of the water table varies inversely with the permeability of the aquifer. In areas where the water-bearing beds are less permeable, the slope of the water table steepens and the water-table contours are closely spaced; in areas of greater permeability, the slope of the water table flattens and the water-table contours are spaced farther apart. The water-table contours across Gove County indicate an average gradient of about 11 feet per mile.
Fluctuations of Water Table
The water table does not remain stationary but fluctuates up and down in response to recharge and discharge of ground water. A rise of the water level indicates that recharge exceeds discharge; a decline indicates that discharge exceeds recharge. Thus, changes in water level indicate to what extent the ground-water reservoir is being replenished or depleted.
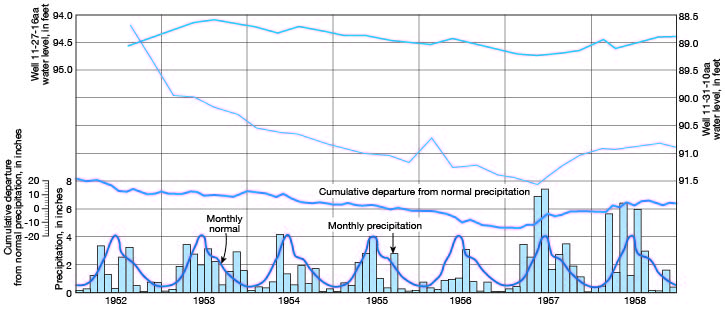
Hydrographs showing the fluctuations of the water level in two observation wells and graphs showing precipitation data are given in Figure 9. The graphs show the normal monthly precipitation in the area of the wells, the monthly precipitation, and the cumulative departure from normal monthly precipitation. The hydrographs indicate that precipitation and fluctuations of the water levels correlate in a general way. Records of these water levels are published by the U. S. Geological Survey (1935-56) and by the State Geological Survey of Kansas.
Figure 9--Hydrographs showing fluctuations of water levels in two wells in Ogallala Formation, and graphs showing monthly precipitation, normal precipitation, and cumulative departure from normal precipitation in Gove County. A larger version of this figure is available.
Ground-water Recharge
Ground water in Gove County, as in other parts of the Great Plains, is derived almost entirely from local precipitation in the form of rain or snow. One inch of water falling on 1 square mile amounts to more than 17 million gallons. Thus, the normal annual precipitation of 20.89 inches amounts to approximately 360 million gallons per square mile. Only a small part of the annual precipitation, however, reaches the ground-water reservoir. Part of the water that falls as precipitation is carried away as surface runoff by streams; part is evaporated into the atmosphere; part is absorbed by vegetation and later transpired to the atmosphere. Water that is not discharged by these processes percolates downward to the zone of saturation. After the water reaches the water table, it moves slowly toward points of discharge such as wells, springs, effluent streams, or points of evaporation and transpiration.
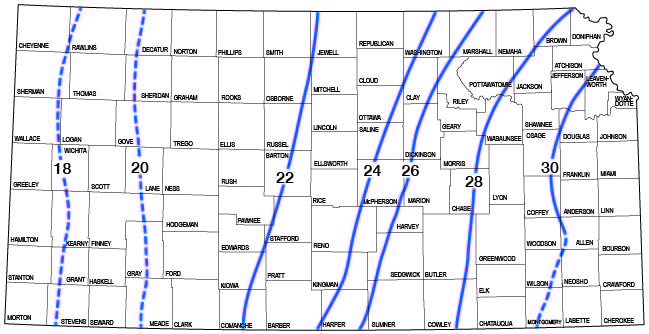
About 77 percent of the normal annual precipitation in Gove County falls during the months of April through September when the climate is characterized by strong wind movement, high temperatures, and relatively low humidity. Consequently, evaporation is rapid, and much of the annual precipitation returns to the atmosphere. Because much of the rain falls during the growing season, a large part of the annual precipitation is returned to the atmosphere through transpiration by plants. In Gove County, the amount of annual precipitation that is discharged through evaporation and transpiration is estimated to be about 20 inches (Fig. 10), but the normal annual precipitation of Gove County is only 20.89 inches, and hence the amount of runoff, including both surface and ground-water runoff, is less than 1 inch per year and probably is not more than 0.3 inch per year.
Figure 10--Map of Kansas showing lines of mean annual water loss, in inches (precipitation minus runoff) adapted from Williams and others (1940, pl. 2).
Ground-water Discharge
Ground-water discharge is the release of water from the zone of saturation. In Gove County, ground-water is discharged by evaporation and transpiration, by springs and seepage into streams, by discharge from wells, and by subsurface movement to adjacent areas.
Evaporation and Transpiration
Evaporation to the atmosphere from the zone of saturation is limited to areas where the water table is near the land surface, such as along beds and banks of the larger streams. As these conditions are restricted to a small part of Gove County, discharge by evaporation is not large. After floods or after long periods of exceptionally heavy rainfall, when the water table is nearer the surface in many areas, appreciable amounts of ground water may be evaporated from lowland areas into the atmosphere.
Water may be taken into the roots of plants directly from the capillary fringe or from the zone of saturation, as well as from the soil zone, and discharged from the plants by evaporation from the leaves (transpiration). The depth to which plant roots will grow varies with different plant species and with the type of material the roots penetrate. Common field crops and grasses do not draw water from depths of more than a few feet, but certain plants called phreatophytes are capable of sending their roots deep in search of water. Alfalfa roots may reach the water table where it is as much as 30 feet below the surface, and certain desert plants send their roots to depths of 50 or 60 feet. In Gove County, phreatophytes capable of obtaining ground water at considerable depths include alfalfa, cottonwood and hackberry trees, yucca, and certain weeds.
The measurements of water level in observation wells show that the water level in the Ogallala Formation of Gove County has not fluctuated significantly in recent years, that is, ground-water discharge has been in approximate equilibrium with recharge to the ground-water reservoir. Although discharge of ground water by transpiration is not significant in the upland of the northern part of the county where the water table is fairly deep, it is of importance in stream valleys and in much of the southern part of the county where the water table is shallow.
Springs
Small springs are common in Gove County, especially in draws, and characteristically emerge at or near the contact between the Ogallala Formation or unconsolidated Pleistocene deposits and the underlying relatively impermeable Cretaceous bedrock. The outcropping contact of the Ogallala Formation on Cretaceous bedrock represents a hydrologic boundary of the upland along which ground water is discharged in springs. Seepage at the base of the Ogallala Formation along Hackberry Creek and its tributaries provides considerable recharge to the alluvial fill of these valleys and to the colluvial fill in the upland draws in the central and west-central parts of the county. Seepage also occurs along Big Creek in the eastern part of the county. Springs are common along the Smoky Hill valley near the contact between the high terrace sand and gravel deposits and the underlying Cretaceous bedrock; several of these springs provide water for domestic and livestock supplies.
Ground-Water Pumpage
Most rural residents obtain water for domestic and livestock supplies from small-diameter drilled wells equipped with cylinder pumps powered by windmills. The yields of these wells are small and probably average about one gallon a minute. Because of their great number and long pumping periods, however, such wells represent an important withdrawal from the ground-water reservoir, estimated to be about 800 acre-feet per year in Gove County. Municipal wells at Quinter, Grainfield, Grinnell, and Gove yield a total of approximately 500 acre-feet per year. Irrigation wells in the valleys of Smoky Hill River, Big Creek, and Hackberry Creek and in the upland of Gove County add an estimated 6,000 acre-feet per year. The irrigation season generally lasts about 60 days but may vary according to rainfall distribution.
Subsurface Movement
Water-table contours (Pl. 2) show that ground water in the Ogallala Formation in the northern part of the county moves eastward. Thus, some ground water within the Ogallala in Logan County moves into Gove County from the west; likewise, some ground water leaves Gove County toward the east. The amount leaving the county underground is believed to be less than that entering, much of the difference being accounted for by seepage and springs along the edge of the upland plain and by discharge from the Ogallala along Hackberry Creek valley and its tributaries.
A small amount of ground water moves out of Gove County through the alluvial fill of Smoky Hill River, Hackberry Creek, and Big Creek valleys, but because of the small cross-sectional area of the alluvial fill of the valleys, the amount of ground water that leaves the county through these aquifers is relatively small. Much of the streamflow derived from ground water in the valleys is dissipated by evaporation and transpiration, hence very little ground water is discharged as stream flow into Trego County.
The approximate rate of movement of ground water through the Ogallala Formation can be obtained by application of the following formula:
v = PI / 395p
where v is the average velocity of the ground water, in feet per day; P is the coefficient of permeability, defined in Meinzer's units (gallons per day per square foot under a hydraulic gradient of 1 foot per foot and a temperature of 60° F); I is the hydraulic gradient, in feet per mile; and p is the porosity, as a percentage. On the basis of an average coefficient of permeability of the water-bearing material of 325 gallons a day per square foot, a hydraulic gradient of 11 feet per mile, and porosity of 30 percent (assumed on the basis of data on similar sediments elsewhere in Kansas), the average velocity of the ground water can be computed by the above formula as follows:
v = (325 X 11) / (395 X 30) = 0.3 foot per day.
Recovery of Ground Water
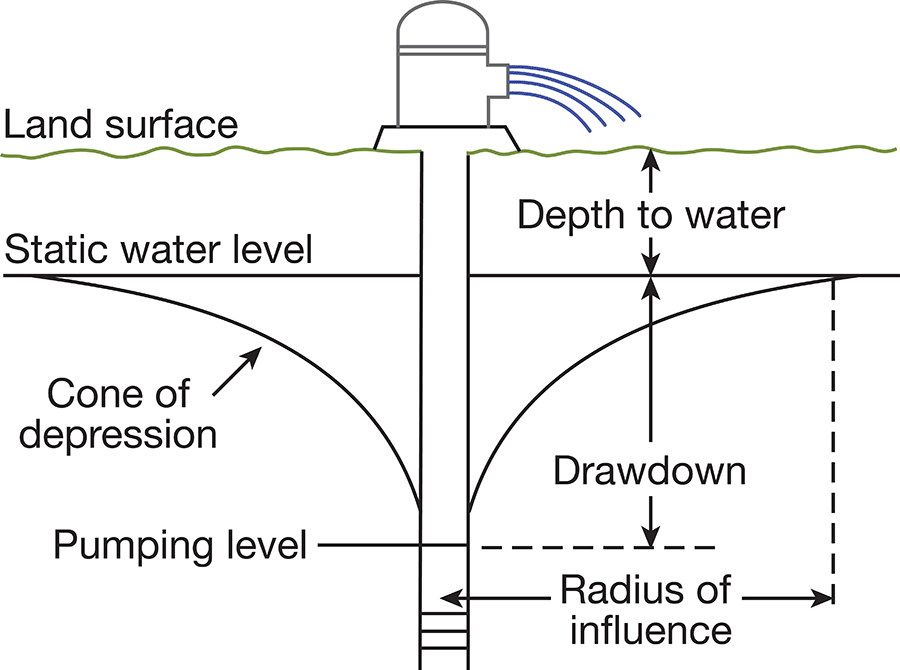
When a water-table well is not pumped, the head of water inside the well is in equilibrium with that of water outside the well. When pumping is started, water is discharged from the well, and a difference in head is established between the water inside the well and water in the surrounding aquifer. As a result of this differential head, water moves from the aquifer toward the well, and a depression in the form of an inverted cone forms in the water table (Fig. 11). The lateral extent of this cone of depression is called the area of influence, and the vertical distance that the water level is lowered is called the drawdown. When pumping stops, the cone of depression gradually fills with water from the surrounding area until equilibrium is again reached between the water level in the well and the surrounding aquifer. An increased pumping rate in a well produces a greater drawdown; water moves toward the well under a steeper gradient and at a greater rate. When large quantities of water are withdrawn from a well, the water level drops rapidly at first but gradually drops more slowly until it becomes almost stationary. When pumping stops, the water level rises rapidly at first, gradually rising more slowly until it finally reaches approximately its original position. A recovery curve of irrigation well 11-30-27dc1 is shown in Figure 12.
Figure 11--Diagrammatic section of a well that is being pumped, showing its drawdown, cone of depression, and radius of influence.
The character, thickness, and extent of the water-bearing material as well as the construction and condition of the well determine the yield and resultant drawdown of a well. If the water-bearing material is coarse, well rounded, and uniform in size, it will readily yield large quantities of water at relatively slight drawdown. If the water-bearing material is fine or poorly sorted, offering more resistance to the flow of water toward the well, it will decrease the yield and increase the drawdown.
Hydrologic Properties of Water-bearing Materials
Porosity and specific yield--The amount of water that can be stored in an aquifer depends upon the porosity of the aquifer. Porosity is expressed quantitatively as the percentage of the total volume of material that consists of open spaces. An aquifer is said to be saturated when all its open spaces are filled with water.
Not all the water will drain from an aquifer when the water table is lowered, some being held by molecular attraction. The volume that drains from a unit volume of the aquifer is called the specific yield, and the volume that is retained in a unit volume is called the specific retention. The specific yield of a water-bearing formation is defined by Meinzer (1923a, p. 28) as the ratio of the volume of water that a saturated sample of the formation will yield by gravity, divided by the volume of the sample. The specific yield of an unconfined aquifer is practically identical to the coefficient of storage, which is a measure of the quantity of water that the aquifer will yield when it is drained by a lowering of the water table. The specific yield is usually stated as a percentage.
Permeability and transmissibility--The coefficient of permeability of an aquifer is defined as the rate of flow of water, in gallons per day, through a square foot of its cross section, under a hydraulic gradient of 1 foot per foot, at a temperature of 60° F. The field coefficient of permeability is the same, except that it is measured at the prevailing temperature rather than at 60° F. The coefficient of permeability can be conveniently expressed for field use as the flow in gallons per day, across a section 1 mile wide and 1 foot thick under a hydraulic gradient of 1 foot per mile, rather than a section 1 foot wide under a gradient of 1 foot per foot.
The coefficient of transmissibility may be expressed as the rate of flow of water, in gallons per day, through a vertical strip of the aquifer 1 foot wide, under a hydraulic gradient of 1 foot per foot, at the prevailing temperature. The coefficient of transmissibility is equal to the field coefficient of permeability multiplied by the saturated thickness of the aquifer, in feet.
Aquifer tests--The permeability and transmissibility of the Ogallala Formation in Gove County were calculated, from aquifer tests, by the recovery method developed by Theis (1935, p. 522) and described also by Wenzel (1942, p. 94). According to the recovery formula:
T = (264Q log10 t/t') / s'
in which T is the coefficient of transmissibility, in gallons per day per foot,
Q is the pumping rate, in gallons per minute,
t is the time since pumping began, in minutes,
t' is the time since pumping stopped, in minutes, and,
s' is the residual drawdown at the pumped well at time t', in feet.
The residual drawdown (s') at any time after pumping ceases (t') is computed by subtracting the static water-level measurement before pumping began from the water-level measurement made at time t'. The ratio of log10 t/t' to s' may be determined graphically by plotting log10 t/t' against corresponding values of s'. This procedure is simplified by plotting t/t' on the logarithmic coordinate and s' on the arithmetic coordinate of semilogarithmic paper (Fig. 12). If log10 t/t' is taken over one log cycle, it will become unity and s' will be the difference in drawdown over one log cycle. The above formula then reduces to:
T = 264Q / Δs'
in which Δs' is the change in residual drawdown for one log cycle.
An aquifer test using irrigation well 11-30-27dc1, owned by Page Campbell, was made on October 11, 1956. The well was pumped 5 hours at a rate of approximately 400 gallons per minute and the depth to water was measured frequently. Depth-to-water measurements were made during the recovery period for 4 1/2 hours after pumping ceased. Measurements were made with an electric water-level gage, which was checked periodically with a chalked steel tape. The data used in the calculation of the coefficients of transmissibility and permeability are given in Table 3. The time-versus-drawdown curve is shown in Figure 12.
Figure 12--Curve obtained by plotting s' against t/t' for aquifer test using well 11-30-27dc1.
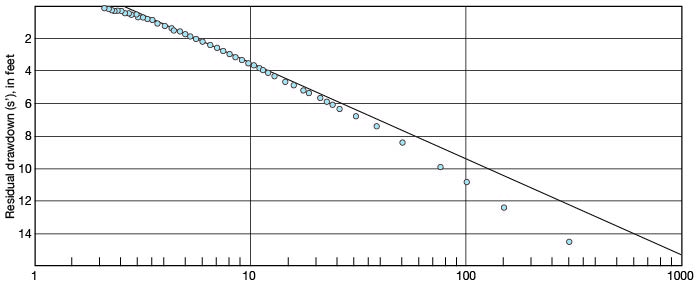
Table 3--Data on aquifer test using well 11-30-27dc1 in Gove County, October 11, 1956. Average yield during pumping was 400 gpm measured by Hoff flow gage. Water-level measurements were made by electric water-level gage.
| Time since pumping started, minutes (t) |
Time since pumping stopped, minutes (t) |
t/t' | Depth to water level (feet) |
Drawdown below static water level (feet) |
|---|---|---|---|---|
| 0 | Pumping started | 100. 60 | static water level | |
| 5 | 124 | 23.40 | ||
| 10 | 126 | 25.40 | ||
| 15 | 128 | 27.40 | ||
| 60 | 132 | 31.40 | ||
| 120 | 134.10 | 33.50 | ||
| 180 | 134.28 | 33.68 | ||
| 240 | 134.40 | 33.80 | ||
| 300 | 0 | Pumping stopped | 134.45 | 33.85 |
| 301 | 1 | 301 | 115.1 | 14.50 |
| 302 | 2 | 151 | 113 | 12.40 |
| 303 | 3 | 101 | 111.4 | 10.80 |
| 304 | 4 | 76 | 110.49 | 9.89 |
| 306 | 6 | 51 | 109.00 | 8.40 |
| 308 | 8 | 38.5 | 108.00 | 7.40 |
| 310 | 10 | 31 | 107.35 | 6.75 |
| 312 | 12 | 26 | 106.90 | 6.30 |
| 313 | 13 | 24 | 106.66 | 6.06 |
| 314 | 14 | 22.4 | 106.45 | 5.85 |
| 315 | 15 | 21 | 106.25 | 5.65 |
| 317 | 17 | 18.7 | 105.92 | 5.32 |
| 318 | 18 | 17.7 | 105.74 | 5.14 |
| 320 | 20 | 16 | 105.42 | 4.82 |
| 322 | 22 | 14.6 | 105.22 | 4.62 |
| 325 | 25 | 13 | 104.88 | 4.28 |
| 327 | 27 | 12.1 | 104.68 | 4.08 |
| 329 | 29 | 11.3 | 104.50 | 3.90 |
| 330 | 30 | 11 | 104.41 | 3.81 |
| 332 | 32 | 10.4 | 104.24 | 3.64 |
| 334 | 34 | 9.8 | 104.10 | 3.50 |
| 337 | 37 | 9.1 | 103.88 | 3.28 |
| 340 | 40 | 8.5 | 103.71 | 3~ll |
| 343 | 43 | 8.0 | 103.53 | 2.93 |
| 346 | 46 | 7.5 | 103.37 | 2.77 |
| 350 | 50 | 7.0 | 103.19 | 2.59 |
| 355 | 55 | 6.5 | 102.97 | 2.37 |
| 360 | 60 | 6.0 | 102.78 | 2.18 |
| 365 | 65 | 5.6 | 102.61 | 2.01 |
| 370 | 70 | 5.3 | 102.46 | 1.86 |
| 375 | 75 | 5.0 | 102.32 | 1.72 |
| 381 | 81 | 4.7 | 102.18 | 1.58 |
| 385 | 85 | 4.4 | 102.10 | 1.50 |
| 390 | 90 | 4.3 | 101.98 | 1.38 |
| 400 | 100 | 4.0 | 101.80 | 1.20 |
| 410 | 110 | 3.7 | 101.65 | 1.05 |
| 420 | 120 | 3.5 | 101.53 | .93 |
| 430 | 130 | 3.3 | 101.40 | .80 |
| 440 | 140 | 3.14 | 101.31 | .71 |
| 450 | 150 | 3.0 | 101.23 | .63 |
| 460 | 160 | 2.87 | 101.16 | .56 |
| 470 | 170 | 2.76 | 101.10 | .50 |
| 480 | 180 | 2.7 | 101.05 | .45 |
| 490 | 190 | 2.6 | 101.00 | .40 |
| 500 | 200 | 2.5 | 100.95 | .35 |
| 510 | 210 | 2.43 | 100.91 | .31 |
| 525 | 225 | 2.33 | 100.87 | .27 |
| 540 | 240 | 2.25 | 100.83 | .23 |
| 555 | 255 | 2.19 | 100.79 | .19 |
| 570 | 270 | 2.11 | 100.76 | .16 |
The computations are as follows:
T = [(264) (400)] / 6 = 18,000 gpd/ft
P = 18,000 / 55.4 = 325 gpd/ft2
The coefficient of transmissibility is computed to be about 18,000 gallons per day per foot. The coefficient of permeability, which is obtained by dividing the coefficient of transmissibility by the thickness of the saturated material, 55.4 feet, is about 325 gallons per day per square foot. The specific capacity of this well is obtained by dividing the discharge in gallons per minute by the drawdown. After 5 hours of pumping at a rate of 400 gpm the well had a drawdown of about 34 feet, giving a specific capacity of about 12 gallons per minute per foot of drawdown.
Recovery measurements also were obtained on irrigation wells 11-30-25cc and 12-26-11bb1. Because the coefficients of transmissibility computed from these data were inconclusive and seemingly could be in error by as much as 50 percent, they have been omitted from this report, but the data are given to show that the local transmissibility of the water-bearing materials is moderately high (Tables 4 and 5).
Table 4--Data on aquifer test using well 11-30-25cc in Gove County, October 3, 1956. Average yield during pumping was 420 gpm measured by Hoff flow gage. Water-level measurements were made by electric water-level gage.
| Time since pumping started, minutes (t) |
Time since pumping stopped, minutes (t) |
t/t' | Depth to water level (feet) |
Drawdown below static water level (feet) |
|---|---|---|---|---|
| 0 | Pumping started | 104.02 | static water level | |
| 390 | Pumping stopped | |||
| 391 1/2 | 1 1/2 | 261.0 | 143.98 | 39.96 |
| 394 1/2 | 4 1/2 | 87.7 | 109.00 | 4.98 |
| 395 1/2 | 5 1/2 | 71.9 | 107.95 | 3.93 |
| 398 | 8 | 49.8 | 106.93 | 2.91 |
| 400 | 10 | 40.0 | 106.50 | 2.48 |
| 402 | 12 | 33.5 | 106.15 | 2.13 |
| 404 | 14 | 28.9 | 105.93 | 1.91 |
| 410 | 20 | 20.5 | 105.43 | 1.41 |
| 417 | 27 | 15.4 | 105.16 | 1.14 |
| 420 | 30 | 14.0 | 105.08 | 1.06 |
| 425 | 35 | 12.1 | 104.97 | .95 |
| 430 | 40 | 10.8 | 104.90 | .88 |
| 435 | 45 | 9.7 | 104.82 | .80 |
| 440 | 50 | 8.8 | 104.78 | .76 |
| 445 | 55 | 8.1 | 104.72 | .70 |
| 450 | 60 | 7.5 | 104.68 | .66 |
| 455 | 65 | 7.0 | 104.67 | .65 |
| 460 | 70 | 6.6 | 104.65 | .63 |
| 465 | 75 | 6.2 | 104.62 | .60 |
| 470 | 80 | 5.9 | 104.60 | .58 |
| 475 | 85 | 5.6 | 104.57 | .55 |
| 480 | 90 | 5.3 | 104.55 | .5:3 |
| 490 | 100 | 4.9 | 104.53 | .51 |
| 500 | 110 | 4.5 | 104.51 | .49 |
| 510 | 120 | 4.2 | 104.50 | .48 |
| 520 | 130 | 4.0 | 104.48 | .46 |
| 530 | 140 | 3.8 | 104.47 | .45 |
| 540 | 150 | 3.6 | 104.46 | .44 |
| 550 | 160 | 3.4 | 10-1.45 | .43 |
| 560 | 170 | 3.3 | 104.44 | .42 |
| 570 | 180 | 3.2 | 104.43 | .41 |
| 585 | 195 | 3.0 | 104.42 | .40 |
| 600 | 210 | 2.9 | 104.41 | .39 |
| 615 | 225 | 2.7 | 104.40 | .38 |
| 630 | 240 | 2.6 | 104.39 | .37 |
| 645 | 255 | 2.5 | 104.38 | .36 |
| 660 | 270 | 2.44 | 104.37 | .35 |
| 675 | 285 | 2.37 | 104.36 | .34 |
| 690 | 300 | 2.30 | 104.35 | .33 |
| 720 | 330 | 2.20 | 104.34 | .32 |
| 750 | 360 | 2.10 | 104.33 | .31- |
| 1350 | 960 | 1.40 | 104.26 | .24 |
Table 5--Data on aquifer test using well 12-26-11bb1 in Gove County, October 16, 1956. Average yield during pumping was 250 gpm measured by Hoff flow gage. Water-level measurements were made by electric water-level gage.
| Time since pumping started, minutes (t) |
Time since pumping stopped, minutes (t) |
t/t' | Depth to water level (feet) |
Drawdown below static water level (feet) |
|---|---|---|---|---|
| 0 | Pumping started | 72.37 | static water level | |
| 2 | 73.85 | 1.48 | ||
| 3 | 74.35 | 1.98 | ||
| 4 | 74.70 | 2.33 | ||
| 8 | 75.35 | 2.98 | ||
| 10 | 75.60 | 3.23 | ||
| 12 | 76.00 | 3.63 | ||
| 15 | 76.40 | 4.03 | ||
| 19 | 76.85 | 4.48 | ||
| 23 | 77.20 | 4.83 | ||
| 29 | 77.70 | 5.33 | ||
| 33 | 77.92 | 5.55 | ||
| 36 | 78.10 | 5.73 | ||
| 62 | 80.31 | 7.94 | ||
| 72 | 81.18 | 8.81 | ||
| 80 | 81.70 | 9.33 | ||
| 90 | 82.30 | 9.93 | ||
| 100 | 82.85 | 10.48 | ||
| 110 | 83.20 | 10.83 | ||
| 120 | 83.62 | 11.25 | ||
| 130 | 83.95 | 11.58 | ||
| 140 | 84.30 | 11.93 | ||
| 150 | 84.57 | 12.20 | ||
| 160 | 84.95 | 12.58 | ||
| 183 | 85.15 | 12.78 | ||
| 190 | 85.15 | 12.78 | ||
| 215 | 85.10 | 12.73 | ||
| 260 | 85.10 | 12.73 | ||
| 275 | 84.48 | 12.11 | ||
| 320 | pumping stopped | 84.75 | 12.38 | |
| 321 | 1 | 321.0 | 84.50 | 12.13 |
| 322 | 2 | 161.0 | 84.15 | 11.78 |
| 323 | 3 | 107.7 | 83.97 | 11.60 |
| 324 | 4 | 81.0 | 83.80 | 11.43 |
| 325 | 5 | 65.0 | 83.70 | 11.33 |
| 326 | 6 | 54.3 | 83.55 | 1,1.18 |
| 327 | 7 | 46.7 | 83.45 | 11.08 |
| 328 | 8 | 41.0 | 83.35 | 10.98 |
| 329 | 9 | 36.6 | 83.26 | 10.89 |
| 330 | 10 | 33.0 | 83.17 | 10.80 |
| 331 | 11 | 30.1 | 83.12 | 10.75 |
| 333 | 13 | 25.6 | 83.00 | 10.63 |
| 335 | 15 | 22.3 | 82.87 | 10.50 |
| 337 | 17 | 19.8 | 82.77 | 10.40 |
| 340 | 20 | 17.0 | 82.63 | 10.26 |
| 345 | 25 | 13.8 | 82.44 | 10.07 |
| 350 | 30 | 11.7 | 82.27 | 9.90 |
| 355 | 35 | 10.2 | 82.11 | 9.74 |
| 360 | 40 | 9.0 | 81.97 | 9.60 |
| 365 | 45 | 8.1 | 81.84 | 9.47 |
| 370 | 50 | 7.4 | 81.71 | 9.34 |
| 375 | 55 | 6.8 | 81,.58 | 9.21 |
| 380 | 60 | 6.3 | 81.47 | 9.10 |
| 390 | 70 | 5.6 | 81.25 | 8.88 |
| 400 | 80 | 5.0 | 81.05 | 8.68 |
| 410 | 90 | 4.6 | 80.87 | 8.50 |
| 420 | 100 | 4.2 | 80.70 | 8.33 |
| 430 | 110 | 3.9 | 80.53 | 8.16 |
| 440 | 120 | 3.7 | 80.37 | 8.00 |
| 455 | 135 | 3.4 | 80.16 | 7.79 |
| 470 | 150 | 3.1 | 79.94 | 7.57 |
| 490 | 170 | 2.9 | 79.72 | 7.35 |
| 510 | 190 | 2.7 | 79.53 | 7.16 |
| 530 | 210 | 2.5 | 79.35 | 6.98 |
| 550 | 230 | 2.4 | 79.19 | 6.82 |
| 575 | 255 | 2.3 | 79.02 | 6.65 |
| 605 | 285 | 2.1 | 78.83 | 6.46 |
| 650 | 330 | 2.0 | 78.60 | 6.23 |
| 710 | 390 | 1.8 | 78.34 | 5.97 |
| 770 | 450 | 1.7 | 78.10 | 5.73 |
| 890 | 570 | 1.6 | 77.70 | 5.33 |
| 1040 | 720 | 1.44 | 77.27 | 4.90 |
| 1220 | 900 | 1.37 | 76.85 | 4.48 |
| 1400 | 1080 | 1.3 | 76.51 | 4.14 |
| 1785 | 1465 | 1.2 | 75.67 | 3.30 |
| 2765 | 2445 | 1.1 | 73.97 | 1.60 |
Prev Page--Geology || Next Page--Ground Water Utilization, Quality
Kansas Geological Survey, Geology
Placed on web Sept. 30, 2008; originally published June 1960.
Comments to webadmin@kgs.ku.edu
The URL for this page is http://www.kgs.ku.edu/General/Geology/Gove/05_gw.html