When the salinities of mud filtrate and formation water are the same, the potential is zero and the SP log should be a featureless line. With a fresher mud filtrate and so, more saline formation water, a sandstone will show a deflection in a negative potential direction (to the left) from a "shale base line" (Figure 8). The amount of the deflection is controlled by the salinity contrast between the mud filtrate and the formation water. Clean (shale-free) sandstone units with the same water salinity should show a common value, the "sand line". In practice, there will be drift with depth because of the changing salinity of formation waters. The displacement on the log between the shale and sand lines is the "static self-potential" SSP.
Figure 8. Spontaneous potential (SP) and gamma-ray log from KGS Jones #1. Although they record different physical properties, the two logs are comparable because of their sensitivities to shale and so both can be used to differentiate between sandstones and shales. The stronger sandstone differentiation at greater depths on the SP log is caused by greater salinities in the deeper sandstones.

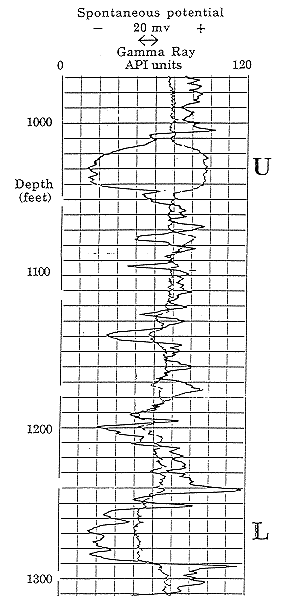
The SP log in Figure 8 is an example taken from a shallow section of the Dakota. Notice how the shale baseline shows a distinctive drift with depth. This characteristic is commonly observed in shallow sections and has been suggested to be caused by increases in relative oxidation of the rocks that are close to the land surface. The highest sandstone in the well has a muted deflection on the SP log as compared with the lower sandstones. This contrast is an immediate indication that water in the upper sandstone may be significantly fresher than waters of the lower sandstone. In other wells it is not uncommon to see sandstone units where the SP deflection goes to the right of the shale baseline. In these instances, the drilling mud filtrate is saltier than the formation water. A good example of this phenomenon is shown in Figure 9 from a well in north-west Kansas. In the upper sandstone, "U", the SP log shows a deflection to the right, indicating formation water to be fresher than the drilling mud, while in the lower sandstone, "L", the deflection is to the left, showing the formation water to be more saline.
Figure 9. Spontaneous potential (SP) and gamma-ray logs of the Dakota Aquifer in Cities Service Montgomery #2 CNENW 7-8S-23W, Graham County, Kansas. Note that the SP log deflects to the right in the upper sandstone, "U," but to the left in the lower sandstone "L." This "reversal" occurs because the formation water in the upper sandstone is fresher than the drilling mud, but saltier than the drilling mud in the lower sandstone.

The conductivity of the drilling mud filtrate is measured by the engineers at the well-site and recorded on the "header" of the log. This information combined with the SSP "battery effect" shown on the log can be used to estimate the conductivity of the formation water. The calculation is made very commonly by petroleum log analysts as an important variable in the search for potential oil or gas zones (see Figure 10). When used to evaluate the quality of aquifer waters, care must be taken to ensure realistic conclusions. Although formation water compositions at greater depths tend to be mostly sodium chloride, the ions of calcium, magnesium, bicarbonate and sulfate become more important in shallow, aquifer waters. As a result, the equations used by petroleum log analysts are only approximate and must be adjusted to honor the ionic mix of the local aquifer water. In general, the divalent ions of shallow waters tend to make them appear slightly more saline than they actually are when computed from the SP log.
Figure 10. Flow chart from oil-industry log analysis to estimate formation water resistivity, Rw, in deep formations from the SP log (Bateman and Konen, 1977). RMF is mud filtrate resistivity measured at temperature Tmf and recorded on the log header; Tf is the temperature of the formation, generally estimated by interpolating between the bottom-hole temperature (BHT) at total depth (TD) and mean annual temperature at the surface; SSP is the static self-potential measured on the log between the "clean line" and "shale line" in millivolts (mv) AND with associated sign (positive or negative).

An empirical chart was developed as part of the research in the Dakota to correct apparent water resistivities calculated from standard equations to estimates of real resistivities measured in Dakota Aquifer water samples (Figure 11). The corrected resistivities were then transformed to estimates of total dissolved solids. The method is particularly useful in Dakota Aquifer studies because it allows water quality studies to be extended beyond wells from which Dakota water samples were taken to wells that were unsampled but logged with an SP device.
Figure 11. Custom-designed chart and function to convert apparent water resistivity (Rwe) calculated from oil-industry algorithms to actual resistivity (Rw) of Dakota Aquifer waters. The correction is necessary because Rwe is calculated with the assumption that the dissolved solids in the water are from a single salt; actual Rw values will be controlled by the ionic mix of natural waters, and discrepencies with Rwe will be particularly noticable in the relatively fresher waters of shallow formations. From Boeken (1995).

Previous page--Porosity Logs ||
Next page--Resistivity Logs
Dakota Home ||
Petrophysics Intro Page