Hodgeman County Study, part 5 of 12
 is never straightforward.
First there is the problem of deciding how many groups, which to a
large extent one can settle in terms of external information or rules
based on the total sum of errors that one can obtain running cluster
analysis.
is never straightforward.
First there is the problem of deciding how many groups, which to a
large extent one can settle in terms of external information or rules
based on the total sum of errors that one can obtain running cluster
analysis.
A second and more difficult problem is the group assignment for observations that are not like any of the typical observations in a group and at the same time poorly resemble more than one group. Cluster analysis assignment for such problematic observations is unstable and varies depending on the measure of similarity and the clustering method.
If the quality of group assignments is a concern, cluster analysis
does not offer easy answers. That is the realm of discriminant
analysis, which decides the assignment of any vector
based on allocation probabilities.
Discriminant analysis, however, requires a training classification,
which in regionalized classification is the one generally produced
by cluster analysis.
The basis of discriminant analysis for assigning observations to
one of a given number of groups is the minimization of the total
misallocation cost. The procedure assumes that it is possible to
partition the attribute space in as many mutually exclusive and
exhaustive regions  as there
are groups. A site is said to belong to group
as there
are groups. A site is said to belong to group
 when the vector
of attributes associated with
the site falls in .
when the vector
of attributes associated with
the site falls in .
 be a vectorial random function
with probability density function
be a vectorial random function
with probability density function  and let
  be a realization of
at site
be a realization of
at site
 for short. Let
 be the proportional share of
observations in the
be the proportional share of
observations in the  group
whose probability density function is
group
whose probability density function is
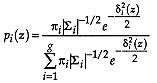
 . Then the probability
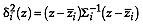
 that the site characterized
by belongs to the
group is
that the site characterized
by belongs to the
group is

Proof
The proof directly follows from Bayes' Theorem. If one considers
that can be regarded as the a
priori probability of sampling group ,
then is the posterior
probability that belongs to group
.
The optimality in terms of the misallocation cost is assured by
assigning to the group with the
highest probability (McLachlan, 1992, p. 7).
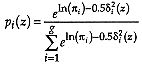
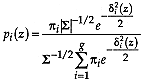
The kernel of discriminant analysis is the calculation of the probabilities in Theorem 1. As is always the case in statistics, there are non-parametric and parametric methods. By far, multivariate normal methods prevail among the latter and overall.
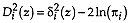
 be a realization of a
vectorial random function at site
for short. Let
be a realization of a
vectorial random function at site
for short. Let  be the vectorial
mean and
be the vectorial
mean and  the covariance matrix
of group . Then the Mahalanobis
distance from to the centroid of
group is the squared weighted distance
the covariance matrix
of group . Then the Mahalanobis
distance from to the centroid of
group is the squared weighted distance
be a normal vectorial random
function with heteroscedastic normal group distributions. If
is the a priori probability
f group and
 is the
Mahalanobis distance in Definition 3, then the probability
that the site characterized
by belongs to the
group is
is the
Mahalanobis distance in Definition 3, then the probability
that the site characterized
by belongs to the
group is
Proof
From Theorem 1
If the probability distribution for the group is normal,
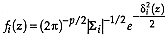
where  is the dimension of the attribute space. Considering that in addition
  (McLachlan, 1992, p. 5), then
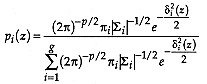
Cancellation of the  terms proves the theorem.
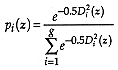
be a normal vectorial
random function with homoscedastic normal group distributions.
If is the a priori probability
of group and
is the
Mahalanobis distance in Definition 3 computed using the common
covariance matrix  , then
the probability that the
site characterized by belongs to
the group is
, then
the probability that the
site characterized by belongs to
the group is
Proof
From Theorem 2, considering that all covariance matrices are the same
Proof follows by the cancellation of the covariance matrix
determinant term and consolidation of exponents after the trivial
transformation  .
.
Use of the model in Theorem 3 results in hyperplanes for the
boundaries of the group regions ,
thus the term of linear discriminant analysis, while quadratic
discriminant analysis deals with different covariance matrices
and second order surfaces arising from the heteroscedastic model.
Whatever the model of discriminant analysis used for regionalized classification, the model requires a training set to determine the number of groups and for the assignment of realizations to the different groups in order to have some data for estimating the centroid and the covariance matrix of such groups.
 sites per group

 , in which case they are ignored in the calculations.
. Use the average of all group covariances if the assumption is that the covariance is homoscedastic.
the probability of belonging to each of the groups
, in which case they are ignored in the calculations.
. Use the average of all group covariances if the assumption is that the covariance is homoscedastic.
the probability of belonging to each of the groups
where, if
 , the discriminant analysis is linear with unknown or equal a priori group probabilities;
 , the discriminant analysis is linear with known and different a priori group probabilities;
 , the discriminant analysis is quadratic with unknown or equal a priori group probabilities;
 , the discriminant analysis is quadratic with known and different a priori group probabilities.
 must be
consistent with the decision of homoscedasticity made in step 4. The
term is the
Mahalanobis distance in Definition 3; and
must be
consistent with the decision of homoscedasticity made in step 4. The
term is the
Mahalanobis distance in Definition 3; and
 is the estimate of the covariance
matrix for group ;
is the estimate of the covariance
matrix for group ;
Statisticians concur that quadratic discriminant analysis indeed provides superior results if the group covariances are considerably different and the group sizes are large. Quadratic discriminant analysis, however, is more sensitive to deviations from multinormality and assignment errors in the training set (Lachenbruch, 1982).
Previous Page--Ward's Method ||
Next Page--Allocation by Extension
Dakota Home ||
Start of Hodgeman County Study