


Dakota Aquifer Program--Geologic Framework
Hodgeman County Study, part 10 of 12
Mapping of group membership probabilities.
Figure 7 shows the continuous variation for all membership
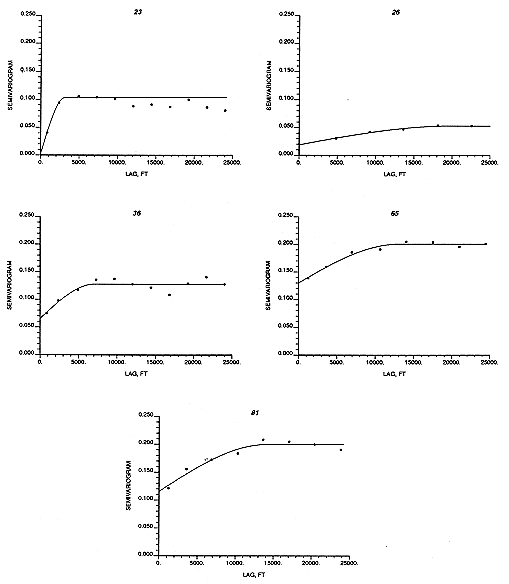
probabilities across the study area. Table 5 contains the
semivariogram models and Figure 8 displays both the models and
the experimental semivariograms. To minimize extrapolation
outside the convex hull of the sampling, estimates exceeding
certain kriging variance threshold were ignored. From top to
bottom and from left to right such maximum variance values for
the maps in Figure 7 are 0.13, 0.055, 0.16, 0.235, 0.235.
Figure 7. Membership probability maps for
all five groups in the regionalized classification of the
Dakota aquifer, southcentral Hodgeman County, Kansas.
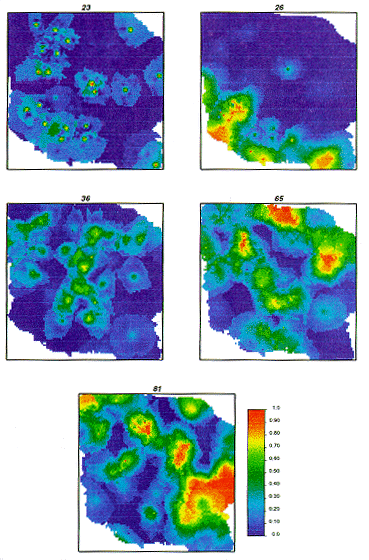
Table 5. Semivariogram models for group
membership probabilities
| Group | Type | Nugget | Sill | Range
ft |
| 23 | Spherical | 0.002 | 0.103 | 3137 |
| 26 | Spherical | 0.019 | 0.054 | 20251 |
| 36 | Spherical | 0.065 | 0.127 | 7140 |
| 65 | Spherical | 0.130 | 0.201 | 13050 |
| 81 | Spherical | 0.116 | 0.200 | 14104 |
Figure 8. Probability semivariograms for all
five groups in the regionalized classification of the Dakota
aquifer, southcentral Hodgeman County, Kansas.
Previous Page--Discriminant analysis ||
Next Page--Regionalized classification maps
Dakota Home ||
Start of Hodgeman County Study
Kansas Geological Survey, Dakota Aquifer Program
Updated Sept. 16, 1996.
Scientific comments to P. Allen Macfarlane
Web comments to webadmin@kgs.ku.edu
The URL for this page is HTTP://www.kgs.ku.edu/Dakota/vol1/geo/hodge10.htm