Kansas Geological Survey, Current Research in Earth Sciences, Bulletin 253, part 3
Prev Page--Start || Next Page--Results and Discussion
![]()
![]()
![]()
Kansas Geological Survey, Current Research in Earth Sciences, Bulletin 253, part 3
Prev Page--Start ||
Next Page--Results and Discussion
![]()
Nitrate-nitrogen (nitrate-N) is a common contaminant in drinking- and irrigation-water supplies in the Midwest (Pope et al., 2001; Spalding and Exner, 1993). Many studies have used the 15N natural abundance method, as well as the 18O on nitrate for determining sources of nitrate-N in ground water (Kendall, 1998; Kreitler, 1975; Fogg et al., 1998). However, little has been done using 13C natural abundance as a complementary tracer for contaminants in ground water. Sources of 13C ultimately involve C3 or C4 plants that have been utilized as food. Total organic carbon (TOC) and dissolved organic carbon (DOC) are common analyses in soils and water. Use of 13C as a tracer, particularly in farmed areas, might assist in verifying sources of contaminants if sufficient background information and observations can be obtained.
In west-central Kansas, nitrate has become an increasing problem in an area with a limited ground-water supply (Townsend et al., 2001; Townsend and Young, 2000; Townsend and Macko, 2004). The City of Hays has occasional elevated nitrate-N in its municipal water supply. Other studies in Kansas show that nitrate-N from soil water in more permeable soils are a significant contributor to ground-water nitrogen (Townsend et al., 1996; Townsend and Young, 2000). Because of variable land use and soil of alluvial origin in the study area, it was hypothesized that soil water could be a major contributor to the ground-water contamination in the study area. This study used natural-abundance 15N and 13C stable isotopes to determine potential sources of nitrogen and carbon to the aquifer and to determine if soil nitrogen is a major contributor to the ground-water nitrate-N problem.
The study area is located in the city of Hays, Ellis County, in west-central Kansas (fig. 1) where agricultural land use is a mixture of irrigated and dry-land farming. Rangeland and feedlots also are present. Average rainfall is approximately 50 cm/yr (20 in/yr) with potential evapotranspiration of approximately 75 cm/yr (30 in/yr) (Thornwaite, 1948 and 1952; Sophocleous, 1998).
Figure 1--Topographic map (USGS, 1997) of study area with sampled wells. The agricultural experiment station, new sewage-treatment plant (north of well C-31), old sewage-treatment plant (west of well C-27), and park area shown on the map are potential sources of nitrate-N contamination.
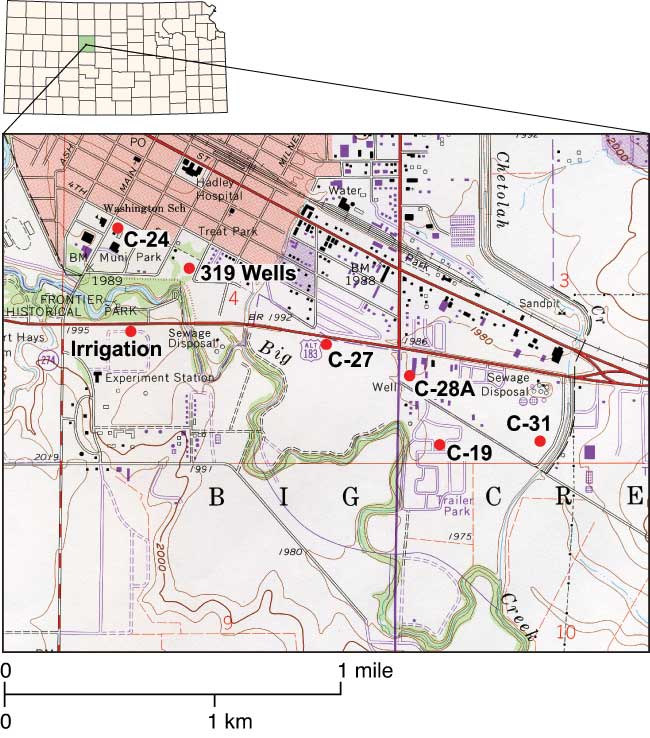
Five of the six sampled wells are municipal wells located in the Quaternary alluvial terrace deposits of Big Creek on the southern edge of Hays (fig. 1; Neuhauser and Pool, 1988). These municipal wells were selected based on observed increased nitrate-N concentrations over the years. An agricultural-research-farm irrigation well (Irrigation Well) (fig. 1) also was tested to see if any direct input from long-term fertilizer use would be observed in the ground water. Ground-water flow in the study area is towards Big Creek. Sampled wells ranged in depth from 13 to 19 m (42 to 62 ft) with depth to water ranging from 7 to 8 m (23 to 26 ft). Most of the city wells were installed in 1955, and the Irrigation Well was installed in 1967 (DWR and KGS, 2005).
Land use near the sampled wells is shown in table 1 and fig. 1. The farmed areas and parks are currently treated with commercial fertilizer, not manure, as the nitrogen source (City of Hays manager, personal communication, 2002). However, previous fertilizing and land-use practices in the area are not known. The well in the trailer park is not located near any identifiable abandoned septic systems. Sewer lines have been installed in the city for many years (City of Hays manager, personal communication, 2002).
Table 1--Land use near City of Hays wells sampled during study.
| Well | Land Use |
|---|---|
| C-27 | Farmland to west and south. Closed sewage treatment plant to west of the well and Big Creek (fig. 1). |
| C-19 | Trailer park. |
| C-24 | City park near swimming pool. |
| C-28A | Car dealership. |
| C-31 | Ball-field park. |
| Irr. well | Milo in field and feedlots to south of irrigation well. Big Creek between the well and abandoned sewage plant. |
Soil series in the study area consist predominantly of Roxbury silt loam and Detroit silt loam of alluvial origin. Calcium carbonate is present throughout the soil-profile descriptions of both soil series (Appendix A). Field-soil descriptions for the collected cores agree well with the data from the National Resources Conservation Service (NRCS) soils data base (Appendix A; USDA NRCS, 2002).
Silt and clay percentages in these soils (USDA SCS, 1975) suggest a low hydraulic conductivity and possible lengthy travel time from land surface to ground water. However, both the Roxbury silt loam and the Detroit silt loam have a reported hydraulic-conductivity range of 1.5-5 cm/hr (1.2-3.9 ft/day; USDA SCS, 1975). The field-soil descriptions (Appendix A) indicate the presence of fine roots and tubular pores to various depths at all coring sites; these pores and root channels may permit macropore flow and may be a reason for the higher than expected hydraulic conductivity.
Five city wells and the irrigation well at a university agricultural-research station (fig. 1) were sampled in May 2002, and one of the city wells (C-27) also was sampled in November 2001. The wells were pumped until the specific conductance stabilized for three consecutive readings. For most of the wells, stabilization of specific conductance occurred within 10 minutes of initiation of pumping. Two of the wells, C-27 (with a high nitrate-N concentration) and C-24 (with the lowest nitrate-N concentration) were not currently being used by the city. These two wells were pumped for approximately 15-20 minutes until the water ran clear, and then the water was tested for specific conductance and temperature until the readings stabilized.
Soil cores were collected to approximately 5-m depths within 3 m of four of the city wells (C-27, C-19, C-28A, and C-31), in an irrigated field near the Irrigation Well at the agricultural-research station, and near the M-319 cluster of monitoring wells (fig. 1). No core was collected at site C-24 near the swimming pool because the area was cemented in. Cores were taken using a Giddings probe and were described by soil scientists with the northwestern Kansas Natural Resource Conservation Service (NRCS) field office (Appendix A). The collected cores were sub-sampled for chemical analysis (described in next section), stored in plastic bags on ice, and refrigerated upon return to the Kansas Geological Survey (KGS) until delivery to the Kansas State University (KSU) Soil Testing Laboratory in Manhattan.
Complete inorganic water analyses were performed by the KGS Analytical Services Section. Samples for nitrate-N analysis were collected in 250-mL bottles and treated with 10% HCl acid for preservation. Samples for all other inorganic constituents were collected in acid-rinsed 500-mL polyethylene bottles, with 125-mL bottles used for nitrogen-15 analyses. If needed, samples were filtered in the laboratory using a 0.45μ Micropore© filter prior to chemical analysis. Samples were analyzed for major cations (calcium, magnesium, sodium, and potassium) and anions (chloride, bicarbonate, sulfate, nitrate, and fluoride), in addition to pH, specific conductance, temperature, and calculated total dissolved solids using standard methods described by Hathaway et al. (1977). Nitrate was determined using a UV method developed at the KGS (Hathaway, 1990).
The KSU Soil Testing Laboratory performed chemical analyses on soil samples for nitrate-N, ammonium-N, total nitrogen, carbonate, and total organic carbon. Total levels (inorganic and organic) of C and N were determined on a dry-weight percent basis using a LECO CN 2000 combustion analyzer (LECO Corp., 1995). Calcium-carbonate percentage was analyzed by pretreatment of a second LECO combustion sample with dilute (10% v/v) HCl. Carbon dioxide is released from calcium and magnesium carbonates in calcareous soils, leaving only the total organic carbon present (LECO Corp., 2000). Total organic carbon is the % C in the acid-treated, carbonate-free sample. Total inorganic carbon is calculated as the difference in the treated and untreated values, and the percentage of carbonates, expressed as CaCO3, is then calculated (KSU, 2006).
For comparison with the observed ground-water values, nitrate-N values from the cores were converted from mg/kg to mg/L using minimum and maximum oven-dried bulk density and percent-moisture values from the NRCS soil data base for Detroit and Roxbury soils (USDA NRCS, 2006). The bulk density and soil moisture were not measured from the collected cores.
Nitrogen-15 and carbon-13 isotope analyses of water and soils were used as source-detection tools to determine sources for the observed nitrate-N values in the ground water at Hays. For isotope analyses of water, water samples were acidified to remove carbonates, dried at 60°C without washing to avoid loss of soluble organic matter, ground to fine powder, and homogenized. These homogenized residues were chiefly composed of organic carbon and nitrate-N. Historical water-quality records for all of the wells, except for C-24, showed nitrate-N as the primary form of nitrogen in these waters (fig. 2).
Figure 2--Historic nitrate-N and chloride values for wells sampled in study. Most of the wells show an upward trend in nitrate-N. Chloride is highest in well C-24, which had reducing water chemistry and lowest nitrate-N values. All other wells have chloride within a range of 100 to 175 mg/L (Appendix A). Data obtained from City of Hays manager (personal communication, 2002).
Soil samples for organic carbon (OC) and total nitrogen (TN) content and isotopic composition were acidified to dampness with 30% HCl to remove carbonates, dried without washing to avoid loss of soluble organic matter, and ground to a homogenous powder. Isotopic analyses were determined using an elemental analyser (EA) coupled through continuous flow with an OPTIMA stable isotope ratio mass spectrometer (GV Micromass, Manchester, UK). Carbon and nitrogen isotopic compositions were reported according to the equation:
δxE (‰) = (Rsample/Rstandard - 1) x 103,
where E is the given element, x is the heavy isotope of that element, and R = 13C/12C or, 15N/14N. Internal laboratory reference gases for carbon and nitrogen were calibrated against the respective international standards NBS-19 and atmospheric N2 (Hoefs, 2001). Results were reported in delta notation (δ) as per mil deviations (‰) from the corresponding international standards of Peedee Belemnite (PDB) and atmospheric N2 (air). Analytical precision for carbon and nitrogen was within ±0.2‰.
Natural-abundance nitrogen-isotope analysis is frequently used to assist in determining sources of nitrogen to ground water. Generally, bacteria and plants preferentially use 14N, resulting in an increased δ15N value in the remaining nitrogen. Previous work shows that nitrate-N in commercial fertilizer sources has δ15N values of -2 to +2‰; soil nitrogen has a range of +5 to +7‰; and animal waste generally has values greater than +10‰ (Heaton, 1986; Herbel and Spalding, 1993; Townsend et al., 1996).
Ground water in Kansas that has received frequent inputs of fertilizer has measurable nitrate-N generally greater than 2 mg/L, the pristine water value established by the U.S. Geological Survey (Mueller and Helsel, 1996; Townsend and Young, 2000). Anhydrous ammonia is the primary fertilizer used in much of Kansas (KDA, 2006). Because of possible volatilization of anhydrous ammonia by bacterial or chemical processes (Herbel and Spalding, 1993; Korom, 1992), observed δ15N values frequently are in the +2 to +8‰ range (Townsend and Young, 2000). Other sources such as human-septic waste or animal waste have δ15N values around +5‰ when excreted. Animal waste has a high ammonia component and because of the preferential release of 14N by the volatilization of ammonia (Kreitler, 1975), the remaining nitrogen becomes enriched in δ15N to a value of +10‰ or more. Generally in Kansas, with animal-waste sources, nitrate-N values are commonly more than 10 mg/L and δ15N values are above +10‰ (Townsend et al., 2003).
Volatilization also can occur in soils and rocks with carbonate zones (caliche). These zones act as temporary perching zones for downward-moving water. The carbonates can increase the pH of water towards 8.5; in this range nitrate-N can be converted chemically to ammonia gas. The lighter 14N isotope is preferentially released with the gas. The remaining nitrogen becomes enriched with δ15N of a higher value (Herbel and Spalding, 1993).
Denitrification also can result in an enriched δ15N value by bacterial degradation of nitrate-N to nitrogen gases that are released to the atmosphere. The preferential utilization of 14N of the nitrate by the bacteria results in an enriched δ15N in the remaining nitrate. Signs of possible denitrification observed in other areas of Kansas are low nitrate-N values; enriched δ15N values; high levels of bicarbonate, which is a byproduct of the denitrification process (Kendall, 1998); reducing water chemistry with pH less than 6; measurable iron and manganese; and a hydrogen sulfide odor (Townsend and Sleezer, 1995).
As with the 15N natural-abundance method, the 13C natural-abundance method reflects the sources of carbon as well as the impacts of biological recycling of the carbon. Trees, shrubs, cool-weather grasses, and crops, including wheat, rye, and oats, are classified as C3 and have a δ13C range from -20 to -32‰ and a mean of -27‰. Other plants, such as corn, sorghum, sugar cane, and warmer-weather grasses, are classified as C4 plants and have a δ13C range from -10 to -17‰, with an average of -12‰ (Johnson et al., 2007; Ehleringer et al., 2000).
In terrestrial settings most δ13CDOC values in ground water vary from -26 to -30‰, which is similar to the δ13C signature of the C3 plants listed above. Where C4 plants are prevalent δ13CDOC values in ground water occur up to -18‰ (Spalding et al., 1978; Wang et al., 1998). In general the δ13CDOC in most ground waters reflects the average carbon isotope values of the local decomposing plant material (Wang et al., 1998; Deines, 1980).
Carbon-13 is also a good indicator of animal diet. Fecal material from pigs fed either a 100% C3 (soybean [-24.0‰], barley [-25.3‰], and alfalfa [-26.0‰]; fecal matter [-25.7‰]) or C4 (corn [-11.3‰]; fecal matter [-12.8‰]) diet reflected the δ13C values mentioned previously (Hare et al., 1991). Use of carbon-13 values can help to determine potential plant sources for DOC in soils and in ground water. Similarities or differences in the δ13C values between soils and ground water suggest the potential for determining if soils are a major contributor to observed δ13CDOC in ground water.
Nonparametric methods and the SPLUS® ver. 7 statistical package (Insightful Corporation, 2005) were used for statistical analysis of water samples from this study in addition to the chloride (251 samples) and nitrate (254 samples) data obtained from the City of Hays (City of Hays manager, personal communication, 2002). Nitrate and chloride data were found to be non-normal in distribution based on the Shapiro-Wilks test.
The Mann-Kendall test for trend (Helsel and Hirsch, 1995) was used to evaluate the nitrate-N and chloride trends observed in some of the wells (fig. 2). The test uses tau (τ) to evaluate the monotonic correlation between concentration and time. Tau is the non-parametric equivalent of the parametric statistical correlation coefficient (r). If the concentration of a parameter increases with time, then τ will have a positive value and the calculated probability level, p, is compared to the significance level, α, assigned to the test. Because of the geologic and spatial variability throughout the area, α was set at 0.10 (Davis, 1986).
If the p-value (p) for a given test is less than α = 0.10, the test is considered significant and the null hypothesis ofH0 = no trend observed
is rejected.
Prev Page--Start || Next Page--Results and Discussion
Kansas Geological Survey
Updated July 10, 2008
http://www.kgs.ku.edu/Current/2007/Townsend/02_intro.html
email:webadmin@kgs.ku.edu