Kansas Geological Survey, Current Research in Earth Sciences, Bulletin 248, part 1
Prev Page--Start || Next Page--Methodology
![]()
![]()
![]()
Kansas Geological Survey, Current Research in Earth Sciences, Bulletin 248, part 1
Prev Page--Start ||
Next Page--Methodology
![]()
In 1996, we began research on applications of remote sensing for evaluation of forest cover in northeastern Kansas. We selected two study forests on the Fort Leavenworth military reservation. The first is an upland forest composed of oaks and other hardwood species; the second is a bottomland forest of cottonwood and other softwoods on the Missouri River floodplain. Although managed in somewhat different ways, both forests experienced minimal human impact during the past two decades. The goal of our investigation was to establish relationships between satellite observations of vegetation, actual growth of trees, and climatic events of the past three decades. We employed Landsat Thematic Mapper (TM) datasets as our primary source of remotely sensed information for the period 1987 to 1997. These datasets were supplemented on the ground with kite aerial photography (KAP), tree-ring analysis of the upland forest, climatic records for northeastern Kansas, and various ancillary data on geology, soils, and topography.
The study period included a major drought in 1988-1989 and the 1993 flooding of the Missouri River, which completely innundated the bottomland. The study, thus, spans years of climatic extremes as well as near-normal intervals. The study revealed complicated and unexpected relationships between climatic events, response of forest growth, and satellite observations (Aber et al., 1998; Wallace, 2000). These results have important implications for use of satellite imagery in the interpretation of vegetation cover and environmental conditions for similar forest types in the central United States.
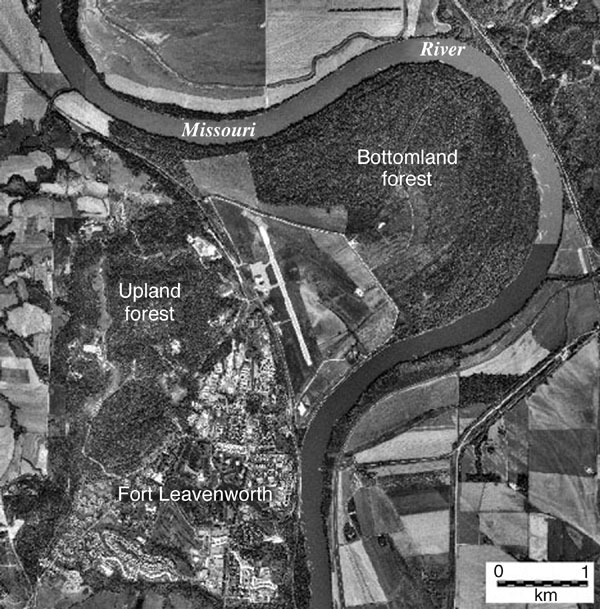
The study forests are located on the Fort Leavenworth military reservation, immediately north of the city of Leavenworth in northeastern Kansas (fig. 1). The upland forest occupies a bedrock ridge in the western portion of the military reservation, and the bottomland forest is located within a large meander loop of the Missouri River (fig. 2). The region ranges in elevation from 232 m (760 feet) on the Missouri River to 332 m (1,090 feet) at Hancock Hill in the upland forest. The bottomland forest includes approximately 550 hectares (1,360 acres) and is relatively continuous in coverage. The upland forest, in contrast, is somewhat disjunct; it is broken by openings for roads, buildings, and other structures. The upland forest covers about 400 hectares (990 acres).
Figure 1--General location map for study forests at Fort Leavenworth, Kansas: 1 = upland, hardwood forest, 2 = bottomland, softwood forest (adapted from Aber et al., 1999).
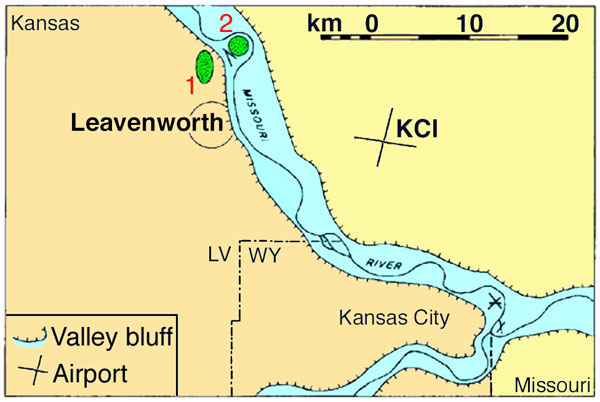
Figure 2--Orthophotograph of the study area at Fort Leavenworth, Kansas. Data from the Kansas Geological Survey.
An ecological survey of the Fort Leavenworth vicinity was carried out by Brumwell (1951), who described the types of forest on the military reservation; the forests were further documented by Kuchler (1974). More recently, detailed mapping by the State Biological Survey of Kansas provided a comprehensive inventory of plant and animal species on the military reservation (Freeman et al., 1997).
The upland forest is composed of two portions (fig. 3). The main portion is classified as Quercus alba-Carya ovata/Ostrya virginiana (white oak-shagbark hickory) forest (Freeman et al., 1997). A smaller portion is identified as Acer saccharum-Tilia americana-Quercus rubra/Ostrya virginiana (maple-basswood) forest. The upland study forest represents a mature vegetation succession that has existed for 150-200 years. It is composed of drought-resistant trees including white oak, northern red oak, burr oak, bitternut, and shagbark hickory. Other trees in the upland forest are American elm, green ash, box elder, backbrush, hackberry, basswood, pecan, silver and sugar maple, sycamore, walnut, and redbud. Small tracts of native (warm-season) and introduced (cool-season) prairie exist within the upland forest. Also present within the upland forest are roads, buildings, water tanks, and other structures.
Figure 3--Composition of study forests at Fort Leavenworth. A = upland white oak-shagbark hickory forest, B = upland maple-basswood forest, 1 = bottomland cottonwood-sycamore forest, 2 = bottomland pecan-sugarberry forest (adapted from Freeman et al., 1997).
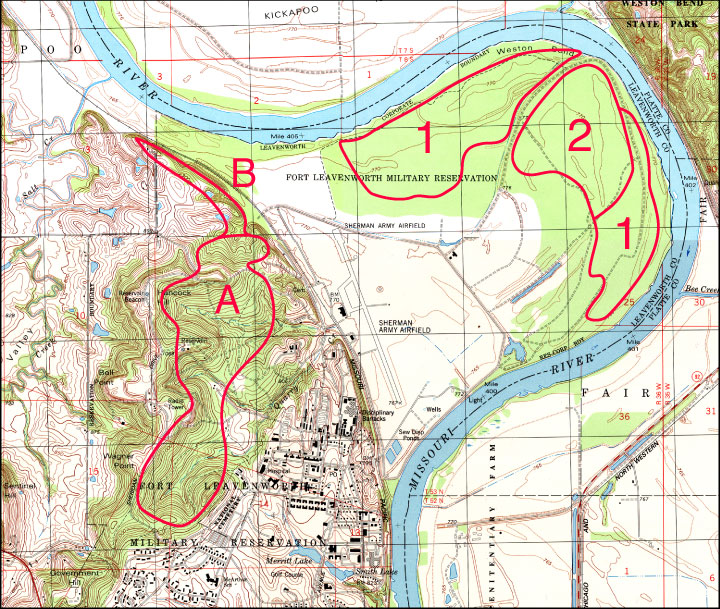
The bottomland forest also is composed of two types (fig. 3). The first is classified as Populus deltoides-Platanus occidentalis (cottonwood-sycamore) forest and the second as Carya illinoensis-Celtis laevigata (pecan-sugarberry) forest (Freeman et al., 1997). These forests are composed primarily of cottonwood and pecan. Other trees include box elder, red mulberry, green ash, and American elm. Sugarberry is not present; it is replaced by hackberry. The forest floor is swampy with open, waterlogged zones in old meander scrolls. The bottomland forests at Fort Leavenworth are believed to be the largest old-growth stands remaining in the lower Missouri River valley (Freeman et al., 1997). These forests have developed in a dynamic river system that floods periodically, most recently in 1993 when the Missouri River completely innundated the Fort Leavenworth bottomland. The 1993 flood was the greatest of historical record in many portions of the lower Missouri River valley. New trees now flourish on the flooded areas.
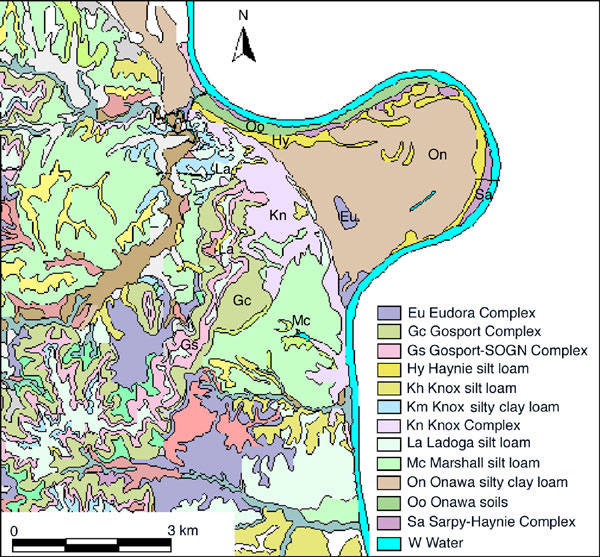
The study area is part of the glaciated region of northeastern Kansas. Unconsolidated surficial sediments include Pleistocene till and loess on uplands and Holocene alluvium in the stream valleys (fig. 4). Underlying bedrock is composed of alternating layers of limestone, sandstone, and shale of Pennsylvanian age. The high ridge in the western portion of the military reservation is supported by the Oread Limestone of the Shawnee Group. The Oread includes thick limestone members that are relatively resistant to erosion. Lower portions of the study area are underlain by softer shale and sandstone of the Douglas Group. The upland study forest is associated mainly with the Knox and Gosport soil complexes (fig. 5), which developed from loess, till, and weathered bedrock. They are located on moderately to steeply sloping portions of the topographic ridge in the western portion of the military reservation. The bottomland study forest grows mainly on Onawa soils in alluvial sediment of the floodplain.
Figure 4--Generalized geology of the study area. Based on data (1999) from DASC, Kansas Geological Survey.
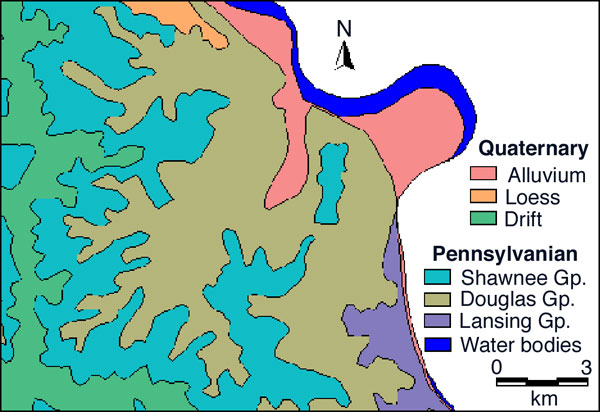
Figure 5--Soils map of the study area. Based on data (1999) from DASC, Kansas Geological Survey.
The climate of northeastern Kansas is continental with distinct seasons. Mean annual temperature is about 54° F (12° C); temperature extremes range from more than 100° F (38° C) to less than 0° F (-18° C). Daily temperature fluctuations of 35° F (20° C) or more can happen any time during the year. Average annual precipitation is around 90 cm (35 inches). Most precipitation is received in spring and early summer (April-July) with a second wet season in the autumn (October-November) of some years. The mean annual precipitation (January-December) for the study area for the period 1987-1997 was 74 cm (29 inches), well below the long-term average (NCDC, 1999).
With the successful launch in 1972 of the Landsat satellite series, much scientific research has focused on the identification, classification, interpretation, and mapping of vegetation for local, regional, and global applications in earth-system science. Following Landsat, many more satellite systems have been designed and operated for monitoring vegetation conditions on the land portions of the Earth's surface. The use of satellite remote sensing for monitoring vegetation is now a core priority within NASA's Earth Observing System for understanding global climatic change (Asrar and Dozier, 1994).
Photosynthetically active land vegetation strongly absorbs red (0.6-0.7 µm) light and strongly reflects near-infrared (0.7-1.0 µm) energy. It is the only common land-cover material with this spectral signature (Colwell, 1974). Many vegetation indices have been derived based on numerical combinations of red and near-infrared values in remotely sensed datasets (Tucker, 1979; Perry and Lautenschlager, 1984). The most widely used vegetation index is the Normalized Difference Vegetation Index (NDVI), introduced by Rouse et al. (1974) and now a standard method for vegetation analysis: NVDI = Near-infrared - Red / Near-infrared + Red (Price and Bausch, 1995).
NDVI values range from -1 to +1. Positive values represent active vegetation, and near-zero or negative values represent other types of materials: bare soil/sediment, bedrock, concrete/asphalt, water bodies, snow/ice, and clouds. Early work revealed that plants under stress show reduced reflectivity in the infrared spectrum (Gates et al., 1965; Allen and Richardson, 1968). Further research has shown that moisture content in plant leaves is indicated by the ratio of mid-infrared (1.3-2.5 µm) to near-infrared reflectivity (Tucker, 1980; Carter, 1991). On this basis, a moisture-stress index (MSI) has been utilized to detect drought and other stress conditions in vegetation and is intended to detect decreased water content in leaf foliage: MSI = Mid-infrared / Near-infrared (Rock et al., 1986; Hunt and Rock, 1989; Cibula et al., 1992).
In a preliminary analysis of Landsat TM datasets for the Fort Leavenworth upland forest (Wilkins, 1997), NDVI values for spring, summer, and autumn for 1987, 1988, 1990, and 1994 were examined and compared to climatic records and tree-ring data. Wilkins (1997) identified a one- to two-year lag between the drought of 1988-1989 and decline in forest NDVI values. In another study based on AVHRR data, Wang et al. (2001) examined biweekly trends in NDVI, temperature and precipitation during a 9-year period (1989-1997) for the state of Kansas. They found that deviations in average precipitation corresponded to most spatial and year-to-year variations in NDVI values; however, temperature deviations from average generally were not correlated with NDVI variations. They concluded that precipitation is a strong indicator for regional patterns of NDVI and vegetation productivity.
Dendroclimatology is based on analysis of tree-ring records. Variations in tree-ring width are highly correlated with availability of moisture in soils (Fritts, 1976), and dendroclimatology has been studied in several parts of the U.S. Great Plains (Stockton and Meko, 1975; Blasing and Duvick, 1984; Cook et al., 1988). In an investigation of the tree-ring record for oak species in the upland forest at Fort Leavenworth, Nang (1998) found that tree-ring width is correlated strongly with the Palmer Drought Severity Index (PDSI), a common climatic index for drought conditions (Palmer, 1965), but not strongly correlated with either precipitation or temperature alone. Nang (1998) concluded that growth of tree rings responds in the same year to available moisture. NDVI values derived from Landsat TM datasets, however, do not show a direct relationship to tree-ring width or PDSI values (Nang, 1998).
In similar studies elsewhere, Davenport and Nicholson (1990) utilized NDVI values to analyze various types of vegetation in East Africa. They found that NDVI values are sensitive to rainfall in dry areas, but a significant lag period was noted for wet forests. In the southeastern United States, Pinder and McLeod (1999) found rather weak correlations among decreased rainfall, tree-ring growth, and MSI values for longleaf pine. These results taken collectively indicate that complicated relationships exist between climatic events, tree growth, forest canopy, and NDVI values determined from satellite imagery. Climatic events may result in immediate responses for some tree-growth factors, whereas responses may be delayed by one or two years for other factors. Furthermore, the nature of forest response to climatic events may vary with different tree species and environmental settings.
Prev Page--Start || Next Page--Methodology
Kansas Geological Survey
Web version January 25, 2002
http://www.kgs.ku.edu/Current/2002/aber/aber2.html
email:webadmin@kgs.ku.edu