How to Use This Inventory
Welcome to the Construction Material Inventory (CMI) website. This site combines the latest in Geographical Information System (GIS) features with geological and engineering information to create a modern, interactive tool for exploring the potential construction resources available in a particular area. You can expect to see changes in the website from time to time as it is a dynamic tool undergoing periodic additions and updates. Feedback is important; let us know if we can improve a feature or its explanation. This how-to-use document demonstrates the capabilities and types of information currently available. Clicking on an item in the Table of Contents below will take you to that subject.
Table of Contents
- Part I--Website Organization, Navigation, Print Features
- CMI Homepage
- Pottawatomie County Homepage
- Interactive Map
- Navigation Tool Bar
- Zoom Level
- Identify Site Data
- Get Coordinates
- Full Extent
- Legend
- Pan
- Directional Arrows
- Share This Map
- Print Map
- Part II--GIS Overlays
- Interactive Map Overlay Table of Contents
- Highways, Roads, Railroads overlays
- PLSS overlay
- Major Streams/Rivers and Streams overlays
- Pottawatomie County Geology overlay
- Geology Contacts overlay
- Topological Map overlay
- Land Cover overlay
- 2002 Black and White Aerial overlay
- 2005 Color overlay
- Part III--Website Databases, Types of Information Available
- CMI Points and WWC5 Wells
- KDOT Highway and Bridge Projects
- Material Analysis Sites
- Measured Sections, Rock Exposures, Cores
- Commercial Quarries
Part I--Website Organization, Navigation, Print Features
The CMI Homepage State map allows you to access available data by clicking on the county you wish to access.
- Interactive map features and data are currently available for Pottawatomie County (in green).
- In addition, KDOT Construction Material Inventories are available as PDF files (in yellow). Within some KDOT inventories are links to available USGS inventories for the same county.
- The USGS CMIs shown above (in blue) have no corresponding KDOT county inventory publication. Accessing the USGS documents may require the downloading and installation of a particular software plug-in (downloading links and instructions available at the USGS website).
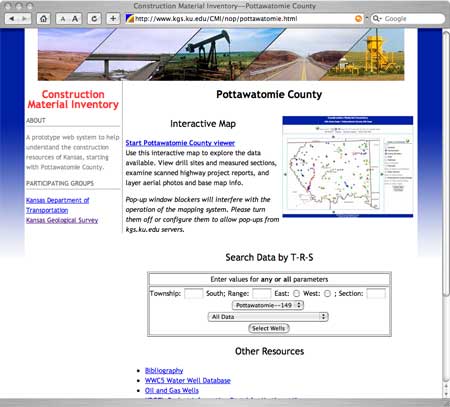
By clicking on the Pottawatomie County highlighted in green, we enter the Pottawatomie County Construction Material Inventory Homepage. There are three main elements:
- An interactive map with GIS capabilities;
- A search engine that pulls all data within a Township, Range, and Section into a table format, rather than a graphical format as with the interactive map;
- An "Other Resources" listing internet links to relevant organizations and databases. "Bibliography," for example, lists all publications and research thesis papers pertaining to Pottawatomie County.
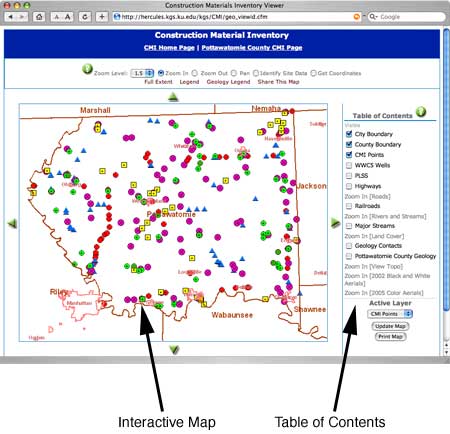
Interactive Map
Clicking on the Pottawatomie County Viewer brings you to the interactive map viewer for Pottawatomie County (see image below). Warning! If your pop-up blocker is turned on, it may interfere with using interactive map features or in being able to access point data. At the Menu feature at the top of your webpage, go to "Tools" and then to "Popup Manager" and then click on "Allow Popups."
The Table of Contents on the right-hand side of the screen (black arrow) lists map overlays that can turned on and off. Some overlay features will only activate once a certain level of resolution, or zooming in, is achieved. Please note that the City Boundary, County Boundary, and CMI Points features are defaulted to be checked on when the interactive map is first accessed. The Table of Contents and its overlays will be explained in greater detail in Part II.
Note: An overlay might be activated by simply checking the overlay box and then pressing the enter/return key. It will depend on the web browser being used (Internet Explorer, Firefox, Safari, etc.). It is also possible that the interactive map will do nothing if the enter/return key is pressed. If this occurs, please click the "Update Map" feature instead of the enter/return key.
Within the interactive map viewer, the Navigation Tool Bar at the top of the page allows movement within the interactive map.
![]()
Clicking on the question mark ![]() will activate a panel that explains the tool bar functions. You may wish to switch back and forth between this document and the Pottawatomie County Interactive map to experiment with the illustrated changes yourself.
will activate a panel that explains the tool bar functions. You may wish to switch back and forth between this document and the Pottawatomie County Interactive map to experiment with the illustrated changes yourself.
Zoom Level: The default zoom level is 1.5x, with additional levels of 2x, 3x, 5x, and 10x. The best way to discover what zoom level works best for your search is to take a few minutes to experiment and get a feel for zooming in and out. For example, starting at full extent (the entire county), choosing 10x, choosing "zoom in" and clicking once in the interactive map will allow you to zoom in from the full county view to a twelve square mile area or about one-third of a township.
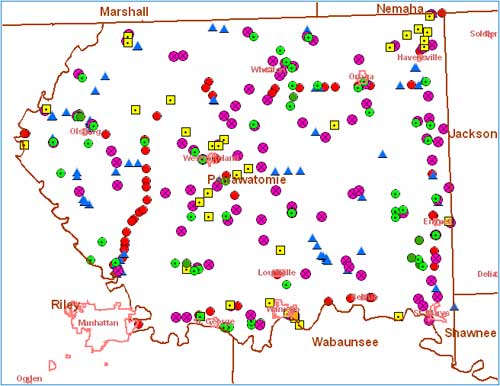
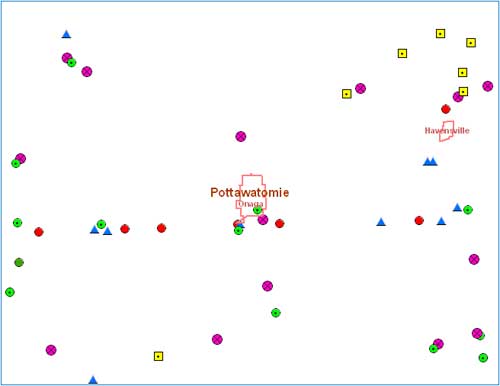
The image below is the Pottawatomie County Interactive map at "Full Extent."
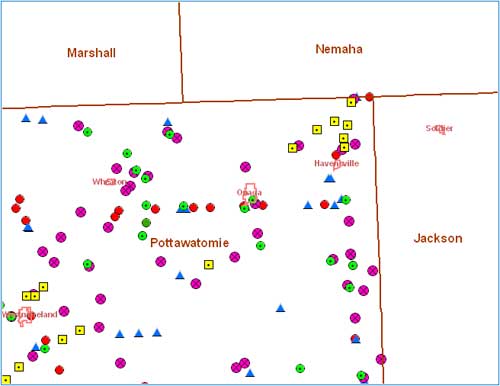
With the zoom level set at 1.5x, click on the city/town area labeled "Onaga" in the upper right-hand corner. The image below is of the interactive map after clicking 1.5x once. Also take note of the changes that automatically occur in the Table of Contents. The Topo and Aerial overlays are now active.
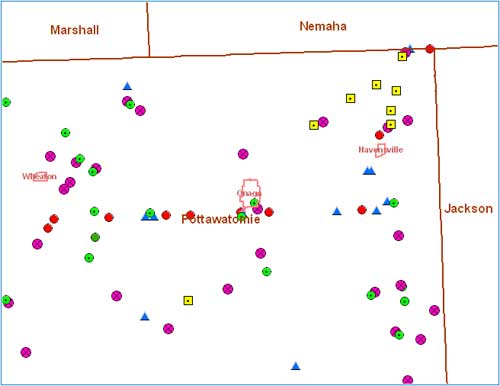
The image below is Onaga after clicking twice with zoom 1.5x. Please note that the Table of Contents has not changed.
Click on Onaga for the 3rd time with zoom 1.5x and you get the image below. Please note that in the Table of Contents, all features will be active now.
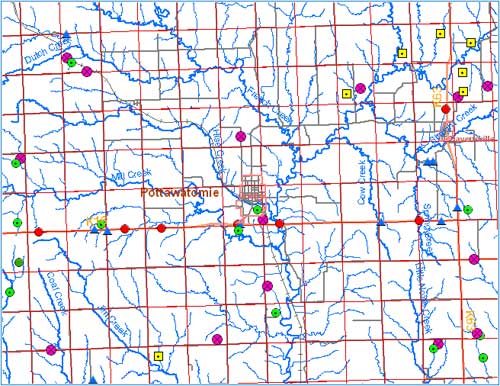
In the Table of Contents, if we check on PLSS, Highways, Roads, Railroads, Rivers and Streams, and Major Streams, and then click on "Update Map" box at the bottom of the Table of Contents, we should see an image similar to the one below. Note that clicking on the Update Map by itself doesn't increase or decrease the level of resolution. Each red square represents a township and range section and is usually about one square mile. Blue lines are waterways.
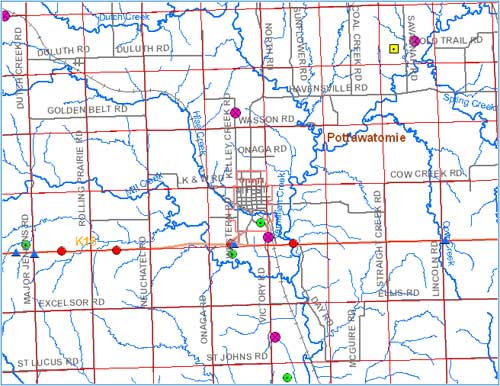
Clicking on the Onaga City area a fourth time (with zoom set at 1.5x) produces the image below. Note that the roads now are labeled with names. A fifth zoom (1.5x) will produce some street names within the Onaga town area itself.
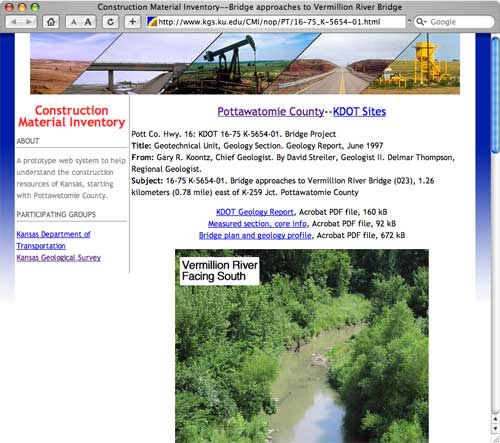
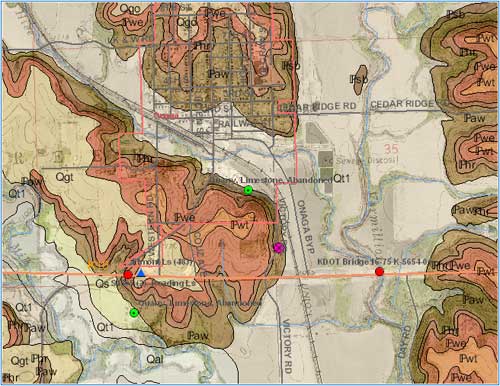
Identify Site Data: Most points in the interactive map represent sites that have additional data that can be accessed by choosing "Identify Site Data" and then clicking on the desired point. For example, in the image below, "KDOT Bridge 16-75-K5654-01" (black arrow) is clicked on. In a moment a dialogue box appears on the screen with basic site information. In addition, there is a link to "More Info" (red arrow) that takes a user to a web page pertinent to that site (2nd image).

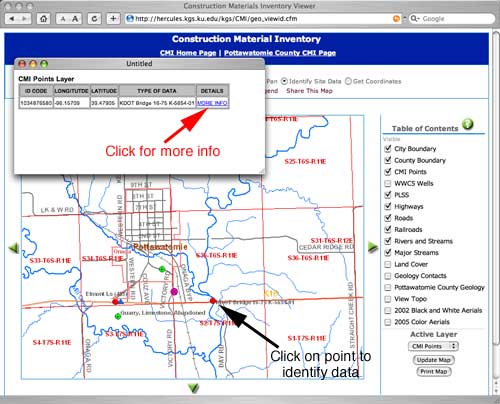
In this case, photos of the bridge, the original KDOT geology report, core data, and a bridge profile sheet are available.
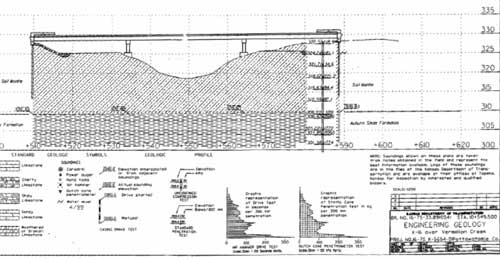
Example of a KDOT bridge project plan and profile sheet. These scans are available as Acrobat PDF files, and thus you can zoom in or out, pan, and print high-quality versions.
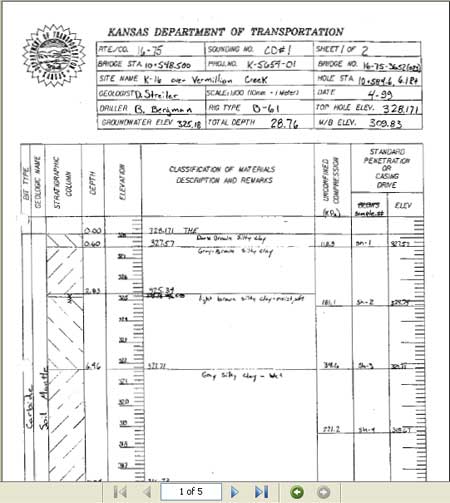
Example of a KDOT Core Sounding datasheet.
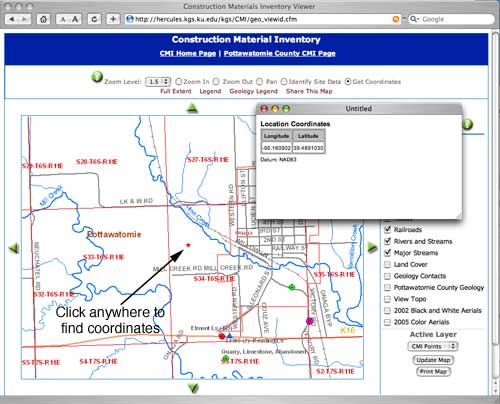
Get Coordinates: Want to know the longitude and latitude for a certain point? Choose "Get Coordinates" and click on any point in the interactive map and a red star (see arrow in image below) will appear on your chosen spot along with a dialogue box on your screen with the UTM coordinates.
Full Extent: Lost in the interactive map? Want to return to the default setting? Just click once on "Full Extent" and the interactive map will return to viewing the entire county, with all overlays reset to their original starting point.
Legend: Contains an explanation of the interactive map symbols, and is also somewhat interactive; its contents will vary with which "Active Layer" is chosen, CMI Points or WWC5. You may need to click and drag on the legend borders to see all of the legend contents.
Geology Legend: Contains the current KGS geological map symbology, color identification, and stratigraphic nomenclature.
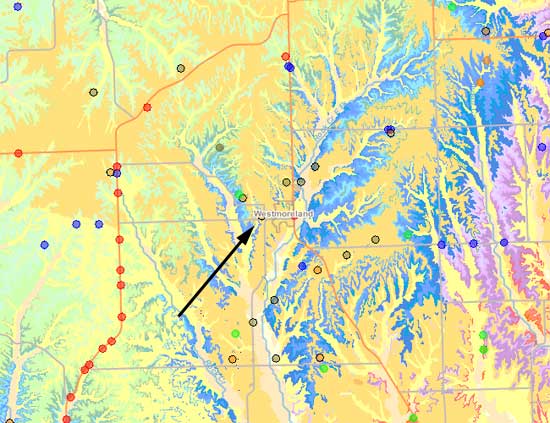
Pan Feature. In the image below, if you wanted to go to the Westmoreland area visible in the upper left hand corner (black arrow), chose the "Pan" button, and then click once on or near Westmoreland.
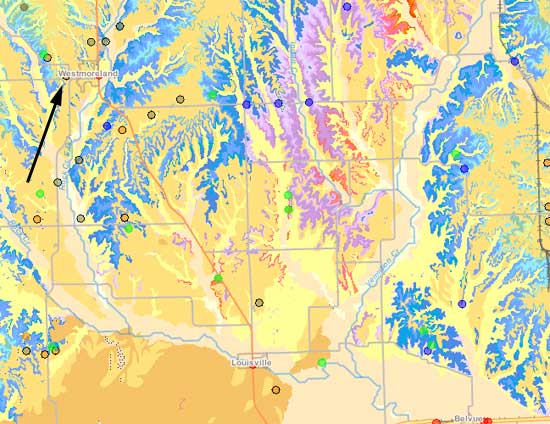
The interactive map will now realign and show Westmoreland in the center of the interactive map feature (see below). The level of resolution will remain constant while pan is selected (no zooming).
The up, down, left, right green directional arrows along the sides of the interactive map feature will also move the map in the indicated direction, without zooming.

Share This Map: Allows a person to turn what is currently being viewed on the interactive map into a website link that can be sent via an email. A website link/address to the image can be accessed by the email recipient.

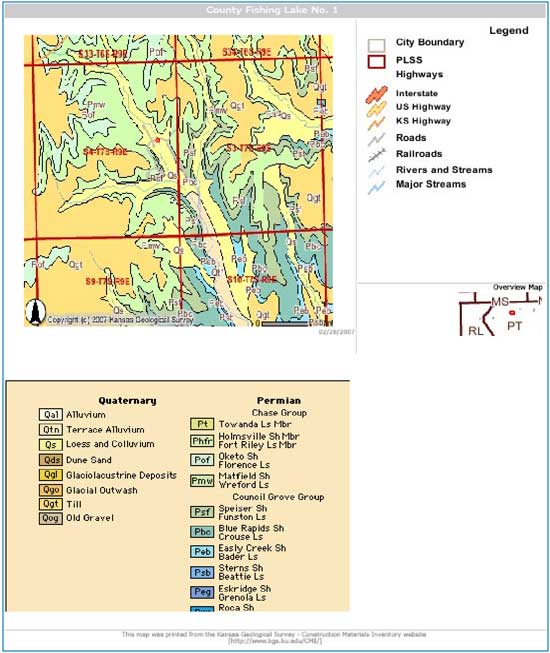
Underneath the Update Map button is the Print Map feature that will allow you to capture the current image on the screen and create a document where options for titles, north arrows, legends, overview maps, and the original image can be displayed on a single page for printing or electronic transmission. An example is shown below at reduced size.
Part II--GIS Overlays
The Table of Contents on the right-hand side of the interactive map lists GIS overlays that can turned on and off. Simply click in the box beside the overlay to add or remove the green checkmarks and press "Update Map" at the bottom to refresh. Note: some overlay features will only be active once a certain level of resolution, or zooming in, is achieved. For example, in the Table of Contents image below, features like city boundaries and county geology can be activated while at "Full Extent," while roads, rivers and streams, land cover, aerial photos, and topographical overlays require some zooming in first. Please note that the City Boundary, County Boundary, and CMI Points features are defaulted to be checked on when the interactive map is first accessed.
In addition, while both Geology Contacts and Pottawatomie County Geology can be checked on while at "Full Extent," activating Geology Contacts at this level of resolution will tend to produce a distorted black and brown image of little use. To effectively see the geological relationships at the County level, use Pottawatomie County Geology overlay only. Generally, to see a relatively coherent image, you must zoom in at least 3 times (with zoom set at 1.5x) before activating both Geology Contacts and Pottawatomie County Geology overlays, although this rule of thumb depends on the user's purpose.
The Table of Contents image below shows all overlays and features activated. Generally, aerial photos and topological features will activate after only one click of "Zoom In" set at 1.5x. Roads, rivers and streams, and land cover will activate after 3 clicks of "Zoom In" set at 1.5x. This aspect is demonstrated in more detail later on.
Highways, Roads, Railroads are self-explanatory as overlays.
PLSS stands for Public Land Survey System, and uses the Township, Range, and Section organization. See the example in Zoom Level, Part I.
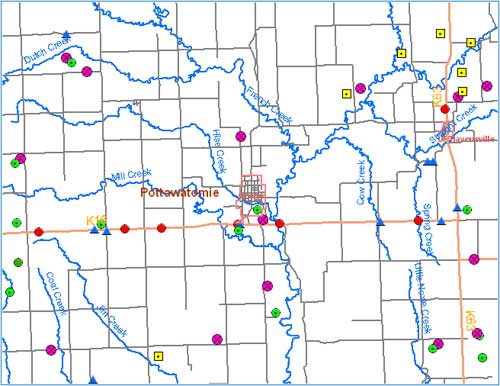
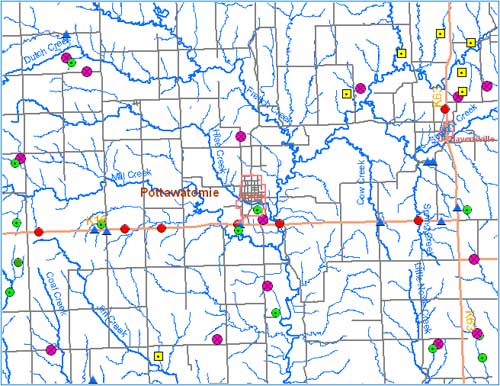
The Major Streams overlay can be turned on while the interactive map is at full-extent and so a county-wide view of the largest rivers and streams can be seen. However, the names of the streams will not activate until the map is zoomed in twice at 1.5x zoom level. The Rivers and Streams overlay is intended for higher resolution viewing and will not be available until the interactive map is zoomed in about 3 times at 1.5x zoom level. One disadvantage of the current Rivers and Streams overlay is that the streams are unnamed. When both water overlays are active, the Major Streams data will be seen as a blue line that is thicker than the Rivers and Streams data.
"Major Streams" Overlay
"Major Streams" and "River and Streams" Overlays
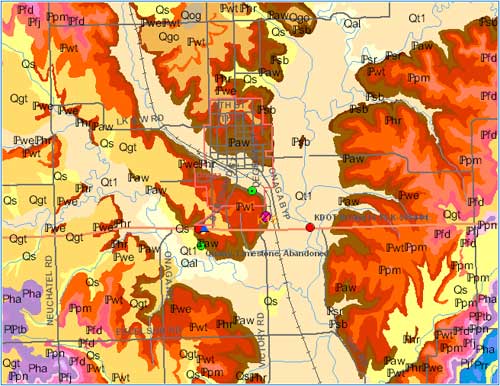
Pottawatomie County Geology Overlay. In the image below, we have set our zoom level to 3 and clicked twice on the city of Onaga. We have turned on Highways, Roads, Railroads, Rivers and Streams, and Pottawatomie County Geology overlays. "County Boundaries" is turned off, which means the term "Pottawatomie" won't clutter the map. Take note of the geology symbology now present (e.g. Qgt, Pha).
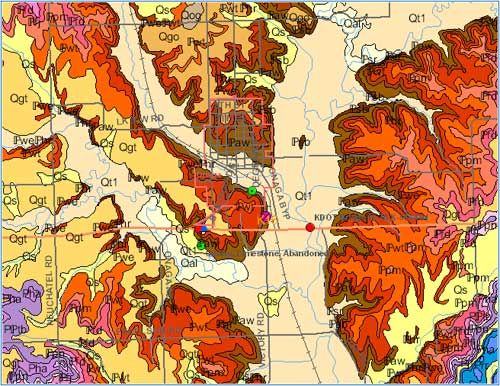
Checking on the Geology Contacts overlay and clicking "Update Map" will draw lines that sharpen the boundaries between geological units (as stated before, if you wish to view the geological relationships at a county-level or "Full Extent," leave the Geology Contacts overlay unchecked).
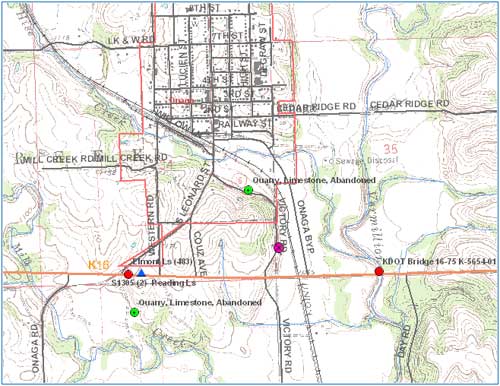
The View Topo option adds a layer containing scanned 7 1/2-minute topographic maps of the county.
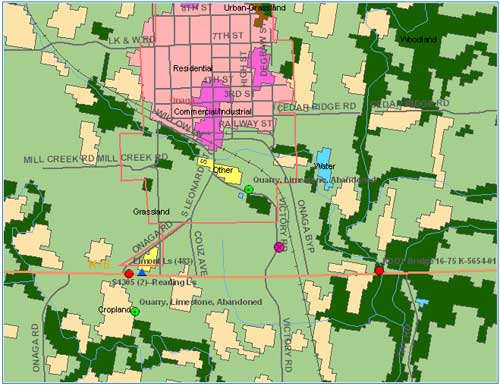
Land Cover overlay shows land classifications (cropland, woodland, etc.) The database depicts 10 general land cover classes for the State of Kansas.
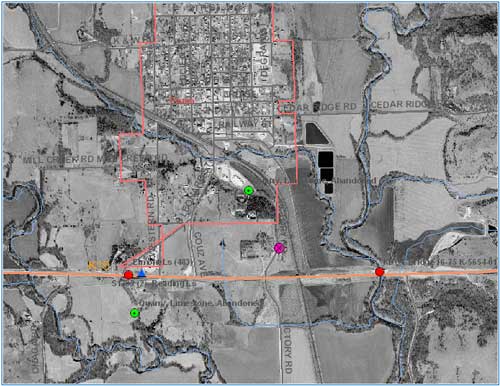
Two generations of aerial photos can be added. This is an example of the 2002 Black and White Aerial overlay.
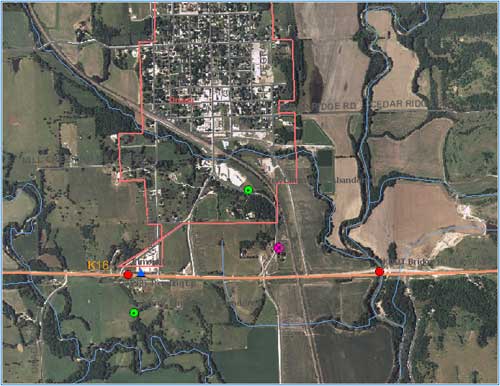
The 2005 Aerial Photos were taken in color.
An example of Geology, Topo, and Black and White Aerials overlays active. There are pre-defined levels of transparency to some layers so they can be used together.
Part III--Website Databases, Types of Information Available
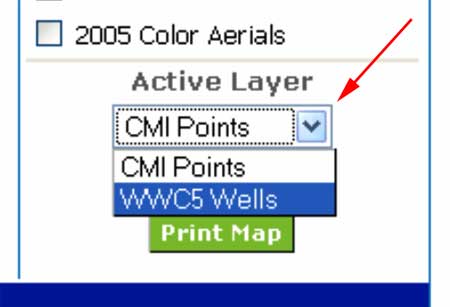
CMI Points and WWC5 Wells: These are two separate databases within the website. Both sets of points can have their respective boxes checked and can be seen on the interactive map at the same time, but you can only access the specific data at a particular point if that category is selected in the "Active Layer" menu and the "Update Map" has been clicked.
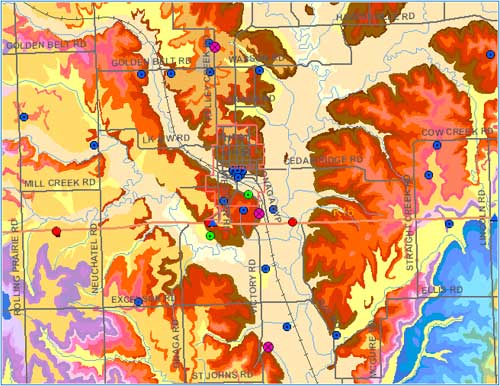
The WWC5 database only contains one category, the water wells (indicated by a blue octagon with a black dot in the center). In the image below, sites from both the CMI Points database and the WWC5 database are visible. The placement of the water well sites are generally accurate to three quarter-sections in the interactive map, as the sites are placed according to the location information given in the original documents.
To recap,
- Use the "Table of Contents" to overlay CMI data or WWC5 locations (or both) onto the interactive map;
- Use the "Identify Site Data" option on the toolbar if you want to click on points to retrieve data;
- Use the "Active Layer" menu to select whether WWC5 or CMI points will be selected when you click within the map.
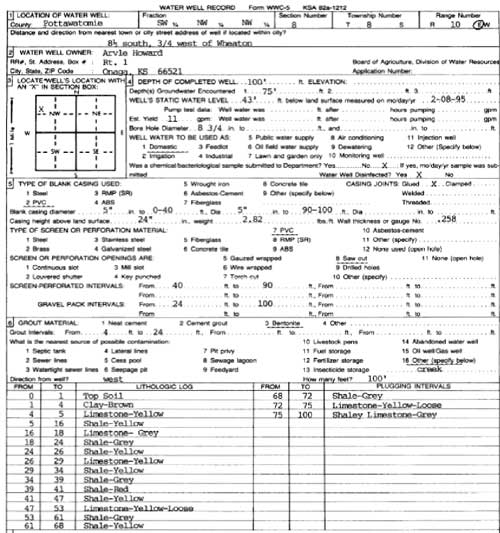
If "Identify Site Data" in the tool bar is selected, and one of the blue octogons is clicked on, then a web page for that site is created. Additional information regarding the lithology and unit thickness may be present in many, if not all, of the WWC5 records.
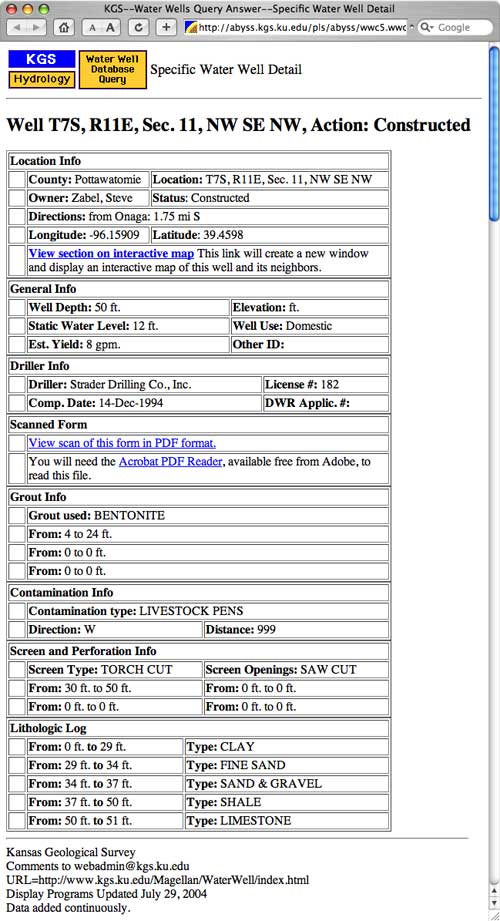
In most WWC5 records it should also be possible to view the original document in PDF format. At the bottom of the image below is the lithologic log, and it should be possible to see, in this particular well, that the first limestone ledge started at a depth of about 4 feet. In many cases, the WWC5 records should be able to give an indication of the overburden thickness and the depth to bedrock in the area.
The website default setting is to have the CMI Points active, not the WWC5 points. These points include the seven categories shown in the Legend feature:
KDOT Highway and Bridge Projects are mapped with a solid red circle. The types of detailed information available for these points was shown earlier.
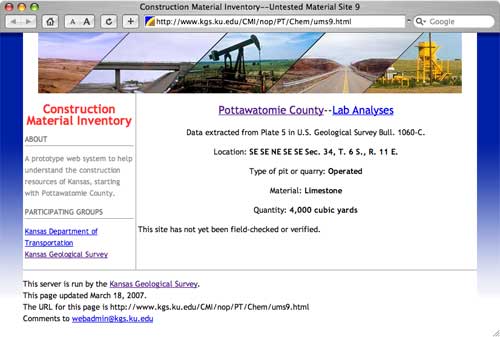
Material Analysis Sites are drawn from USGS 1060-C Publication, indicated with a pink circle with two crossed lines symbol, and consist of two types: Untested, with the primary information being a cubic yards estimate of material:
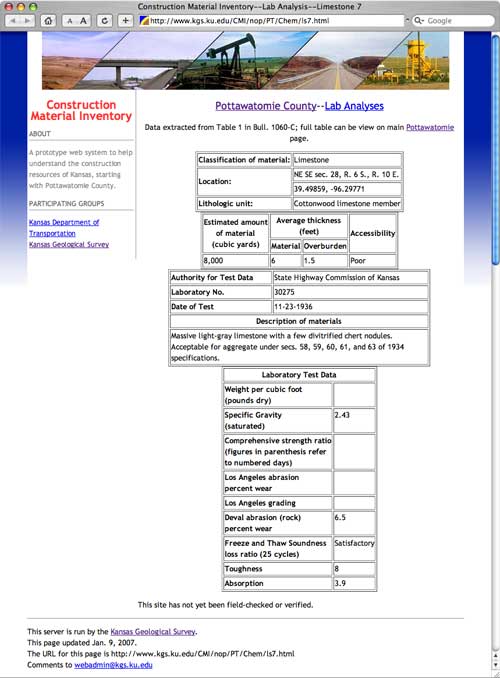
Tested samples from other points were fully analyzed, with various petrophysical indicators (specific gravity, absorption, soundness test results, etc.)
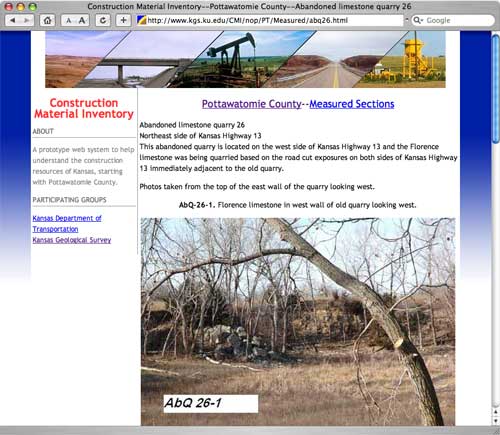
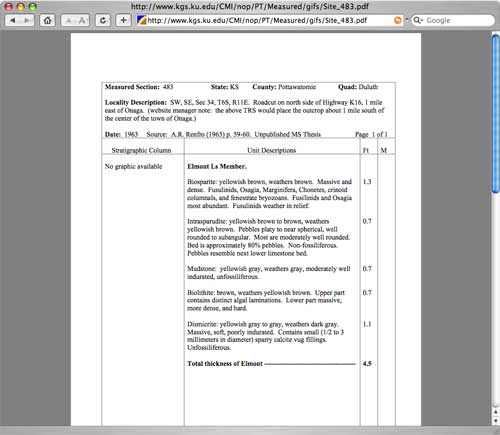
Measured Sections, Rock Exposures, Cores: Posted with a blue triangle symbol, measured sections generally contain one or more photos of the rock outcrop where a geological professional or a student measured and described a stratigraphic unit. Sometimes an Acrobat PDF of the measured section is available.
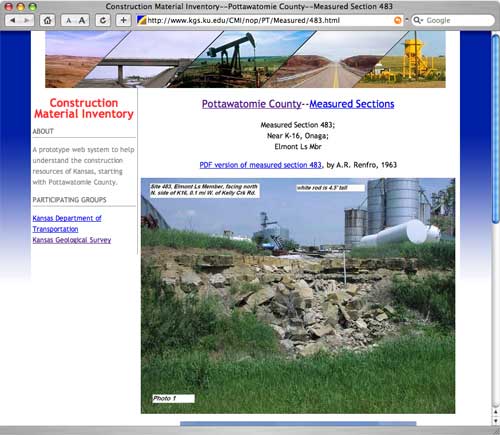
Example of one measured section by an author. In this case, the geological worker had a description only (no rock column graphic), and the description was placed in a standard format created for this website.
There also exists some information on the following commercial quarries:
- Active Limestone Quarries
- Inactive Limestone Quarries
- Active Sand and Gravel Quarries
- Inactive Sand and Gravel Quarries
For most of the above sites, only some very general information is available: A township, range, section and quarter for location, and occasionally the quarry operator or the stratigraphic unit involved.
In some cases, particularly the active quarries, a quarry site has been visited, photographed, and a more accurate gps coordinate taken. Geological units exposed in these areas have been examined and confirmed to be the originally identified unit. In many of the inactive quarry sites, evidence of their existence has vanished over time, and it is no longer possible to know with certainty where a site was located.