
|
|
HELP: Zonation Dialog |
Example LAS 3.0 File: Meyer 'B' 5
Download this file to your PC and read using the "Your PC" radio button on the Cluster Analysis Main Applet Panel. If are having trouble with loading this file into the program go to " Help: Loading Log ASCII Standard (LAS) File, versions 2.0 & 3.0."
You should see the following dialog displayed,
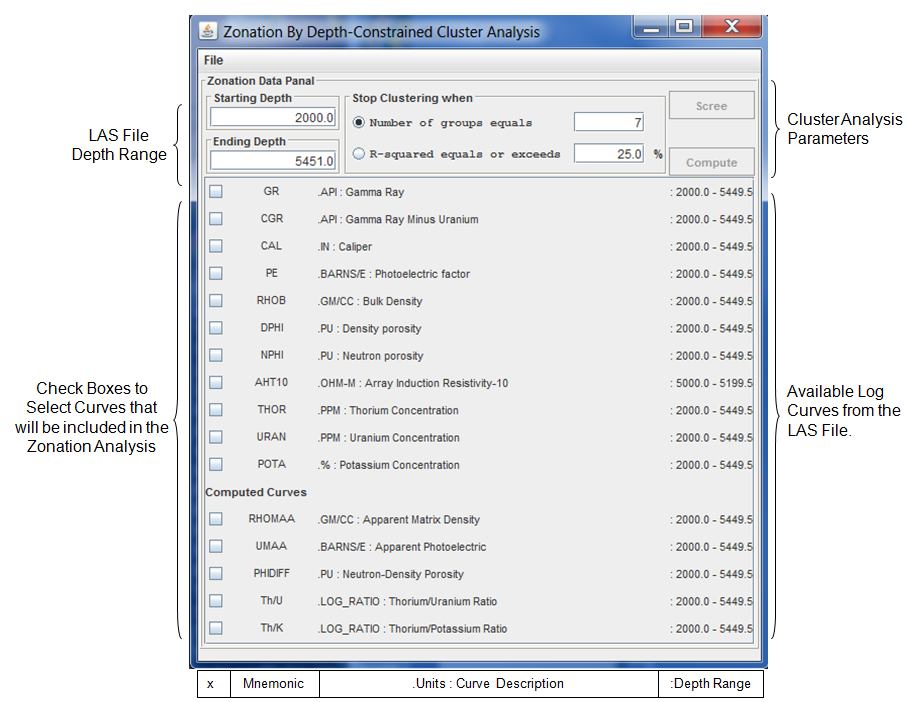
If you viewed the MeyerB5.las file you will notice that there are 3 log data sections. This program reads each log data section and combines the data into one data set. There were 3 Logs measured separately, but the LAS 3.0 file format allows that each seperate log is maintained by a separate data section within the file. The logs were downloaded from the KGS Web site and combined into one LAS 3.0 File. The orignal logs were a Neutron/Density/Photoelectric Factor Log, Spectral Gamma Ray Log and a partial Array induction log. If you noticed on the frame the log curves are listed together and only the Array induction (AHT10) log curve only has measurements from 5000 to 5199.5 feet, but the other curves go from 2000 to 5449.5 feet.
Note: This analysis will not process zones with LAS File Null values in the data. The Available log curves are presented in the Zonation dialog with the non Null value depth ranges of the individual curves. The program will turn off your curve selection if the depth range you select has a Null value. Try varying the depth by subtracting 5-10 feet on the end depth if you see the curves being deselected.
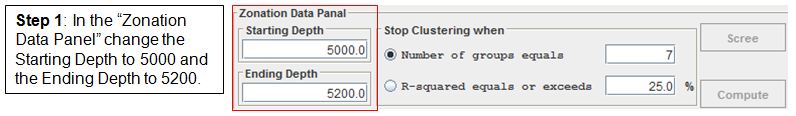
With this example first decide what depth range you wish to perform the depth constrained cluster analysis. Note: you can do the whole log, but if you select "R-squared equals or exeeds" radio button you will only get a maximum of 50 groups.
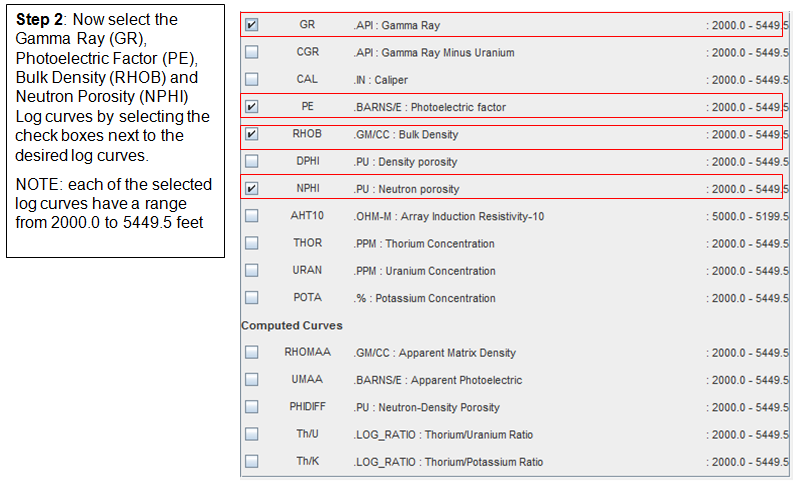
This depth range looks at the bottom of the Mississippian and Viola. You only need to select 1 curve to run the analysis, but combining multiple curves will give you better results. This example will combine the Gamma Ray (GR), Photoelectric Factor (PE), Bulk Density (RHOB) and the Neutron Porosity (NPHI) log curves for the cluster analysis.
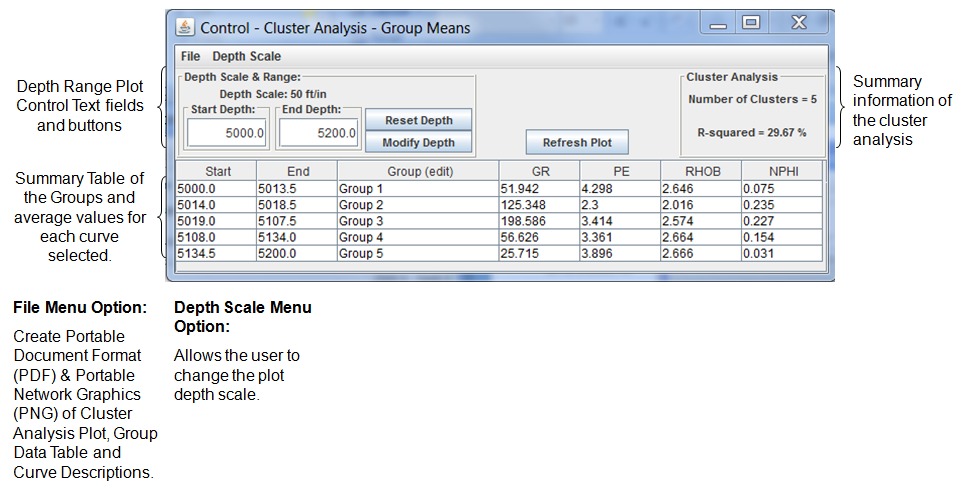
You now need to set the stopping criterion. The stopping criterion can be specified either in terms of the number of groups (clustering will stop when the number of groups has been reduced to the number specified) or in terms of R2 (clustering will stop when the R2 equals or exceeds the specified value).
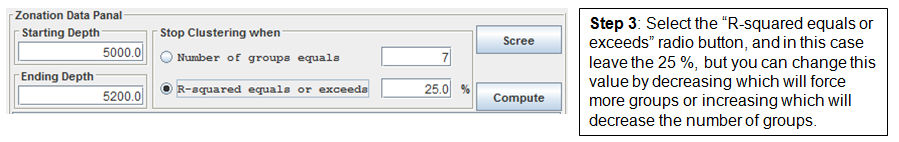
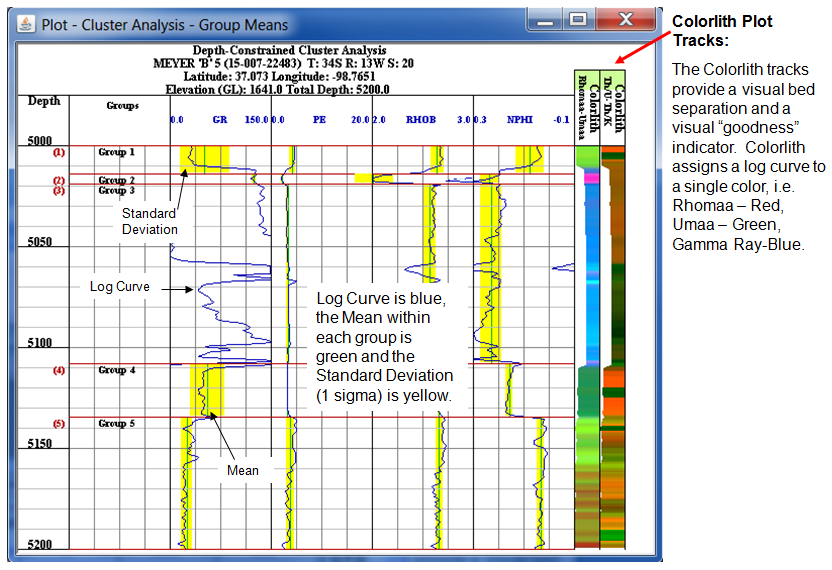
When the Compute button is selected in the Zonation Data Panel, this program will perform the cluster analysis. For the sake of the cluster analysis, each of the inpute variables is standardized to zero mean and unit variance. It is more than likely that the selected logs will be in incommensurate units and will thus differ greatly in magnitude. The standardization assures that each variable will be given approximately equal weight in the analysis. The analysis begins with each data point (zone) considered as a separate group (subinterval) and proceeds either until the stopping criterion is achieved. At that point the "Cluster Analysis - Group Means" Plot Dialog will be displayed with the results.
Author: John R. Victorine jvictor@kgs.ku.edu