
|
|
HELP: Select Cross Plot Icon Button Panel |
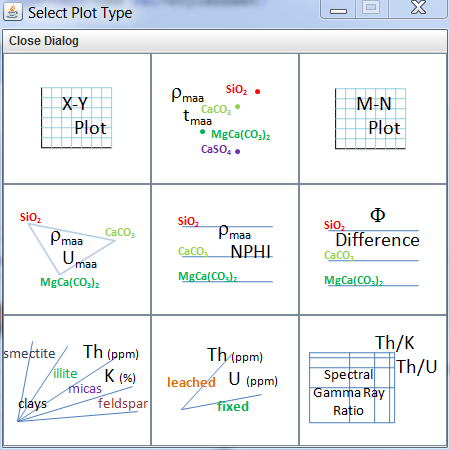
Cross Plot Selection Panel Icon Buttons |
||||||||||||||||||||||
| Select a icon button from the following list to view Example Plots. | ||||||||||||||||||||||
|---|---|---|---|---|---|---|---|---|---|---|---|---|---|---|---|---|---|---|---|---|---|---|
 |
User Define XY Cross Plot Log ASCII Standard (LAS) Log Data & Core Data This button allows the user to select what data they wish to plot, i.e. LAS Gamma Ray Log Curve versus Measured Whole Core Porosity Data. |
|||||||||||||||||||||
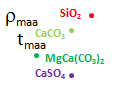 |
Rhomaa-Tmaa Cross Plot The following Log ASCII Standard (LAS) Log Data Curves must be present,
|
|||||||||||||||||||||
 |
MN Litho-Porosity Cross Plot The following Log ASCII Standard (LAS) Log Data Curves must be present,
|
|||||||||||||||||||||
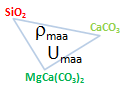 |
Rhomaa-Umaa Cross Plot The following Log ASCII Standard (LAS) Log Data Curves must be present,
|
|||||||||||||||||||||
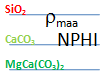 |
Rhomm-NPHI Cross Plot The following Log ASCII Standard (LAS) Log Data Curves must be present,
|
|||||||||||||||||||||
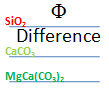 |
Porosity Difference Cross Plot The following Log ASCII Standard (LAS) Log Data Curves must be present,
|
|||||||||||||||||||||
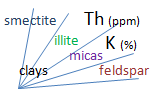 |
Thorium (Th) - Potassium (K) Cross Plot The following Log ASCII Standard (LAS) Log Data Curves must be present,
|
|||||||||||||||||||||
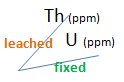 |
Thorium (Th) - Uranium (U) Cross Plot The following Log ASCII Standard (LAS) Log Data Curves must be present,
|
|||||||||||||||||||||
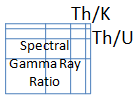 |
Spectral Gamma Ray Cross Plot The following Log ASCII Standard (LAS) Log Data Curves must be present,
|
|||||||||||||||||||||
Author: John R. Victorine jvictor@kgs.ku.edu