|
|
|
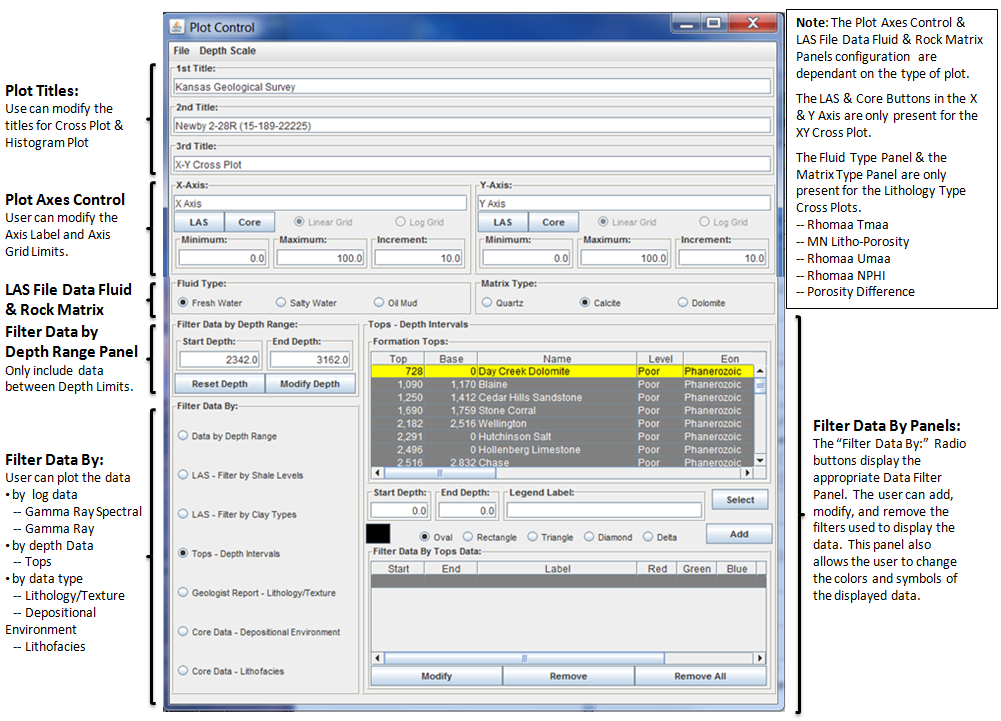
Filter Data By: |
Log Depth: |
|
Tops |
Tops Data - If the tops data is present the program will
automatically build a list the user can select from. As the
user selects the tops the program will automatically add the
log data to the Cross Plot, Histogram Plot and mark the colors
on the Profile Plot.
|
|
Geologist Report
(Rock Descriptions) |
Lithology/Texture is parsed from the description of the rock or core.
The program will automatically build a list the user can select from.
|
|
Depositional Environment |
Core Data - If the curve type Depositional Environment is present the program will
automatically build a list the user can select from. This LAS Log Data
will only be selected over the depth range the core data is present.
|
|
Lithofacies |
Core Data - If the curve type Lithofacies is present the program will
automatically build a list the user can select from. This LAS Log Data
will only be selected over the depth range the core data is present.
|
Log Data: |
|
Depth Range: |
The user can exclude data from the plots by setting the Starting Depth
and Ending Depth on the Cross Plot Control Panel. |
|
Shale Levels
(Gamma Ray API Levels) |
The program automatically separates the log data by Gamma Ray API Levels into
Shale Levels as follows,
| Name | Start API | End API |
|---|
| Clean Formation | 0 | 60 |
| Shaly Formation | 60 | 70 |
| Shale Formation | 70 | 100 |
| Hot Formation | 100 | 150 |
| Beyond Maximum | 150 | 500 |
|
|
Clay Minerals
(Th/K Ratio Levels) |
The program automatically separates the Th/K Ratio Levels into
Clay Minerals as follows,
| Mineral | Start | End |
|---|
| Potassium Evaporites | 0.0 | 0.5 |
| Feldspar | 0.5 | 0.8 |
| Glauconite | 0.8 | 1.33 |
| Micas | 1.33 | 2.0 |
| Illite | 2.0 | 3.5 |
| Smectite | 3.5 | 12.0 |
| Kaolinite | 12.0 | 28.0 |
Heavy Thorium
Bearing Minerals | 28.0 | 100.0 |
|