|
Plot Track Type Panel - Default Radio Button
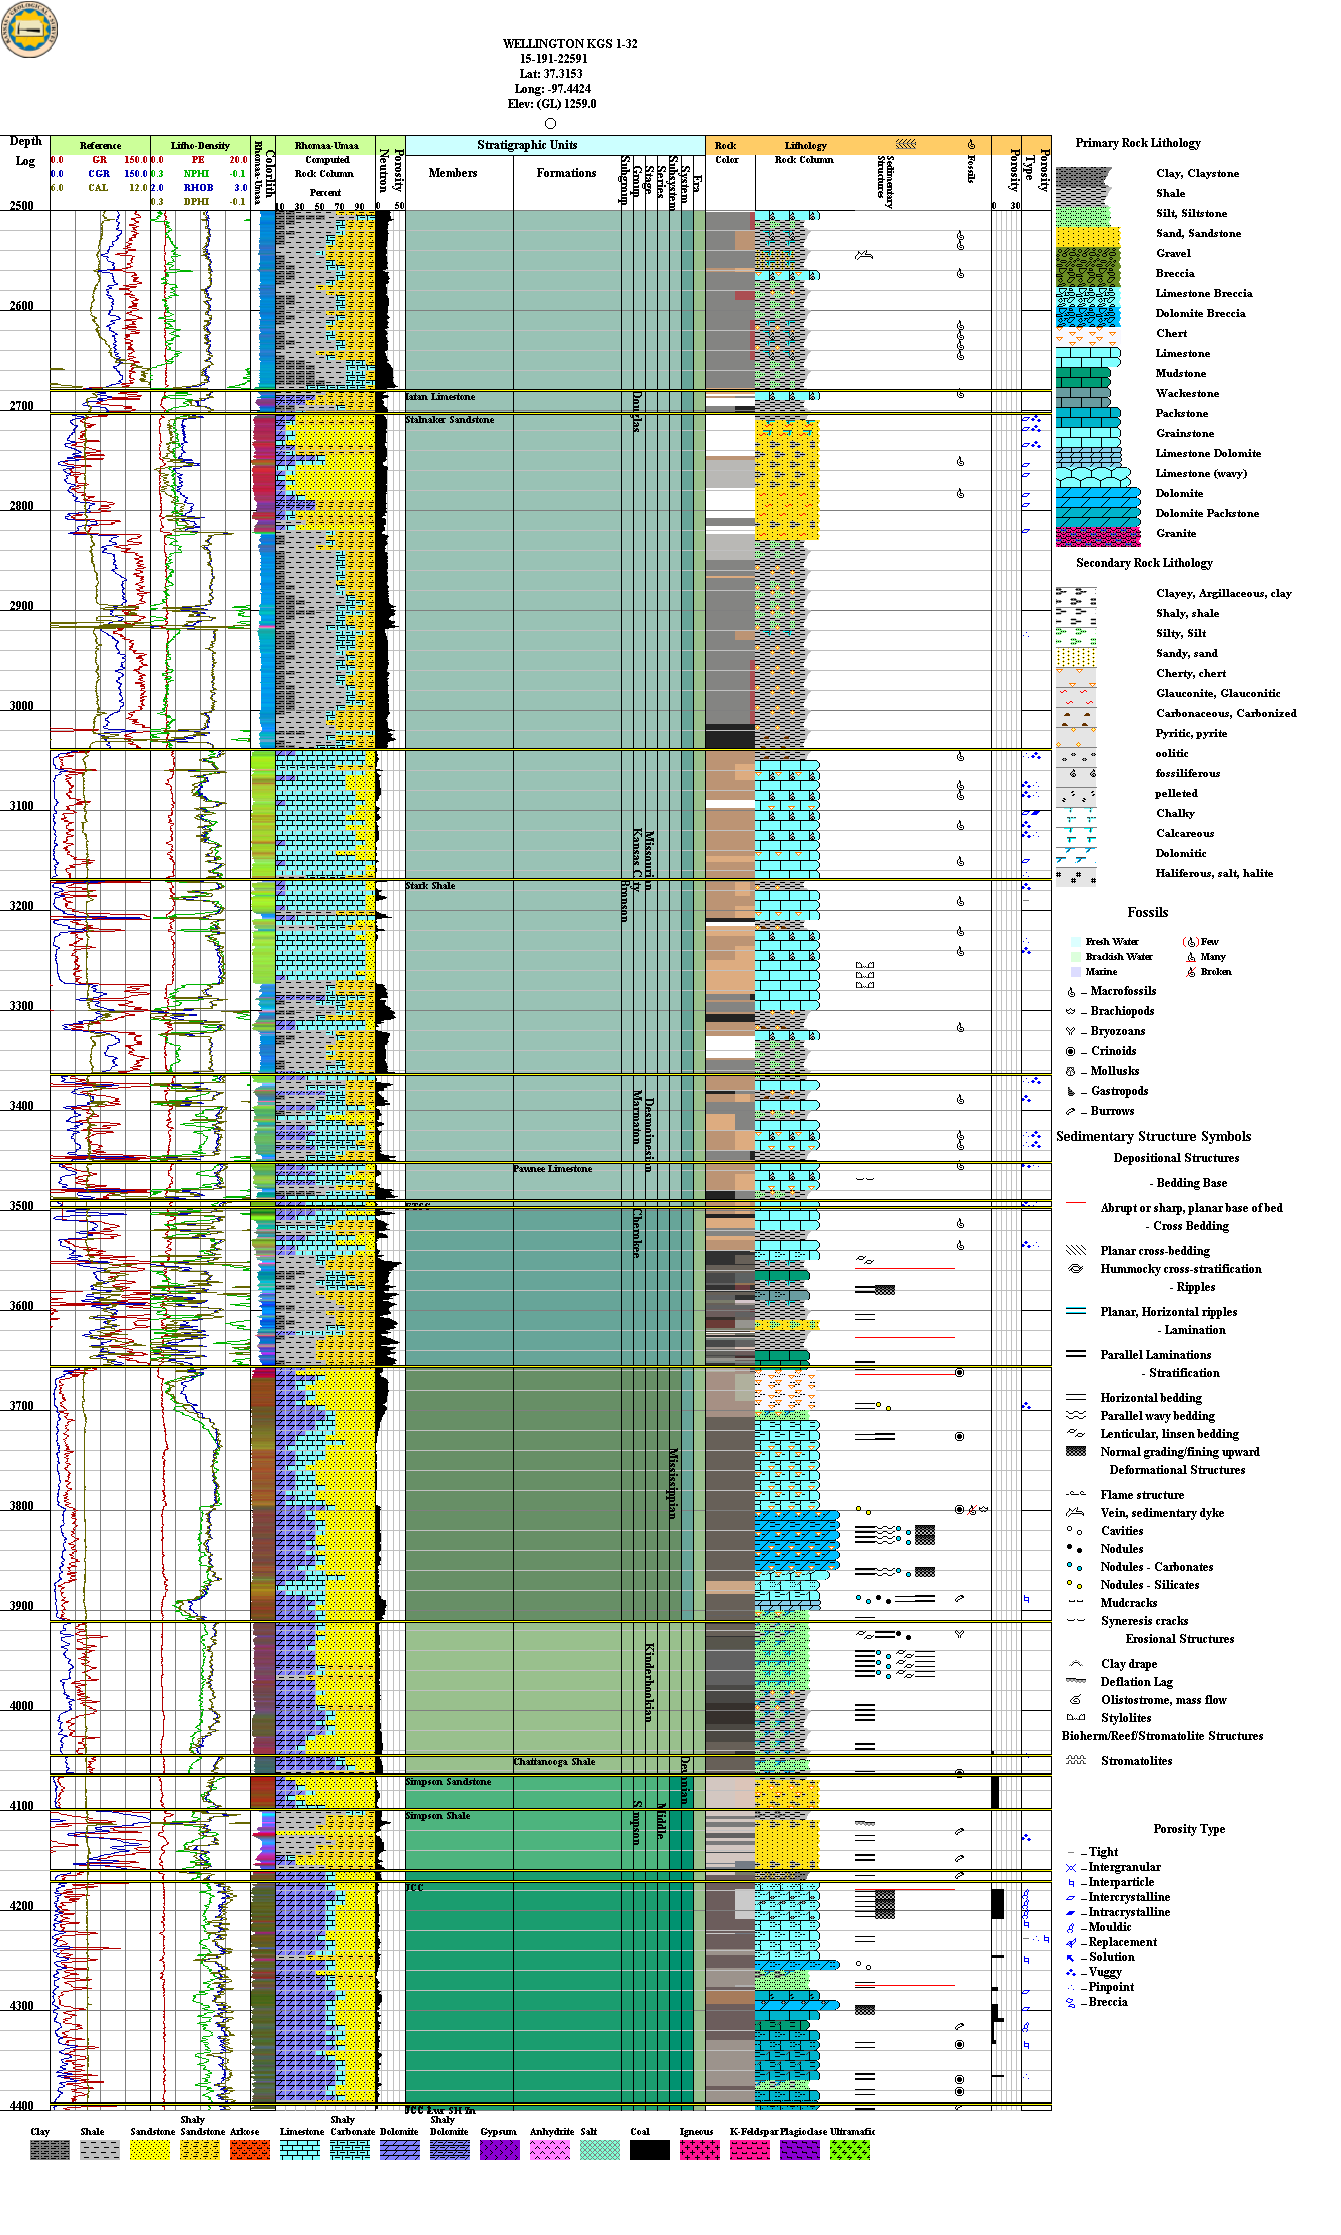
Digital LAS File Curve (Log) Data Tracks
- Lithology Color Track Gamma Ray Colorlith Colors by API Level
- Reference Log Track Gamma Ray (GR), Spontaneous Potential (SP), Caliper Logs (CAL) Logs
- Litho-Density Log Track Neutron Porosity (NPHI), Bulk Density (RHOB), Photoelectric Factor (PE) Logs
- Colorlith RGB Color Track This track mixes the RGB colors by log curve values as follows,
RED: Apparent Grain Density (Rhomaa)
GREEN: Apparent Photoelectric (Umaa)
BLUE: Gamma Ray (GR)
- Lithology Rock Composition Track Computes the "Mineral" Composition of the Rock Column by Apparent Grain Density (Rhomaa) , Apparent Photoelectric (Umaa) , Gamma Ray (GR) Logs
- Thin Porosity Track Neutron Porosity Histogram Plot
Horizons Track
- Stratigraphic Units (Tops) Plot Track
Rock Data Tracks
- Color - Rock RGB Values Convert the geologist color description
to a RGB Color value and an equivalent Munsell Color Value.
- Lithology Rock Column Create color symbols to represent
geologist description of the lithology of the rocks.
- Sedimentary Structures Draws image icons to represent
the geologist description of sedimentary structures.
- Fossils Draws image icons to represent
the geologist description of general fossils, i.e., trilobits, brachiopods, etc.
- Porosity Track Draws porosity histogram of the geologist description
of the porosity values, i.e., excellent, good, fair porosity, etc.
- Porosity Type Draws image icons to represent
the geologist description of porosity types.
|