This is the production plot & decline curve analysis web application, which allows the user to access production data from the Kansas Geological Survey (KGS) Database for Leases, Fields, Operators and Counties.
The Program allows the user to save the raw production data as an ASCII Extensible Markup Language (XML) file or as a comma-separated values (CSV) file. The Program allows the user to save the Production Plot Java Image to their PC as a Portable Network Graphics (PNG) Image, the Program will then display a web page with the image file with a link at the top of the page that will allow the user to launch the PDF Web Applet to convert the PNG Image File to a Portable Document Format (PDF) File.
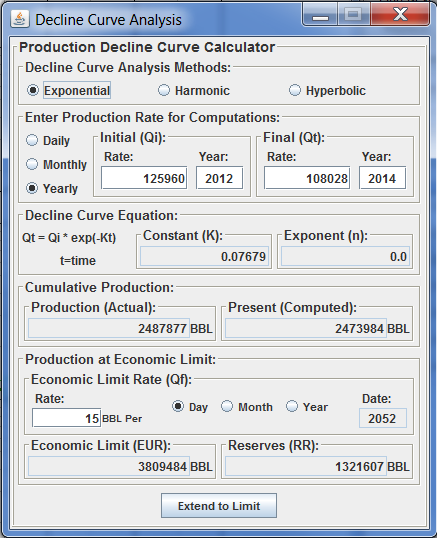
A decline curve analysis dialog was included to allow the user to predict the economic limit for a specific lease, field, operator and county. This analysis uses three methods for predicting the decline of a reservoir, exponential, harmonic and hyperbolic, see reference below.
|
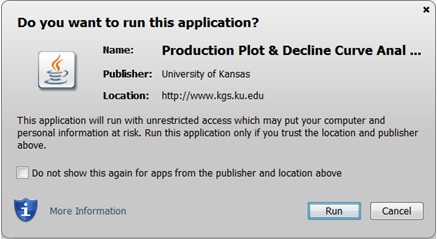
"Warning - Security" Dialog will appear. The program has to be able to read and write to the user’s PC and access the Kansas Geological Survey (KGS) Database and File Server, ORACLE requires this dialog. The program allows you to access the KGS Production Database for production data. The program does not use Cookies or any hidden software it allows the user to save ASCII files to their PC as well as the Production Plot as a Portable Network Graphics (PNG) image file. The blue shield on the warning dialog is a symbol that the Java web app is created by a trusted source, which is the University of Kansas. |
Production Plot Control Buttons |
 |
 |
Close the Production Plot. |
 |
Save the Production Data as a Comma-Separated Values (CSV) ASCII file. |
 |
Save the Production Data as a Extensible Markup Language (XML) ASCII file. |
 |
Save the Production Data as a Portable Network Graphics (PNG) image file, the Program will then display a web page with the image file with a link at the top of the page that will allow the user to launch the PDF Web Applet to convert the PNG Image File to a Portable Document Format (PDF) File. |
| Cumulative checkbox: | If the checkbox is selected the cumulative production data curve will be display, default is NOT selected. |
| Raw Production checkbox: | If the checkbox is selected the raw production data curve will be display, default is selected. |
| Montly Average checkbox: | If the checkbox is selected the monthly average production data curve will be display, default is selected. |
| Daily Average checkbox: | If the checkbox is selected the daily average production data curve will be display, default is NOT selected. |
| Number of Wells checkbox: | If the checkbox is selected the number of wells producing data curve will be display, default is NOT selected. |
| Decline Curve checkbox: | If the checkbox is selected the decline curve will be display,
default is NOT selected. When the checkbox is selected the web app will
displays the Decline Curve Analysis frame. Help on this dialog appears below click on the arrow buttons to display help page. |
Decline Curve Analysis Calculator Frame | |||||||||||||||||||||||
|
 | ||||||||||||||||||||||
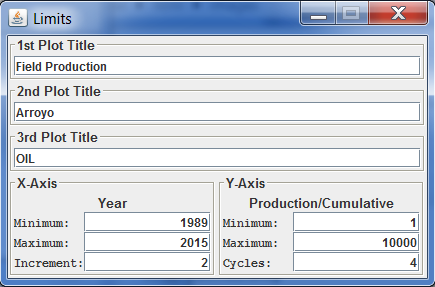
| Modify Limits button: | This button will display the "Limits" dialog, which will allow the user
to change the plot limits as well as the titles on the plot. Help on this dialog appears below click on the arrow buttons to display help page. |
Production Plot Titles and XY-Axes Frame | ||||||||||||||||||||||
|
 | |||||||||||||||||||||
The OIL & GAS radio buttons allow the user to switch between the different products. If either OIL or GAS is not present then only the radio button of the product that is present will be displayed.
