
|
|
HELP: PfEFFER-java |
 |
The Zonation icon button  launches a depth-constrained multivariate cluster
analysis which segments the entire depth interval based on user-specified set of logs. A hierarchical
cluster is used to produce subintervals that are as homogeneous as possible and distinct as possible from
each other, in terms of their log characteristics. The software employs Ward's method which, at each step
of the clustering process, joins the two groups (subintervals) whose merger produces the least possible
increase in the total within-groups sum-of-squars. The sum-of-squares for a single group, k, is given by
launches a depth-constrained multivariate cluster
analysis which segments the entire depth interval based on user-specified set of logs. A hierarchical
cluster is used to produce subintervals that are as homogeneous as possible and distinct as possible from
each other, in terms of their log characteristics. The software employs Ward's method which, at each step
of the clustering process, joins the two groups (subintervals) whose merger produces the least possible
increase in the total within-groups sum-of-squars. The sum-of-squares for a single group, k, is given by
nk
Wk = ∑ ||xi - x‾k||2
i=1
where ||xi - x‾k||2 is the squared distance between the vector of the log values for data point i, xi, and the vector mean for group k xk. The within-groups sum-of-squares increases equals the total sum-of-squares, T, given by the sum of the squared distances from all the data points to the global mean. At any step in the process, the relative amount of variation "explained" by the grouping can be measured by the value R2 = W/T. R2 increases with every merger and equals 100% when all the data points are joined in a single group.
The depth-constrained cluster analysis implemented in PfEFFER only allows vertically adjacent groups (subintervals) to be joined, greatly reducing the amount of computation relative to a more general cluster analysis, which would allow the posssibility of joining any possible pair of groups at each step. The depth- constrained cluster analysis always produces a sequence of group memberships, represented as integers, beginning with 1 at the top of the interval and proceeding sequentially downward.
The "Zonation By Depth-Constrained Cluster Analysis" Dialog will display. The depth range panel initially displays the depth range of the log data. The user must set the Starting Depth and Ending Depth within the selected Log Curves or the the log curves will be dropped when you select the "Compute" Button.
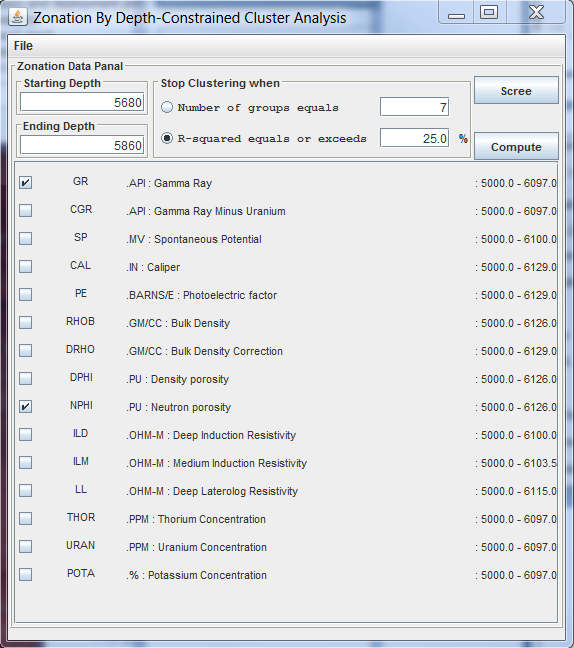
The stopping criterion can be specified either in terms of the number of groups (clustering will stop when the number of groups has be reduced to the number specified) or in terms of R2 (clustering will stop when the R2 equals or exceeds the specified value).
In the above example the Gamma Ray log curve and the Neutron Porosity log curve are selected. The Starting Depth will be from 5680 to the Ending Depth 5860. NOTE: The depth range must be within the depth range of all curves selected, i.e., Gamma Ray log curve is from 5000.0 to 6097.0 and Neutron porosity log curve is between 5000.0 to 6126.0. Select the "R-squared equals or exceeds" radio button and 25.0% will be used to compute the clusters. Now select the "Compute" Button. The Control & Plot - Cluster Analysis - Group Means" Dialogs will display
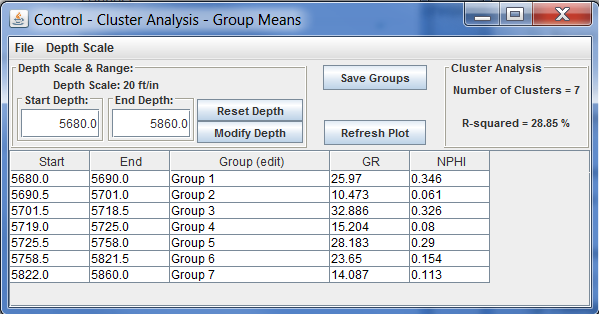
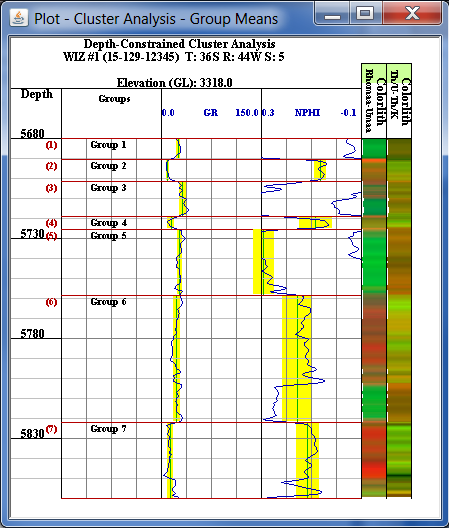
The table in the Control dialog displays the Groups and their depth ranges as well as the mean value for each log curve for each group. To Transfer the groups to the PfEFFER Spreadsheet select the "Save Groups" button on the "Control - Cluster Analysis - Group Means" Dialog and the created flow units will be transferred to the PfEFFER Dialog and automatically loaded.

Next Section PfEFFER File Organization
REFERENCE:
Pfeffer Version 2.0/Pro (Petrofacies Evaluation of Formations for Engineering Reservoirs) Manual,
Zonation By Depth-Constrained Cluster Analysis Section, Pages 141-144