
HELP: Digitizer Control & Plot Dialogs

|
|
HELP: Digitizer Control & Plot Dialogs |
|
The Digitizer was set up as a 6 step process. The following web pages will walk the
user through each step to load a Electric Well Log Plot into the digitizer dialog.
To set the data capture areas and to digitize and normalize the log curve data.
Note: The Electric Well Log Plot must be a PNG (Portable Network Graphics),
JPEG (Joint Photographic Experts Group) or GIF (Graphics Interchange Format) image file.
| Select a button from the following list to view Help pages. | ||
|---|---|---|
 |
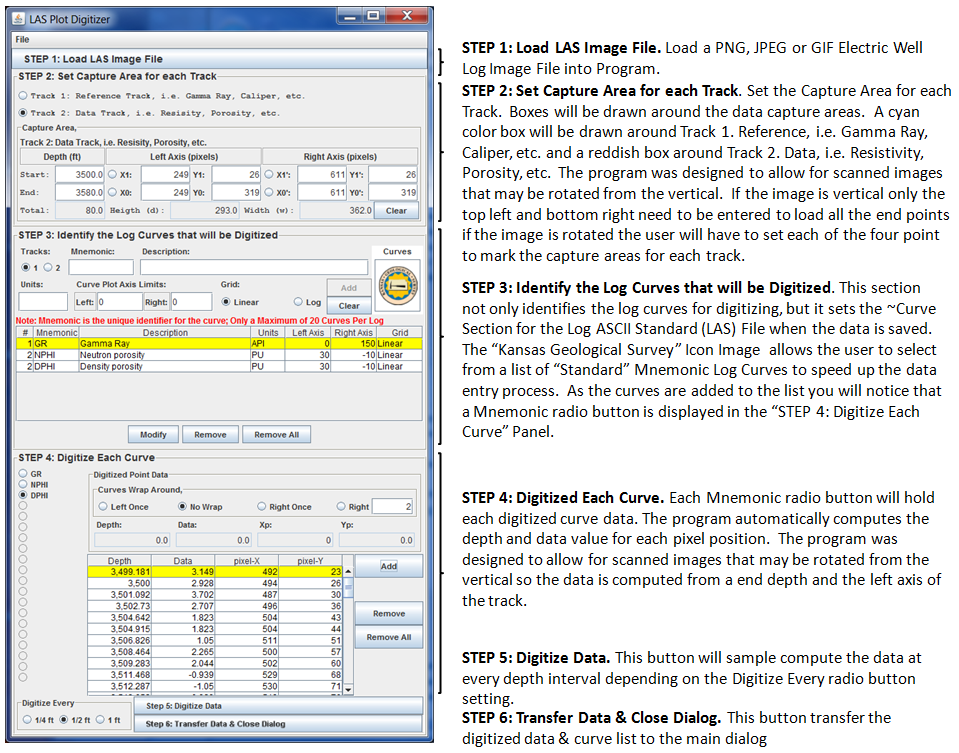
Step 1: Load LAS Image File. This button allows the user
to import a Scanned Electric Well Log Image File into the Digitizer. NOTE: Must be a PNG (Portable Network Graphics), JPEG (Joint Photographic Experts Group) or GIF (Graphics Interchange Format) image file. |
|
|
|
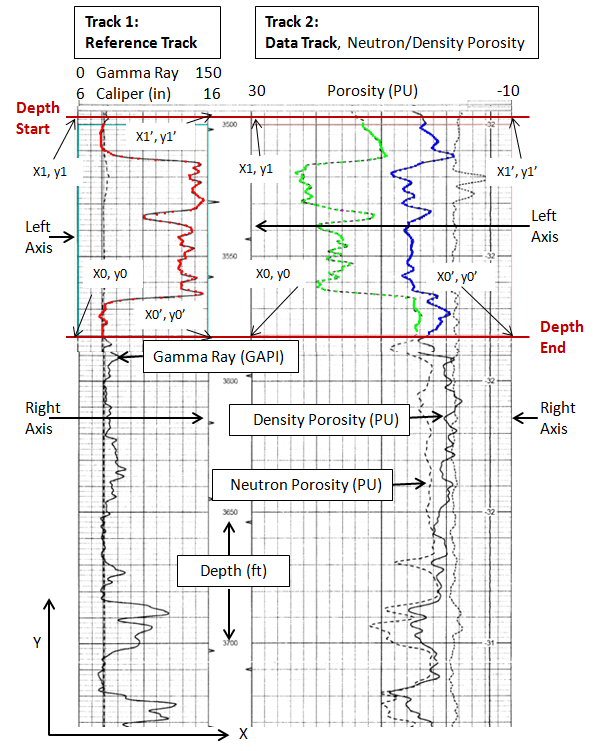
Step 2: Set Capture Area for each Track - This section sets the capture area for each track. The depth and data value of each curve within each track is computed from the end depth and the left axis of the track no matter how the image is oriented. The program was designed to digitize a standard log, but if the log is rotated slightly the program was designed to rotate the data position automatically depending on the four points that outline the capture area of the track. | |
|
|
Step 2: Set Capture Area for each Track - plot is rotated - This section sets the capture area for each track. The depth and data value of each curve within each track is computed from the end depth and the left axis of the track no matter how the image is oriented. The program was designed to digitize a standard log, but if the log is rotated slightly the program was designed to rotate the data position automatically depending on the four points that outline the capture area of the track. | |
|
|
Step 3: Identify the Log Curves that will be Digitized -
This step allows the user to build the ~Curves Section in the Log ASCII Standard (LAS) file
when the data is saved, but it allocates space for each data curve that is going to be digitized. NOTE the digitizer can only hold up to 20 curves at one time. |
|
|
|
Step 4: Digitize Each Curve - This step allows the user to digitize each log curve into the program. | |
|
|
Step 5: Digitize Data - Digitize Data at specific step values. The default is every 1/2 foot. | |
| Step 6: Transfer Data & Close Dialog - This is the last step that moves the data from the digitizer dialog to the Main Dialog. | ||
|
|
Data Wrapping Around Axis - Step-by-step using the digitizer to capture data that has wrapped around the axis. This example covers the Gamma Ray Log (wrapping to the right) and the Neutron Porosity Log (wrapping to the left). | |
Author: John R. Victorine jvictor@kgs.ku.edu