Kansas Geological Survey, Open-file Report 2002-51
by
Ricardo A. Olea and Robert J. Sampson
KGS Open File Report 2002-51
May 2003
Technological development of multiple sensors has allowed geologists to make observations where human sight is not possible, whether on distant planets or at the bottom of oceans. One form of such remote sensing is wireline logging, which captures variations in physical properties in the proximity of boreholes. The knowledge gained by well logging, as important and accurate as it may be, has the serious disadvantage of characterizing only a minute portion of the entire volume of interest.
Until the 1920s, stratigraphy was established based on direct observation of rocks along outcrops, quarries, and mine pits, or from cores and cuttings from boreholes. In 1927, brothers Conrad and Marcel Schlumberger, with aid of Conrad's son-in-law Henri Doll, successfully extended electric surface measurements to boreholes. Surface measurements of electrical resistivity had been used since the turn of the century as an indirect method to provide physical and geometrical information about the subsurface. On September 5, 1927, a prototype resistivity sonde was unloaded into a well in northeast France. The device was lowered to the bottom of the hole and resistivity measurements were made at one-meter intervals and the values written down on a pad together with the depth readings. In Paris, the measurements were plotted by hand against depth on a strip of paper, resulting in the first graph that today we call wireline or borehole log (Allaud and Martin, 1977; Schlumberger, 1982). Since then, continuous improvements and diversity in logging tools, better understanding of the physics of the measurements, and reduction in operation costs have resulted in logs being favored over conventional coring as the primary source of information to establish what is in the immediate vicinity of boreholes.
The technique referred to as well-log correlation developed from the need to interpolate between well logs for the inference of rock properties between boreholes. Interpolations have been more meaningful and more successful in sedimentary rocks because sedimentation commonly produces deposits that have good to excellent lateral continuity.
Lithostratigraphic correlation
Lithostratigraphic correlation is the correct determination of spatial equivalence of rocks based on their physical properties (Krumbein and Sloss, 1963, p. 332; Gradstein et al., 1985, p. 387; Jackson, 1997, p. 372).
In practice, the solution of the general problem of lithostratigraphic correlation is extremely dependent on the nature of available data. Here we limit our discussion to the special case common to petroleum prospecting and production wherein the primary source of information about the subsurface is wireline logs measured in vertical boreholes. The problem can be reduced to: Given an interval A as indicated on a log from well X, where is the same interval A on a log taken from a neighboring well Y? The cross section in Figure 1.1 is a typical display of lithostratigraphic correlations based on wireline logs and illustrates the manner in which the question is answered. The correlations shown in Figure 1.1 could have been determined manually and the cross section drawn by hand, the method traditionally employed by petroleum geologists, but instead it was generated by the program described in this manual.
Figure 1.1. North-south lithostratigraphic cross section in Clark County, Kansas, showing carbonate and shale formations from the Upper Pennsylvanian. The vertical scale is in feet below sea level and the horizontal scale is given by the graphical scale, which involves a vertical exaggeration of 125 times.
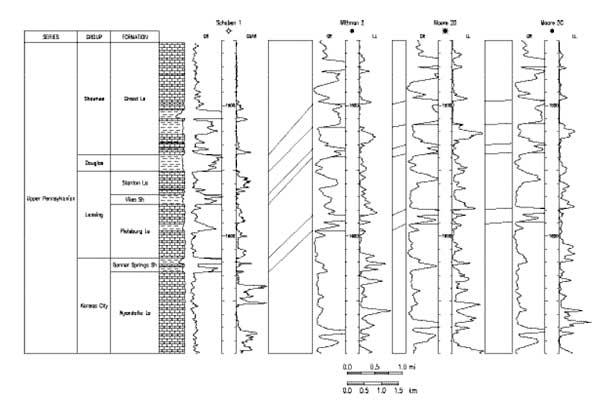
Lithostratigraphic correlation, like the solution to a puzzle, is either right or wrong. There may be an infinite number of incorrect correlations, but the correct solution is unique. Unfortunately, given some data, there is no independent way to check the validity of correlations, so rather than a single, unambiguous lithostratigraphic correlation, many feasible correlations may exist that do not violate general stratigraphic principles and constraints. It is a well know fact among geologists that every time a non-trivial correlation problem is submitted to the consideration of several colleagues, there are almost as many different answers as participants in the comparative interpretation. Disregarding severe tectonic disruption, for example, a golden rule is that the order of succession of units cannot be reversed from one well or outcrop to another (Tipper, 1988; Doyle et al., 2001, p. 11-18).
CORRELATOR
The possibility that wireline-log correlation could be reduced to a routine and the routine expressed as an algorithm has fascinated many researchers, the authors included. As a bare minimum, the challenge has the appeal to bring consistency and efficiency to the lithostratigraphic correlation problem.
This publication describes the capabilities of CORRELATOR, a computer system developed at the Kansas Geological Survey, for the determination of lithostratigraphic correlations under the practical circumstances found in the oil patch. CORRELATOR is not a prototype system. The program has been tested successfully in both carbonate and clastic sequences, in rocks of Paleozoic (Olea and Guy, 2000), Mesozoic (Olea, 1996; Olea and Bohling, 1996), Tertiary (Olea et al., 1985; Olea, 1989a and 1994b) and Quaternary age (Harff et al. 1999). Studies have been conducted using wireline logs from Alaska (Olea 1990), Illinois (Olea, 1991), Kansas (Olea et al., 1997; Watney et al. 1999; Olea, 2002a and 2002b; Olea et al., 2002), Louisiana (Olea et al. 1985; Olea and Davis, 1986; Olea, 1993 and 1994b), North Dakota (Gerhard et al. 1995), and Texas (Olea, 1989b) in the United States; from Chile (Olea, 1988b) in South America; and from the North Sea (Olea, 1988c) and the Baltic Sea (Harff et al., 2001) in Europe. Thickest section analyzed was 8,000 ft (2,400 m) thick (Olea et al., 1997), some cross sections have comprised 21 wells (Watney et al. 1999; Olea, 2002a and 2002b), and wells have been up to 18 miles (29 km) apart (Olea et al., 1997). Stratigraphic correlations equivalent or better than those produced manually by experienced geologists have been found even in the presence of unconformities, faults, facies changes, and significant lateral variation in thickness.
CORRELATOR can prepare more sophisticated cross sections than the one in Figure 1.1. At its highest potential, the program can yield cross sections like the one in Figure 1.2 simultaneously displaying the architecture and lithology of the subsurface, a difficult and impractical task to attempt by hand.
Some remarks in connection with Figure 1.2 are:
Figure 1.2. Cross section from Gove to Ness counties, Kansas, that focuses on the rendition of the Permian groups. The vertical scale is in feet relative to sea level with a vertical exaggeration of 500 times. This display is a partial rendition of a cross section extending for 201 mi (323 km) (Olea, 2002a).
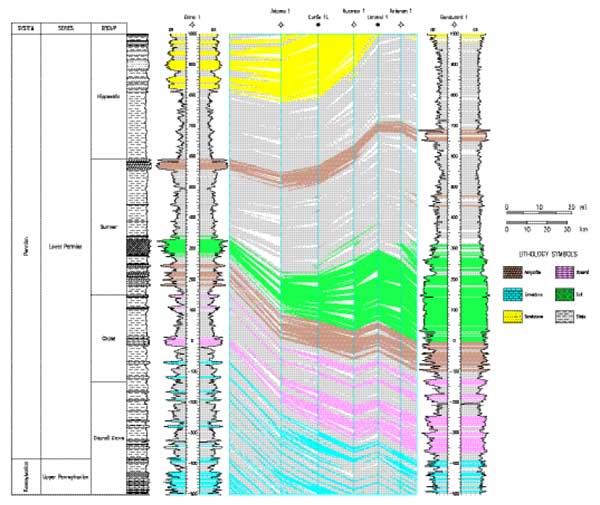
An additional feature of CORRELATOR that does not follow from the inspection of Figure 1.2 is the systematic scrutiny of correlations. All correlations between pairs of wells can be analyzed with an expert system to check for inconsistencies within each collection of correlations from well to well. Besides, if the cross section is arranged in a closed loop, the program generates closing errors, which are extraordinary useful to check the global consistency of the correlations.
CORRELATOR was developed in a Unix environment. With the exception of one routine in C, the program comprises 424 routines coded following the ANSI standard of Fortran 77 as closely as possible. Development of the software has been going on sporadically since the mid-1980s, when some of the languages that are popular today had not made a heading yet. Fortran continues to be used widely, remaining the most common programming language in the earth sciences, providing an important reason to set low priority to efforts to translate the code relative to requirements to process situations of practical interest and production of meaningful displays with accuracy and adequate formatting. The graphical routines in the interactive part of CORRELATOR restrict its application to an X Windows environment. Files for the display of final cross sections may be coded in PostScript, a highly portable code.
The program was extensively tested so that the same code runs both on Sun workstations and PCs with slightly different make files only. Main tests were run on a SunBlade 100 workstation under Solaris 2.x with a Fortran and a C Sun compiler 4.2. In the case of personal computers, the compilation, linkage, and execution took place on an Intel Pentium 200 computer under a Red Hat Linux release 9 operating system. The Fortran and C compilers for this test were part of a GNU GCC 3.2.2 compiler collection.
Even after years of effort and multiple versions of CORRELATOR leading to the present version 5.2, the program remains open for improvements, especially concerning the data input and dialog menus for the selection of options and parameters.
Acknowledgments
Don Beaumont and John Davis never thought in 1982 that the activity generated by their agreement to devote resources to computer correlation of wireline logs would last, on and off, for twenty years. At the time, Don Beaumont was with Texaco's research laboratories in Houston and John Davis was Chief of the Advanced Projects Section at the Kansas Geological Survey. Both regarded automation of stratigraphic correlation as a scientific and technological challenge worth pursuing. Don Beaumont took early retirement during the fifth year of the project, but John Davis remained the most fervent supporter of CORRELATOR until the completion of its development. From the beginning, development and implementation of the software was the responsibility of the authors, who alternated these tasks with other projects. Texaco provided partial financial support and supplied wireline logs as well as geologic information that were extensively used to illustrate CORRELATOR's first user's manual (Olea, 1988a). Data kindly received from Empresa Nacional del Petróleo, Chile, were used to complete another study in Patagonia.
Texaco's seminal support was undertaken for a short time by Union Oil Company and more extensively by Marathon Oil Company, which was behind the development of CORRELATOR through its version 3.9 of 1994. Tim Coburn and Janine Carlson contributed greatly to the project in terms of financing, data, and suggestions to add generality, flexibility and friendliness to the program.
Jan Harff, Chief Marine Geologists with the Institut für Ostseeforschung Warnemünde, Germany, has been studying the Baltic Sea since 1997 with an eye in sediments as records of recent climatic change. CORRELATOR has been instrumental in producing conclusive results based on the correlation of logs with a resolution of one centimeter obtained by taking measurement in penetration cores. This particular application of CORRELATOR was partly funded by joint grants from the National Science Foundation and the Deutscher Akademischer Austauschdienst.
Robert Sampson left the Kansas Geological Survey in 1997 after designing the architecture of the databases, and contributing most of the input/output and graphical aspect of the software. A series of applications in the last five years using some of the 87,000 wells with at least one log at the Kansas Geological Survey Data Library proved inspirational to bring the program to the current version 5.2 described in this second version of the user's manual. In this late phase of development we are grateful for the discussions and support received from Dan Merriam, Lynn Watney, John Doveton, Geoff Bohling, Jim Deputy, Tyler Stransky, Bill Guy, and Saibal Bhattacharya.
ManualOFR2002-51.pdf (1.4 MB)
To read this file, you will need the Acrobat PDF Reader, available free from Adobe.
v30-06-01.zip (1.6 MB, April 2007)
Kansas Geological Survey, Geohydrology
Placed online Jan. 26, 2006
Comments to webadmin@kgs.ku.edu
The URL for this page is http://www.kgs.ku.edu/Publications/OFR/2002/OFR02_51/index.html