![]()
Prev Page--Geology || Next Page--Development, Summary
Hydrology
The hydrology described in this section includes thickness of the aquifers, properties of the aquifers, water levels in wells, potentiometric surfaces of the aquifers, recharge, and chemical quality of water. Aquifers in rocks of Permian and Late Jurassic age were considered undifferentiated regarding hydrology for most purposes in this report because of the scant data. In some cases, however, limited data exist on specific aquifers. These cases are noted when they appear in following sections. Aquifers in rocks of Cretaceous age in the Cheyenne Sandstone, Kiowa Formation, Dakota Formation, and Codell Sandstone Member of the Carlile Shale were differentiated and are described separately. A hydraulic connection may exist locally between adjacent aquifers, but confining beds separate aquifers in most of the study area.
Aquifer thickness
Aquifer thicknesses, based on sandstone content, should provide a more accurate appraisal of the potential for water-resources development than the broad grouping of entire formations into an undifferentiated "sandstone aquifer" or single geohydrologic unit, as done in previous studies (see table 1). The thickness of a sandstone aquifer given in this report includes the saturated portions, or effective thickness, of the principal water-yielding rocks. However, in many instances, as shown by the test drilling, thinly bedded sandstones are interbedded with thin shales or clay layers. In these instances it was not practical to separate the shale or clay from the sandstone in determining the thickness of the aquifer, although an attempt generally was made to distinguish the thickest sandstone beds. Therefore, segments of the stratigraphic intervals were considered as being beds of either sandstone or shale, even though some thin interbedding of each undoubtedly exists. Average thickness is the average of the values for thickness at the control points where data are available in the study area and where the aquifers occur.
Sandstone thicknesses are shown for Upper Jurassic rocks, the Cheyenne Sandstone, and the Dakota Formation (figs. 8, 10, and 13; sheets 1 and 2), based on interpretation of geophysical logs. The sandstone thicknesses are, for all practical purposes, equivalent to the aquifer thicknesses because the aquifers are under artesian or confined conditions, except in local outcrop areas where the aquifers in Upper Jurassic rocks and the Dakota Formation are under water-table conditions.
Aquifer properties
The storage and movement of water in an aquifer are defined by the physical properties of the aquifer. The volume of water an aquifer is capable of storing is expressed by the storage coefficient and is primarily a function of its porosity. If a hydraulic gradient exists in the aquifer, water will flow through it at a rate governed by the gradient and the lithologic characteristics of the aquifer medium, such as the size and sorting of sand grains, the amount of silt or clay present, and the aquifer thickness. The transmissivity range is from 940 to 7,100 ft2/d for aquifers in the Dakota Formation (table 3). The range for the aquifer storage coefficient in the Dakota is from 0.0004 to 0.07, representing confined to unconfined conditions, respectively. In Finney County, the aquifer in the Dakota Formation at well 24-33W-19DBD has an average transmissivity of 940 ft2/d, a storage coefficient of about 0.0004, and an average porosity of 16-18% (Burns and McOonnell, 1977). Data are not available for the other sandstone aquifers. However, information is available for several wells completed in more than one aquifer and is included in table 3. The maximum yield of wells discharging from aquifers in the Dakota Formation and in Ogallala and Pleistocene deposits is 1,200 gal/min. Yields from aquifers in the Dakota Formation in Ford County range from a few gallons per minute to 2,200 gal/min (Lobmeyer and Weakly, 1979). The sandstone aquifers are confined, except in outcrop areas where water-table conditions prevail.
Table 3--Summary of aquifer properties.
| County | Location | Date | Aquifer | Sandstone thickness (ft) |
Well depth (ft) |
Water level (ft) |
Discharge (gal/min) | Test duration(min) |
Drawdown (ft) |
Specific capacity (gal/min/ft of drawdown) |
Hydraulic conductivity (ft/d) |
Storage coefficient (dimensionless) |
Transmissivity (ft2/d) |
Reference (reported by) |
|
|---|---|---|---|---|---|---|---|---|---|---|---|---|---|---|---|
| Yield | Test average |
||||||||||||||
| Finney | 24-33W-19DBD | 1977 | Dakota | 196 | 714 | 71 | 790 | 600 | 10.080 | 117 | 7.6 | 4.8 | 0.0004 | 940 | Burns and McDonnell, 1977 |
| Finney | 24-33W-19DBA | 1977 | Dakota | 128 | 714 | 90 | 10.080 | 25 | 9.7 | .001 | 1.240 | Burns and McDonnell, 1977 | |||
| Finney | 24-34W-3A | 1977 | Dakota | 100 | 680 | 114 | 550 | 2.460 | 100 | 5.5 | Henkle Drilling Co. (test pump analysis) |
||||
| Hamilton | north of Arkansas River |
1974 | Jurassic and Lower Cretaceous |
0.1 | .0001 | 50 | Lobmeyer and Sauer. 1974 | ||||||||
| Hamilton | south of Arkansas River |
1974 | Jurassic and Lower Cretaceous |
.5 | .0001 | 250 | Lobmeyer and Sauer. 1974 | ||||||||
| Hamilton | 25-42W-34CBB | 1975 | Dakota | 100 | 332 | 175 | 900 | 69 | 8.8 | Henkle Drilling Co. | |||||
| Hodgeman | 25-23W-35DDB | 1969 | Dakota | 175 | 320 | 142 | 950 | 12.960 | 44 | 21.6 | 41 | .07 | 7.100 | Lobmeyer and Weakly, 1979 | |
| Hodgeman | 25-24W-16ADB | 1973 | Dakota | 125 | 565 | 261 | 560 | 7,200 | 91 | 6.2 | 16 | .0005 | 2,000 | Lobmeyer and WeakJy, 1979 | |
| Stanton | 27-39W-13AC | 1960 | Dakota and Cheyenne |
508 | 87 | 900 | 6,100 | Fader and others. 1964 | |||||||
| Stanton | 30-40W-24CC | 1960 | Pleistocene, Ogallala, and Dakota |
295 | 105 | 1,200 | .0013 | 13,000 | Fader and others, 1964 | ||||||
| Stanton | 30-41W-13CC | 1960 | Ogallala and Dakota | 235 | 168 | 900 | .044 | 18.300 | Fader and others. 1964 | ||||||
Water-level hydrographs
Hydrographs in this report show water-level fluctuations in observation wells in aquifers in rocks of Late Jurassic and Cretaceous age. The hydrographs of water levels in wells completed in aquifers in rocks of Late Jurassic and Early Cretaceous age are shown in fig. 14. The Upper Jurassic rocks and Cheyenne Sandstone are considered by Fader and others (1964) to be a single hydrologic unit in Grant and Stanton counties because these rock units have similar hydrologic characteristics and are stratigraphically adjacent to each other. This hydrologic relationship is described or implied in other reports addressing aquifers in rocks of Late Jurassic and Early Cretaceous age in the region (table 1). As a result of that relationship, wells in southwestern Kansas often are screened in both units, making the determination of respective head differences between aquifers in rocks of Late Jurassic and Early Cretaceous age difficult.
Figure l4--Hydrographs of selected wells in aquifers in rocks of undifferentiated Late Jurassic and Early Cretaceous age.
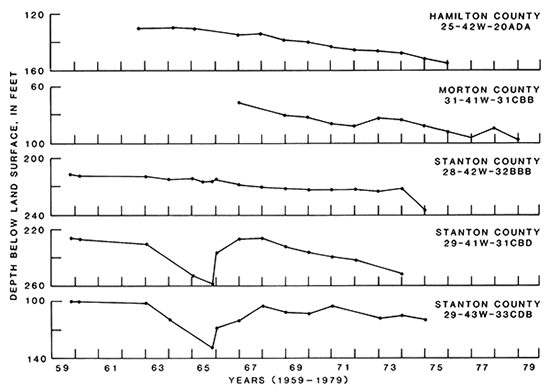
From the hydrographs shown in fig. 14, the average decline in water levels between 1959 and 1975 was calculated to be 21 ft. In Hamilton County stock well 25-42W-20ADA, the water level declined approximately 25 ft during 1962-1976. In Morton County irrigation well 31-41W-31CBB, the water level declined about 25 ft during 1967-1979.
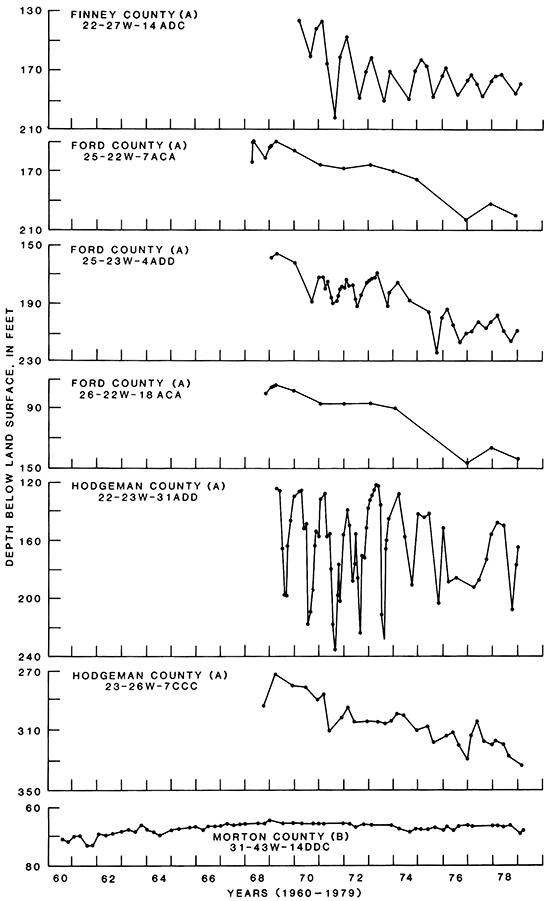
The hydrographs of water levels in wells in aquifers in the Dakota Formation and in rocks of undifferentiated Early Cretaceous age are shown in fig. 15. In Finney County, a hydrograph of irrigation well 22-27W-14ADC shows that between 1970 and 1979 the water level declined about 42 ft. In Ford County, hydrographs of wells 25-22W-7AC, 25-23W-4ADD, and 26-22W-18ACA show a water-level decline that was calculated to average 60 ft in these wells between 1969 and 1979. Most of this decline has occurred since 1974. In Hodgeman County, hydrographs of stock well 22-23W-31ADD and irrigation well 23-26W-7CCC were used to calculate a water-level decline that averaged 52 ft in these wells between 1969 and 1979. Most of this decline has occurred since 1974. The large water-level fluctuations seen in the hydrograph of well 22-23W-31ADD reflect the draw down and recovery effects of pumping. In Morton County, a hydrograph of an unused water-table well 31-43W-14DDC in aquifers in rocks of Early Cretaceous age shows that very little water-level fluctuation has occurred. The short-term fluctuations in the hydrographs are the result of seasonal pumping of nearby wells.
Figure 15--Hydrographs of selected wells in aquifers in the Dakota Formation or in undifferentiated rocks of Early Cretaceous age. A indicates that the well is screened in the Dakota Formation, and B indicates that the well is screened in undifferentiated rocks of Early Cretaceous age.
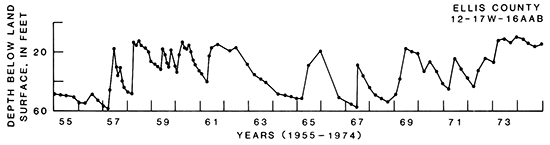
A hydrograph of the water level in well 12-17W-16AAB in the aquifer in the Codell Sandstone Member of the Carlile Shale is shown in fig. 16. This well in Ellis County is an unused water-table well in which the water level has risen about 34 ft between 1955 and 1974. The large and rapid water-level rises that occur in the spring of most years can be attributed to the percolation of precipitation into the aquifer and runoff directly recharging the aquifer in outcrop areas.
Figure 16--Hydrograph of a selected well in aquifers in the Codell Sandstone Member of the Carlile Shale.
Potentiometric surfaces and water-level measurements
Maps of the potentiometric surface of selected aquifers are shown in figs. 17-20. However none of the maps shows the potentiometric surface for the entire study area nor for a single year. Grouping of years was necessary because of limited data available. The maps are based on measurements of water levels in observation wells penetrating the selected aquifers.
The altitude of the potentiometric surface during 1975-79 in aquifers in rocks of undifferentiated Permian age in the southeastern part of the area ranged from 2,100 to approximately 2,500 ft (fig. 17), The surface has a hydraulic gradient of about 5 ft/mi or 0.0009 toward the northeast and southeast.
Figure 17--Potentiometric surface of aquifers in rocks of Permian age, 1975-79.
In Ford County, the water level during 1978-79 in observation well 28-22W-30BCC in the aquifer in the Whitehorse Formation ranged from 151.2 to 165.9 ft below land surface. Observation wells 20-17W-22DCC and 22-19W-07AAA2 in Pawnee County are flowing artesian wells in the Whitehorse Formation. The water levels in well 20-l7W-22DCC ranged from 32.5 to 35.4 ft above the land surface and in well 22-19W-07AAA2 ranged from 16.6 to 27.3 ft above the land surface during 1978-79. The recorded fluctuations in the water levels in the Whitehorse may be the result of changes in barometric pressure. In Meade County, the water levels during 1978-79 in observation wells in the aquifer in the Big Basin Formation ranged from 118.3 to 125.5 ft below land surface in well 30-26W-0lBCD and from 78 to 79.4 ft below land surface in well 32-26W-04AAB.
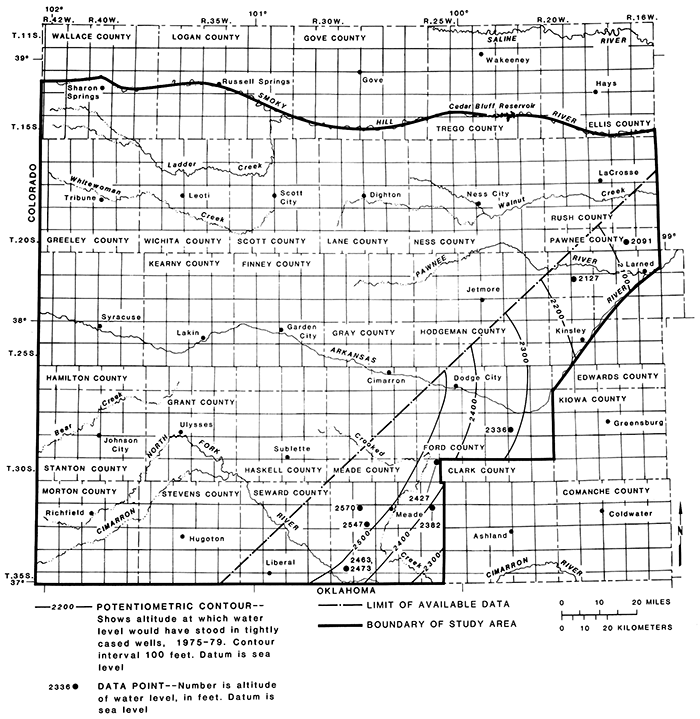
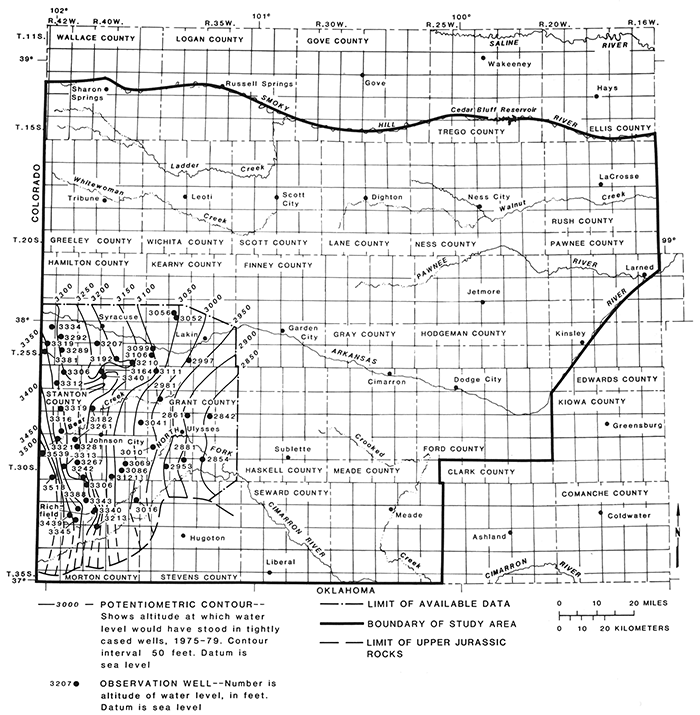
The altitude of the potentiometric surface during 1975-79 of aquifers in rocks of undifferentiated Late Jurassic and Early Cretaceous age and in Tertiary and Quaternary deposits is shown in fig. 18. Wells in the area shown are completed in more than one aquifer and may be completed in all of the freshwater aquifers present at a given site. The potentiometric surface expressed in these wells represents a common hydraulic head, which ranged from about 2,850 to 3,500 ft in altitude. The hydraulic gradient was about 16 ft/mi or 0.0030 toward the east.
Figure l8--Potentiometric surface of aquifers in rocks of undifferentiated Late Jurassic and Early Cretaceous age and Tertiary and Quaternary deposits, 1975-79.
The altitude of the potentiometric surface of the aquifers in the Cheyenne Sandstone during 1978-1981 is shown in fig. 19. The surface ranged from about 3,200 ft in altitude in Hamilton County to about 2,100 ft in Pawnee and Rush counties. The hydraulic gradient was about 8 ft/mi or 0.0015 from west to east (fig. 19).
Figure 19--Potentiometric surface of aquifers in the Cheyenne Sandstone, 1978-1981.

Upward leakage of ground water from stratigraphically adjacent rocks probably occurs in Pawnee County. Capped observation wells 20-17W-22DCC in the Whitehorse Formation and 20-17W-22DCC2 in the Cheyenne Sandstone are flowing artesian wells and produce briny water when they are uncapped. Similar chemical characteristics of water from these wells suggest a common source of water. Also, the hydraulic head in the Whitehorse Formation is about 5 ft greater than in the Cheyenne Sandstone. A hydraulic connection between formations probably allows the upward movement of water from Permian rocks into the Cretaceous rocks.
In Hamilton County, flowing artesian wells in the Cheyenne Sandstone were reported by Haworth (1913) and McLaughlin (1943) who indicated that flow had decreased by more than 60% by 1943.
Sufficient data are not available for making a potentiometric-surface map of the aquifer in the Kiowa Formation. Depth to water in the aquifer in the Kiowa, as measured in observation well 25-29W-21CDA2 in Gray County, was 168 ft below land surface in 1979. The altitude of this water level is 2,539 ft.
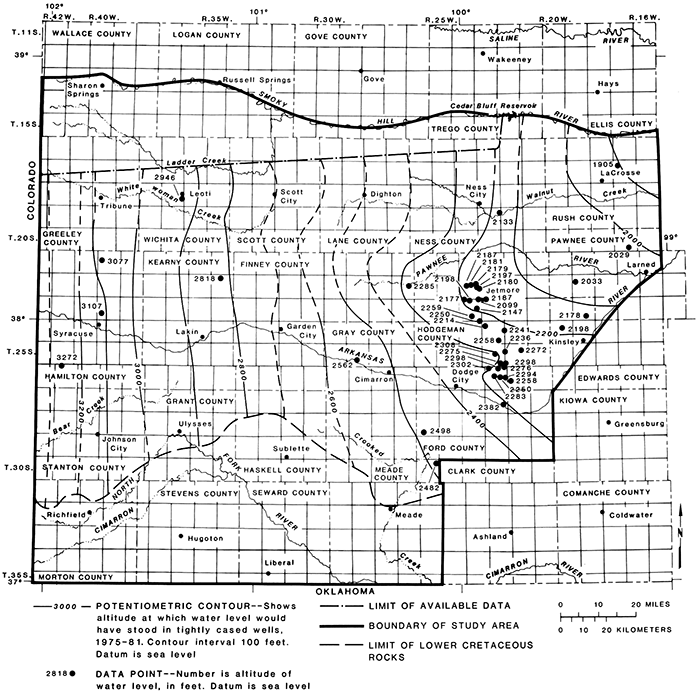
The altitude of the potentiometric surface of the aquifers in the Dakota Formation during 1~75-1981 ranged from about 1,900 ft in Rush County to about 3,300 ft in Greeley, Hamilton, Stanton, and Morton counties (fig. 18). The hydraulic gradient was about 9 ft/mi or 0.0017 sloping to the east. The direction and slope of the potentiometric surface in the eastern part of the study area have been affected by ground-water withdrawals in Hodgeman and Ford counties. The hydraulic gradient from Gray to Pawnee counties was about 6 ft/mi or 0.0011 sloping to the northeast.
Figure 20--Potentiometric surface of aquifers in the Dakota Formation, 1975-1981.
Recharge
Recharge to the sandstone aquifers is from 1) precipitation and runoff percolating into numerous sandstone outcrops in eastern Colorado and into scattered outcrop areas in southwestern Kansas, 2) underflow from adjoining areas, and 3) vertical flow between adjacent permeable formations, such as the overlying aquifers in Ogallala and Pleistocene deposits and the underlying aquifers in rocks of Permian and Late Jurassic age, or through semipermeable confining beds, such as siltstone, silty clay, and clay. Vertical flow is probably the most important source of recharge.
Part of the recharge in the study area is by underflow from adjoining areas to the west. The altitude of the potentiometric surfaces of the sandstone aquifers is highest in the western part and lowest in the eastern part of the study area. This ground-water gradient indicates that the major direction of ground-water flow is from Colorado eastward through southwestern Kansas.
Because of higher hydraulic heads in the aquifers in Ogallala and Pleistocene deposits, flow of water is downward into aquifers in rocks of Early Cretaceous and Late Jurassic age in Finney and Haskell counties (Gutentag and others, 1972), in southwestern Hamilton and northern Stanton counties (Lobmeyer and Sauer, 1974), and in Kearny and Grant counties (Gutentag and others, 1972).
The hydraulic heads in aquifers in rocks of Permian age are generally higher than those of the aquifers in rocks of Early Cretaceous age in the eastern part of the area. For example, artesian flow from aquifers in rocks of Permian age occurs in Pawnee County in observation wells 20- 17W-22DCC and 22-19W-7AAA2 and in wells near Frizell and at Larned, as reported by McLaughlin (1949). Vertical flow upward from aquifers in rocks of Permian age into aquifers in rocks of Early Cretaceous age may occur in certain areas where hydraulic connections are present.
Chemical quality of water
Selected chemical analyses of ground water from aquifers in rocks of Permian and Late Jurassic age and in the Cheyenne Sandstone, the Dakota Formation, and the Codell Sandstone Member of the Carlile Shale are summarized in table 4. For each constituent or property, the number of analyses and the minimum and maximum values are given. Of the total number of analyses listed, most are for water samples collected from the aquifers in the Dakota Formation. The least number of water samples collected are from the aquifers in rocks of Late Jurassic age and in the Cheyenne Sandstone and the Codell Sandstone Member.
The procedures for sample preparation and pretreatment and the methods for determination of inorganic substances in water are described by Skougstad and others (1979) and Wood (1976). The water samples were collected from flowing wells and by air lifting water from other wells. The samples were filtered, acidified, and chilled following collection. They were sent to the laboratory under chilled conditions.Table 4--Summary of selected chemical analyses of ground water from sandstone aquifers. Values are given in milligrams per liter (mg/L); µg/L, micrograms per liter; µmho/cm at 25°C, micrornho per centimeter at 25°C; meq/L, milliequivalents per liter. The recommended maximum for public supply is from the Kansas Department of Health and Environment (Kansas State Board of Health, 1973).
| Constituent or property |
Recommended maximum for public supply |
Aquifers in rocks of Permian age |
Aquifers in rocks of Late jurassic age |
Aquifers in the Cheyenne Sandstone |
Aquifers in the Dakota Formation |
Aquifers in the Codell Sandstone Member of Carlile Shale |
||||||||||
|---|---|---|---|---|---|---|---|---|---|---|---|---|---|---|---|---|
| Number of analyses |
Minimum | Maximum | Number of analyses |
Minimum | Maximum | Number of analyses |
Minimum | Maximum | Number of analyses |
Minimum | Maximum | Number of analyses |
Minimum | Maximum | ||
| Calcium, Ca (mg/L) |
13 | 8 | 3,600 | 3 | 29 | 70 | 5.3 | 796 | 95 | 1.6 | 144 | 4 | 62 | 121 | ||
| Magnesium, Mg (mg/L) |
13 | 1 | 1,800 | 3 | 23 | 40 | 4 | 1.8 | 709 | 95 | .5 | 120 | 4 | 14 | 25 | |
| Sodium, Na (mg/L) |
13 | 14 | 17,400 | 3 | 32 | 63 | 4 | 16 | 17,400 | 95 | 9.2 | 1,300 | 4 | 9.2 | 38 | |
| Potassium, K (mg/L) |
11 | 4 | 680 | 1 | 3.2 | 3.2 | 4 | 5.6 | 60 | 45 | 2.8 | 48 | 0 | |||
| Bicarbonate, HCO3 (mg/L) |
13 | 61 | 370 | 3 | 188 | 301 | 4 | 120 | 350 | 95 | 51 | 930 | 4 | 215 | 300 | |
| Sulfate SO4 (mg/L) |
250 | 13 | 9 | 3,700 | 3 | 46 | 177 | 4 | 17 | 3,700 | 95 | .8 | 382 | 4 | 12 | 239 |
| Chloride, Cl (mg/L) |
250 | 13 | 7 | 28,200 | 3 | 10 | 15 | 4 | 15 | 28,200 | 95 | 4.5 | 1,800 | 4 | 11 | 64 |
| Fluoride, F (mg/L) |
1.5 | 10 | 0.1 | 3.2 | 3 | 0.5 | 2.8 | 3 | .9 | 3.2 | 89 | .2 | 8 | 4 | .3 | .7 |
| Nitrate, NO3(mg/L) |
45 | 13 | .1 | 8 | 3 | 7.5 | 15 | 3 | .1 | 4.7 | 93 | 0 | 41 | 4 | 10 | 80 |
| Iron, Fe (µg/L) |
300 | 8 | 20 | 1,800 | 3 | 790 | 1,300 | 2 | 30 | 170 | 87 | 10 | 9,300 | 4 | 30 | 890 |
| Manganese, Mn (µg/L) |
50 | 6 | 0 | 220 | 1 | 0 | 0 | 2 | 0 | 100 | 58 | 0 | 200 | 1 | 0 | 0 |
| Silica, SiO2 (mg/L) |
11 | 8.3 | 33 | 1 | 29 | 29 | 4 | 8 | 30 | 74 | 0 | 45 | 4 | 16 | 25 | |
| Hardness, total (mg/L) |
13 | 28 | 5,800 | 3 | 154 | 326 | 4 | 24 | 4,900 | 93 | 6 | 483 | 4 | 212 | 400 | |
| Hardness, noncarbonate (mg/L) |
13 | 0 | 16,300 | 3 | 0 | 115 | 3 | 12 | 4,610 | 90 | 0 | 1,240 | 4 | 22 | 224 | |
| Sodium-adsorption ratio, SAR (meq/L) |
13 | 0.4 | 108 | 3 | 0.9 | 1.5 | 4 | .7 | 108 | 93 | .3 | 73 | 4 | .3 | .6 | |
| Specific conductance (µmho/cm at 25°C) |
9 | 115 | 60,000 | 1 | 660 | 660 | 4 | 325 | 60,000 | 63 | 470 | 6,740 | 4 | 465 | 915 | |
| Dissolved solids (mg/L) |
500 | 13 | 89 | 51,000 | 3 | 296 | 517 | 3 | 192 | 51,000 | 94 | 201 | 3,660 | 4 | 264 | 564 |
| pH | 7 | 7.1 | 8.0 | 1 | 8.4 | 8.4 | 4 | 7.1 | 8.4 | 44 | 6.8 | 8.7 | 0 | |||
| Temperature (°C) |
10 | 14 | 18.9 | 3 | 15 | 16.7 | 3 | 14 | 20.2 | 72 | 14 | 22 | 3 | 12 | 15.5 | |
The wide range in values of the constituents or properties shown intable 4 indicates an extreme diversity in the chemical quality of water in the sandstone aquifers. Therefore, precisely characterizing the chemical quality of water from any given aquifer is difficult. Quality may vary in different areas of an aquifer from excellent to extremely poor.
The suitability of water for public supply and domestic use are judged by the recommended maximum constituent or property value for public supply as determined by the Kansas Department of Health and Environment (Kansas State Board of Health, 1973), based on standards that have been established by the U.S. Environmental Protection Agency (1976, 1979) for drinking water.
The chemical quality of water from aquifers in rocks of undifferentiated Permian age was quite varied. Sodium chloride and calcium sulfate were the most common chemical types of water for samples analyzed during this study, but calcium bicarbonate type water also was present. Dissolved-solids concentrations ranged from 89 to 51,000 mg/L (milligrams per liter). The temperature of the water ranged from 14 to 18.9°C. The maximum concentrations of sulfate (3,700 mg/L), chloride (28,200 mg/L), fluoride (3.2 mg/L), iron (1,800 µg/L, micrograms per liter), and dissolved solids (51,000 mg/L) exceeded the recommended maximum for public supply. The water was very hard.
Generally, the water from rocks of Permian age is saline to briny and not potable, but lenses of freshwater may be present in small areas where precipitation infiltrates the sandstone outcrops. In Pawnee County, natural discharge of saline water to springs may occur in some outcrops where the potentiometric surface is above the land surface. Upward migration of saline water through overlying permeable strata, whether natural or induced by pumpage, is a factor in the contamination of fresh ground water and surface water. Such contamination appears to have happened in some areas of the Cheyenne Sandstone and the Dakota Formation in Pawnee County.
The water from aquifers in rocks of Late Jurassic age is fresh where it has been sampled in southwest Kansas. Dissolved-sol ids concentrations ranged from 296 to 517 mg/L. The maximum concentrations of dissolved iron (1,300 µg/L) and fluoride (2.8 mg/L) exceeded the recommended maximum for drinking water. Calcium or sodium bicarbonate were the most common chemical types of water. The water was very hard.
The chemical quality of the water in the aquifer in the Cheyenne Sandstone is considerably varied. Sodium sulfate or sodium chloride were the common chemical types of water. Dissolved-solids concentrations ranged from 192 to 51,000 mg/L. The maximum concentrations of sulfate (3,700 mg/L), chloride (28,200 mg/L), fluoride (3.2 mg/L), and dissolved solids (51,000 mg/L) exceeded the recommended maximums for public supply. The water is soft to very hard. Hardness concentrations range from 24 to 4,900 mg/L. Generally, the water is saline to briny, except where a hydraulic connection exists with the underlying aquifers in rocks of Late Jurassic age or overlying aquifers in the Ogallala Formation or where the sandstone crops out at the land surface. Briny waters generally occurred in areas where a hydraulic connection exists with aquifers in rocks of Permian age.
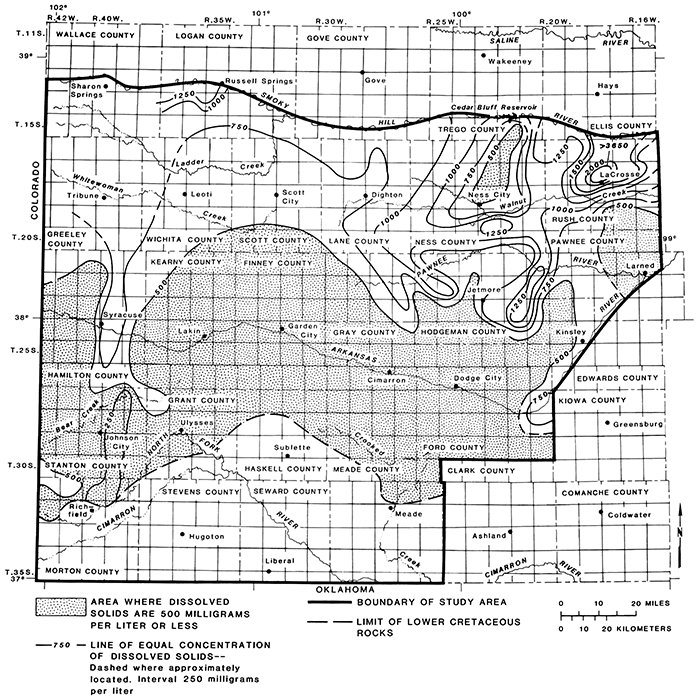
The quality of water from aquifers in the Dakota Formation was well defined by the 95 available analyses (table 4). The data indicate that the water was fresh to moderately saline. Dissolved-solids concentrations ranged from 201 to 3,660 mg/L (fig. 21 and table 4). The aquifers in most of the southern part of the study area contained water with dissolved-solids concentrations of less than 500 mg/L. North of this area, except for two isolated areas, the dissolved solids increased progressively. Dissolved-solids concentrations reached a high of 3,660 mg/L in central Rush County. In this area the water from the aquifer in the Dakota Formation is of the sodium chloride type.
Figure 21--Concentrations of dissolved solids in water from aquifers in the Dakota Formation.
The sodium chloride type water in the aquifers in the Dakota probably originated from the underlying aquifers in rocks of Permian age by natural upward migration. Upward movement of saline water also can be induced by withdrawals of water from the aquifers by pumping of wells. Natural discharge of saline water by springs occurs in the outcrop area. Contamination of streams by saline water from the Dakota Formation in Ellis and Russell counties was reported by Hargadine and Luehring (1978, p. 103).
The lowest concentrations of dissolved solids--201-232 mg/L--in the aquifers in the Dakota occurred in Morton and Stanton counties. The water was of the calcium bicarbonate type and probably originated from downward migration of freshwater recharge from overlying Ogallala and Pleistocene aquifers or from precipitation on scattered Dakota sandstone outcrops.
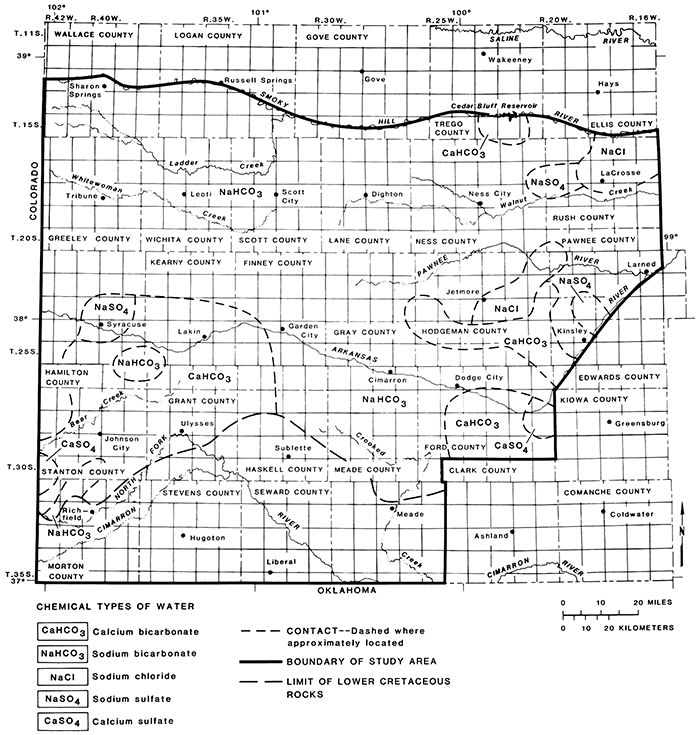
Sodium bicarbonate was the most common chemical type in the aquifers in the Dakota Formation and occurred throughout the largest area (fig. 22). Calcium bicarbonate water was the second most common chemical type. Other chemical types present included sodium chloride, sodium sulfate, and calcium sulfate.
Figure 22--Occurrence of chemical types of water from aquifers in the Dakota Formation.
Water from the Dakota aquifers was soft to very hard. The total hardness ranged from 6 to 483 mg/L. The water was potable, but the maximum concentrations of iron (9,300 µg/L), fluoride (8 mg/L), and dissolved solids (3,660 mg/L) exceeded the recommended maximum concentrations for public supply.
Calcium bicarbonate or calcium sulfate were the most common chemical types of water in samples from aquifers in the Codell Sandstone Member of the Carlile Shale. The water was fresh. Dissolved solids ranged from 264 to 564 mg/L, which is less than the recommended maximum for drinking water. However, the maximum concentrations of nitrate (80 mg/L), dissolved iron (890 µg/L), and dissolved solids (564 mg/L) exceeded the recommended maxima for drinking water. The water was very hard.
Suitability of water for irrigation
The chemical characteristics of water that are most important in determining its suitability for irrigation are 1) the total concentration of soluble salts (salinity), 2) the relative proportion of sodium to other cations (alkalinity), 3) the concentration of boron or other elements that may be toxic, and, under some conditions, 4) the bicarbonate concentrations (U .S. Salinity Laboratory Staff, 1954).
Water quality for irrigation can be ranked from most suitable to least suitable based on available analyses as follows: 1) water from aquifers in the Codell Sandstone Member of the Carlile Shale, 2) water from aquifers in the Dakota Formation, 3) water from aquifers in rocks of Late Jurassic age, 4) water from aquifers in the Cheyenne Sandstone, and 5) water from aquifers in rocks of Permian age.
The potential for water containing a' high concentration of dissolved solids to cause the soil salinity to increase is called the "salinity hazard" of the water. Increases in soil salinity are undesirable side effects when irrigating crops with high-salinity-hazard water. Soil types, drainage, the amount of water used, and other factors determine whether use of a given water for irrigation will cause a buildup in soil salinity.
A high concentration of sodium in irrigation water has an undesirable effect on the soil through the process of ion exchange. Sodium in the water is exchanged for calcium and magnesium in the soil. This produces an "alkali soil" in which the soil particles have deflocculated and impaired the soil texture. The soil becomes difficult to till and to drain. The potential for water to deflocculate the soil particles is called the "sodium (alkali) hazard" of the water. The potential for irrigation water to produce these conditions depends on the sodium content in relation to the calcium and magnesium content. This is expressed as a sodium-adsorption ratio (SAR). Low SAR values are desirable for irrigation water.
A classification of water (U.S. Salinity Laboratory Staff, 1954), based on the SAR and specific conductance of water, shows the suitability for irrigation water from 30 selected wells in aquifers in the Dakota Formation (fig. 23). A list of the sample numbers, county names, well numbers, SAR, and specific-conductance values is given in table 5. Water from the Dakota aquifers ranged from a medium to very high salinity hazard and from a low to very high sodium (alkali) hazard. The SAR ranged from 0.4 to 28.0 (table 5). Specific conductance ranged from 470 to 6,740 µmho/cm at 25°C (micromho per centimeter at 25°C; table 4). The wide range in SAR and specific conductance and the scattered points plotted in fig. 23 illustrate the diverse chemical character of the water in the Dakota. Although not shown in fig. 23, the SAR ranged from 35 to 47 and the specific conductance from 1,250 to 2,180 µmho/cm at 25°C in Logan County. For two samples in Wallace County, the SAR ranged from 57 to 73, and the specific conductance ranged from 1,670 to 2,140 µmho/cm at 25°C. Because the water from Logan and Wallace counties has a very high sodium (alkali) hazard and a high salinity hazard, the water would not be suitable for irrigation use.
Figure 23--Classification of water from aquifers in the Dakota Formation, describing suitability for irrigation (number is sample number used in table 5).
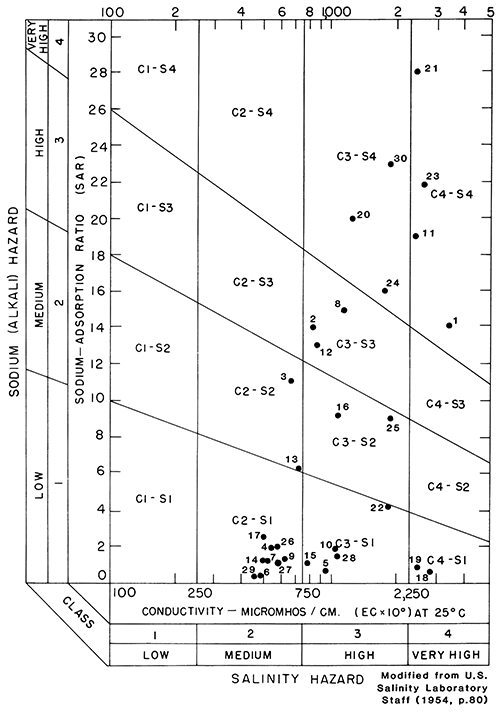
Table 5--Sodium-adsorption ratios and specific-conductance values for water from selected wells drilled into aquifers in the Dakota Formation.
| Sample number (shown in fig. 23) |
County name | Well number | Sodium-adsorption ratio (SAR) |
Specific conductance (micromho/centimeter at 25°C) |
|---|---|---|---|---|
| 1 | Ellis | 15-18W-33BAA | 14 | 3,200 |
| 2 | Finney | 22-27W-14BD | 14 | 820 |
| 3 | Finney | 23-29W-12CCC | 11 | 670 |
| 4 | Ford | 25-23W-25CCC | 2 | 540 |
| 5 | Ford | 26-21W-11CCB | .8 | 940 |
| 6 | Ford | 27-22W-19CCC | .5 | 480 |
| 7 | Ford | 27-23W-24BCB | 1.3 | 520 |
| 8 | Hamilton | 21-40W-28DCC | 15 | 1,200 |
| 9 | Hamilton | 25-39W-22DCC | 1.4 | 610 |
| 10 | Hamilton | 26-41W-24CDC | 1.9 | 1,080 |
| 11 | Hodgeman | 21-21W-31DDA | 19 | 2,440 |
| 12 | Hodgeman | 21-24W-27BCC | 13 | 850 |
| 13 | Hodgeman | 23-25W-11ADA | 6.3 | 720 |
| 14 | Hodgeman | 23-26W-07CCC | 1.2 | 500 |
| 15 | Hodgeman | 24-23W-34AAD | 1.1 | 780 |
| 16 | Lane | 18-29W-15D | 9.1 | 1,050 |
| 17 | Meade | 30-26W-01BCD2 | 2.5 | 510 |
| 18 | Morton | 32-41W-28DB | .6 | 2,920 |
| 19 | Morton | 34-42W-05BD | .9 | 2,520 |
| 20 | Ness | 19-23W-01CCB | 20 | 1,280 |
| 21 | Ness | 19-23W-21DA | 28 | 2,470 |
| 22 | Pawnee | 20-27W-22DCC3 | 4.2 | 1,850 |
| 23 | Rush | 16-16W-32CCB | 22 | 2,650 |
| 24 | Rush | 16-19W-17BAB | 16 | 1,800 |
| 25 | Rush | 17-20W-29CDD | 9 | 1,900 |
| 26 | Rush | 19-17W-27ADD | 2 | 570 |
| 27 | Stanton | 29-42W-24CCC | 1.1 | 570 |
| 28 | Stanton | 30-43W-28DD | 1.5 | 1,070 |
| 29 | Trego | 15-22W-35ABA | .4 | 470 |
| 30 | Trego | 15-24W-15CCC | 23 | 1,930 |
Suitability for irrigation of water from the sandstone aquifers other than the aquifers in the Dakota Formation is shown in fig. 24. A list of the sample numbers, county names, well numbers, aquifers, SAR, and specific-conductance values is given in table 6.
The water samples from aquifers in rocks of Permian age had a low to very high sodium hazard and a low to very high salinity hazard (fig. 24). The SAR ranged from 0.6 to 18. The specific conductance ranged from 115 to 60,000 µmho/cm at 25°C. Generally, the water from the aquifers is not suitable for irrigation. However, near outcrop areas where freshwater can recharge the aquifer, water quality in the aquifer may be more suitable for irrigation than in areas further from freshwater recharge.
Figure 24--Classification of water from aquifers in rocks of Permian and Late Jurassic age, in the Cheyenne Sandstone, and in the Codell Sandstone Member of the Carlile Shale, describing suitability for irrigation (number is sample number used in table 6).
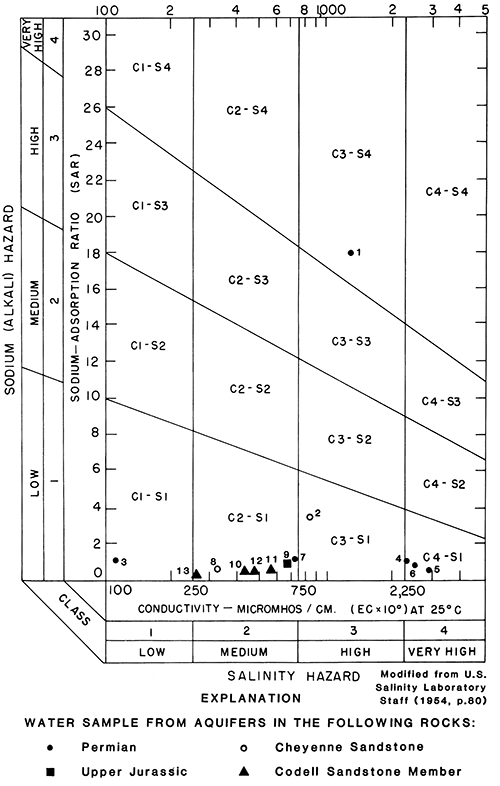
The only well sampled from an aquifer in rocks of Late Jurassic age had water with a low sodium hazard and a medium salinity hazard. The SAR was 0.9, and specific conductance was 660 µmho/cm at 25°C. The water from the aquifer was suitable for irrigation at the sampled location.
Water from wells in aquifers in the Cheyenne Sandstone had a low sodium hazard and a medium to high salinity hazard. The SAR ranged from 0.7 to 3.5. The specific conductance ranged from 325 to 60,000 µmho/cm at 25°C. The suitability for irrigation of water from the aquifers is variable in the study area.
The water from wells in the aquifers in the Codell Sandstone Member of the Carlile Shale had a low sodium hazard and a medium to high salinity hazard. The SAR ranged from 0.3 to 0.6. The specific conductance ranged from 465 to 915 µmho/cm at 25°C. The water was suitable for irrigation.
Table 6--Sodium-adsorption ratios and specific-conductance values for water from selected wells drilled into aquifers in rocks of Permian and Late Jurassic age, in the Cheyenne Sandstone, and in the Codell Sandstone Member of the Carlile Shale.
| Sample number (shown in fig. 24) |
County name | Well number | Aquifer | Sodium-adsorption ratio (SAR) |
Specific conductance (micromho/centimeter at 25°C) |
|---|---|---|---|---|---|
| 1 | Edwards | 24-20W-09CDD2 | Permian | 18 | 1,350 |
| 2 | Grant | 28-38W-07AB | Cheyenne | 3.5 | 830 |
| 3 | Meade | 30-26W-01BCD | Permian | 1.1 | 115 |
| 4 | Meade | 32-29W-27AAB | Permian | 1.1 | 2,300 |
| 5 | Morton | 32-41W-28DB | Permian | .6 | 2,920 |
| 6 | Morton | 24-42W-05DB | Permian | .9 | 2,520 |
| 7 | Pawnee | 22-19W-07AAA2 | Permian | 1.2 | 725 |
| 8 | Rush | 17-17W-06ABBA | Cheyenne | .7 | 325 |
| 9 | Seward | 34-34W-17DDD | Jurassic | .9 | 660 |
| 10 | Trego | 15-21W-36DDD | Codell | .5 | 434 |
| 11 | Trego | 15-23W-04BCB | Codell | .6 | 564 |
| 12 | Trego | 15-24W-35CCC | Codell | .5 | 488 |
| 13 | Trego | 15-25W-35CDC | Codell | .3 | 264 |
Prev Page--Geology || Next Page--Development, Summary
Kansas Geological Survey, Geohydrology
Placed on web June 14, 2013; originally published 1985.
Comments to webadmin@kgs.ku.edu
The URL for this page is http://www.kgs.ku.edu/Publications/Bulletins/IRR8/04_hydro.html