![]()
Prev Page--Introduction || Next Page--Geology
Geography
Topography and Drainage
Although the area described in this report lies in two different physiographic provinces according to Adams (1903) and Schoewe ( 1949), these divisions are regional in nature and are determined principally by the features of the uplands. The valleys, in fact, are not characteristic of either province. Except that it is narrower where it is bordered by the resistant Fort Hays limestone member of the Niobrara formation, the valley of North Solomon River is much the same throughout the area studied. Physiographically the area on Plate 1 might be divided into two parts: (1) the uplands and (2) the valley proper.
In the eastern half of the area the uplands bordering the valley consist of steep-sided Hat-topped chalk hills covered with a thin layer of loess. They are well drained and have a fine-textured drainage pattern. From the heel of the Hat terrace up a precipitous shale slope and a nearly vertical limestone escarpment to the top of the hills, the relief in many places is more than 200 feet. West of Cedar the uplands consist of hills that are slightly rounded, although in many places they have precipitous slopes similar to those farther east. In western Phillips County rounded hills give way to rounded slopes that rise to relatively Hat uplands. In places these uplands form the dissected surface of a Pleistocene high terrace.
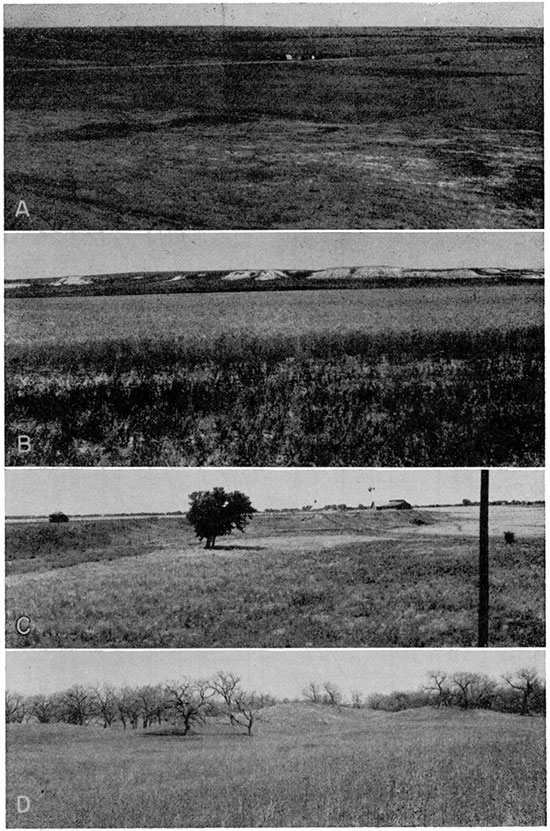
The valley proper consists of broad undissected terraces and a narrow Hood plain (Pl. 4). Relief within the valley, from the stream channel to the top of the terrace surface, is as much as 40 feet in some places. The terrace is here designated the Kirwin terrace, from the town of that name built upon it. The terrace surface lies above Hood level, slopes very gently, and is moderately well drained, although its drainage pattern is noticeably coarser than that of the adjacent uplands (Pl. 5). Many of the small ephemeral streams that drain the uplands do not have channels across the terrace but fan out and disappear on its surface, contributing a large part of their water to the ground-water reservoir in the area (Pl. 1).
Plate 4--A, North Solomon Valley near Harlan. B, Kirwin terrace surface and valley walls of Smoky Hill chalk member of the Niobrara formation, SW sec. 26, T. 4 S., R. 16 W., Phillips County. C, Flood plain and scarp of Kirwin terrace near Portis; looking west from U. S. Highway 281, NE sec. 7, T. 6 S., R. 12 W., Osborne County. D, Sand dunes on the flood plain of North Solomon River, SW sec. 29, T. 4 S., R. 17 W., Phillips County.
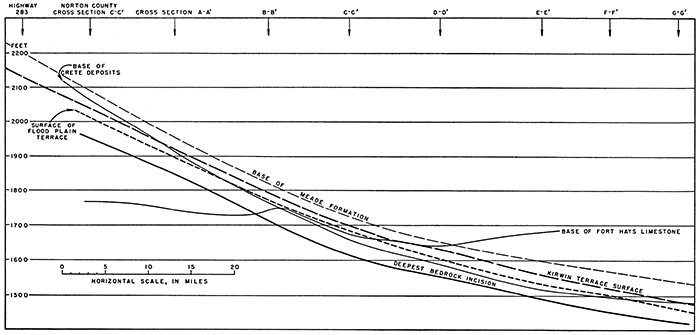
The terrace area includes much of the cultivated farm land and at least part of each town shown on the map. The average gradient of the terrace surface in the area studied is 7.3 feet per mile. The terrace slopes from an altitude of 1,975 feet near Logan, in Phillips County, to about 1,460 feet south of Cawker City, in Mitchell County. The average gradient of the river channel is 5.2 feet per mile, but it decreases from 7.1 feet per mile across Phillips County to 2.7 feet per mile below Downs, in Osborne County (Fig. 3).
Figure 3--Longitudinal profiles of North Solomon Valley. Profiles are shown for the base of the Meade, base of Crete, Kirwin terrace, floodplain terrace, and deepest bedrock incision, at a vertical exaggeration of 210 X. Profiles are from central Norton County to western Mitchell County and indicate gradient of river at time of deposition of successive alluvial deposits. Based on topographic data of Bureau of Reclamation and subsurface data from test-holes. Locations of test-hole lines shown on Plate 3 are indicated at top of figure.
The lowest point in the area has an altitude of about 1,410 feet and is at the mouth of North Solomon River in Mitchell County. The highest point has an altitude of about 2,100 feet and is on the uplands near the valley in the western part of Phillips County.
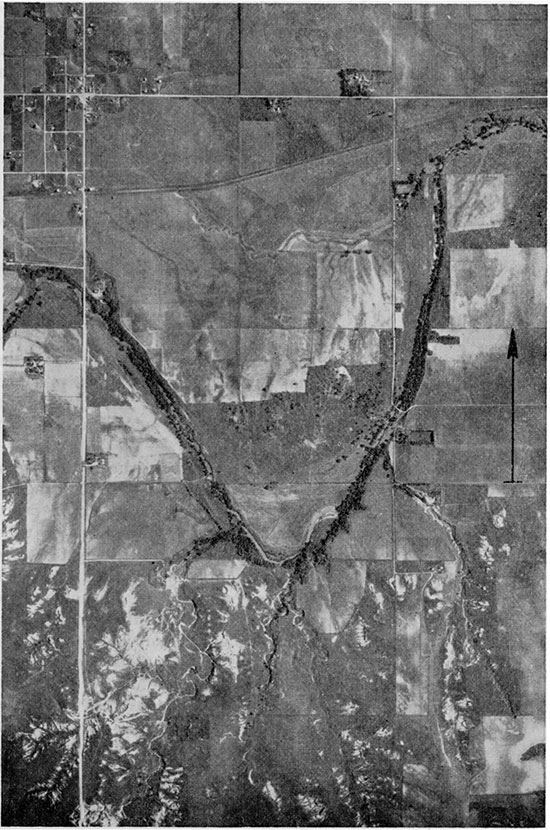
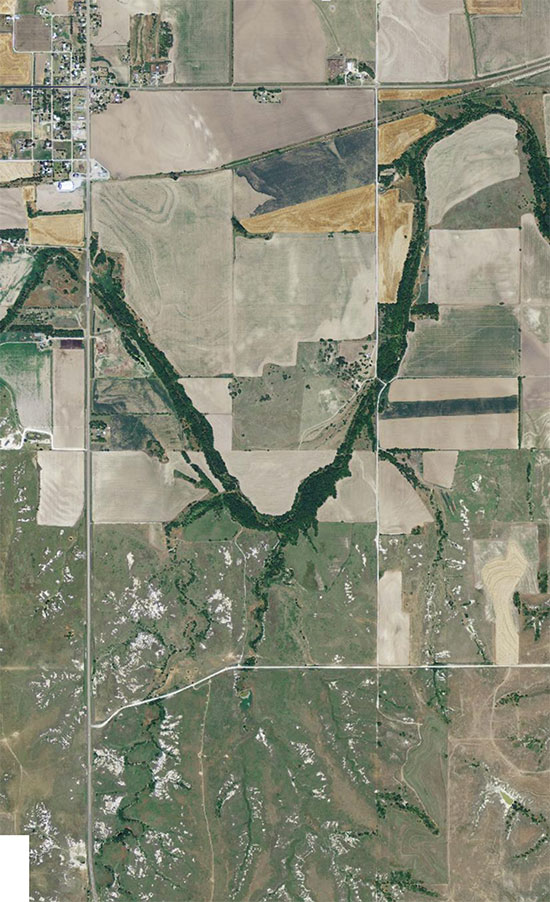
Like the other valleys in north-central Kansas, the valleys of North Solomon River and its principal tributaries are asymmetrical. Valleys of this type have been described by Bass (1949, pp. 17-23), Frye (1945, p. 29), and Frye and Leonard (1929, p. 14). Typically developed asymmetrical valleys have precipitous south walls and gently sloping north walls, as illustrated by cross sections B-B' and D-D' on Plate 3. These features are accounted for, in part, by local Pleistocene stream deposits and loess in a high terrace position on the north side of the valley. Southeast of Portis, in Osborne County, stream deposits of the Crete member of the Sanborn formation and the Meade formation occur in successively higher terraces on the south side of the valley, and the valley has a pronounced asymmetry with the steep wall on the north. Where the south valley wall is formed by the chalk of the Niobrara formation and the north wall is formed by unconsolidated Pleistocene deposits, the drainage pattern in the chalk hills is very fine-textured, whereas in the areas of Pleistocene deposits it is coarser (Pl. 5).
Plate 5--Aerial photograph of the North Solomon Valley near Glade showing contrast between fine-textured drainage pattern developed in the Niobrara bedrock and coarse-textured pattern in unconsolidated Pleistocene deposits north of the river. Arrow points north and is half a mile long. (Photo by U. S. Department of Agriculture.) [Color version from 2012 aerial photos.]
Most of the streams shown on Plate 1 are ephemeral and flow only after precipitation. Several of the larger tributaries are intermittent, and Bow Creek and North Solomon River are perennial streams.
Climate
Normal conditions--The part of the North Solomon Valley covered by this report has a subhumid climate. Days are hot during the summer, but the nights are generally cool. Low relative humidity and a good breeze help to relieve the summer heat. Winters are normally moderate, with light snowfall and only occasional short periods of severe cold.
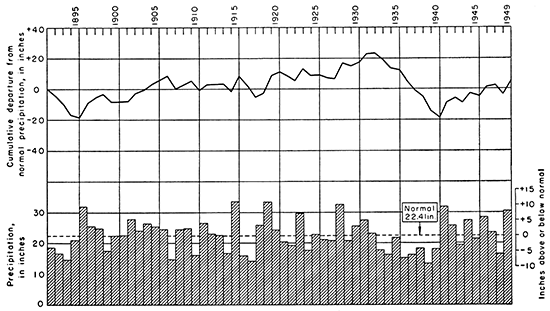
According to records of the U. S. Weather Bureau, the normal annual precipitation in this area averages about 22.57 inches, of which 75 percent falls during the growing season, from April to September. Four weather stations are located only a few miles from the North Solomon Valley but none is in the immediate area. A summary of the climatic data at these four stations is given in Table 1. The relation of the annual precipitation to the normal precipitation at the Weather Bureau stations at Alton, Smith Center, and Phillipsburg are shown graphically in Figures 4, 5, and 6. The Alton and Cawker City stations are in valley areas, and those at Smith Center and Phillipsburg are in the uplands.
Table 1--Summary of climatic data recorded at four Weather Bureau stations near the North Solomon Valley
| Station | ||||
|---|---|---|---|---|
| Cawker City* |
Alton | Smith Center* |
Phillipsburg | |
| Length of record, in years | 33 | 46 | 38 | 57 |
| Normal annual precipitation, inches | 23.55 | 21.63 | 22.68 | 22.41 |
| Normal precipitation from April 1 to September 30, inches | 17.77 | 16.42 | 17.34 | 17.30 |
| Minimum annual precipitation, inches | 15.98* | 12.78 | 10.02 | 13.36 |
| Year of minimum annual precipitation | 1936 | 1917 | 1934 | 1939 |
| Maximum annual precipitation. inches | 39.26 | 33.68 | 35.47 | 33.51 |
| Year of maximum annual precipitation | 1919 | 1902 | 1946 | 1919 |
| Average date of last killing frost in spring | April 27 | April 26 | ||
| Latest recorded spring frost | May 29 | May 29 | ||
| Average date of first killing frost in fall | Oct. 12 | Oct. 10 | ||
| Earliest recorded fall frost | Sept. 17 | Sept. 9 | ||
| Average growing season, in days | 168 | 167 | ||
| Mean annual temperature, degrees F | 54.4 | 53.7 | ||
| January mean temperature, degrees F | 27.6 | 27.9 | ||
| July mean temperature, degrees F | 80.2 | 80.0 | ||
| *Incomplete record. | ||||
Figure 4--Annual precipitation and cumulative departure from normal precipitation near Alton.
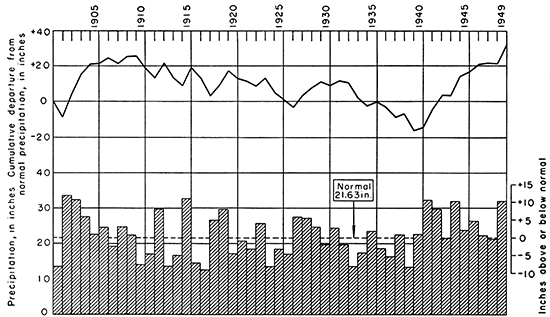
Figure 5--Annual precipitation and cumulative departure from normal precipitation at Smith Center.
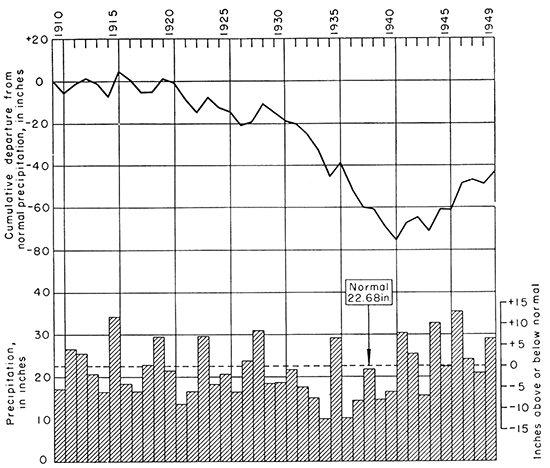
Figure 6--Annual precipitation and cumulative departure from normal precipitation at Phillipsburg.
The average length of the growing season is about 167 days. July, the hottest month, has a mean temperature of 80.2° F. at Alton and 80° F. at Phillipsburg. The coldest month is January, which has a mean temperature of 27.6° F. at Alton and 27.9° F. at Phillipsburg. The mean annual temperature is 54.4° F. at Alton and 53.7° F. at Phillipsburg.
Drought--The normal climatic classification of this part of Kansas is subhumid, but periodic seasons of deficient precipitation have been recorded since the first permanent settlements about 75 years ago. Hoyt (1936, p. 2) suggests that a drought condition exists when precipitation is less than 85 percent of normal. Accordingly, he lists seven major drought years for Kansas (1890, 1894, 1901, 1910, 1917, 1933, and 1934), from the earliest Weather Bureau records until 1935. These were followed by droughts during 1936, 1937, and 1939; thus 10 droughts occurred during the 60-year period 1890-1949.
Weather stations were established at Phillipsburg in 1892 and at Alton in 1894. Precipitation records show that since then Phillipsburg has had 18 seasons and Alton 15 seasons when precipitation was less than 85 percent of normal. However, during only nine of these seasons were drought conditions experienced at both stations. In fact, such conditions did not prevail at Alton during the statewide droughts of 1894 and 1936, nor at Phillipsburg during the general drought of 1901. Drought conditions prevailed at both stations during 1910, 1914, 1916, 1917, 1924, 1933, 1934, 1937, and 1939. During the 4-year period from 1914 to 1917 this area had three drought seasons, but because of the abnormally high precipitation during 1915, the average annual precipitation for the 4 years was 19.12 inches at Alton and 20.09 inches at Phillipsburg. Probably the only drought period that might be classed as severe during the entire period of record is that of 1933-1939, when the average annual precipitation was only 16.97 inches at Phillipsburg and 17.80 inches at Alton.
Droughts have occurred every few years at irregular intervals since precipitation records have been kept in this area. During these periods the combination of deficient precipitation and hot drying winds is generally ruinous to cultivated crops. Fortunately, two or more drought seasons are rarely successive and drought periods are balanced by periods of above-normal precipitation. Weather records also indicate that even during widespread droughts some local areas are not seriously affected.
Population
According to the 1950 census, Osborne, Phillips, and Smith Counties had a combined population of 26,677, a rural population of 13,427, and a rural population density of 5.0 persons per square mile. The population density for the more thickly settled valley area is somewhat greater than the average for the counties. The total population of the approximately 225-square-mile area covered by this report is estimated at 5,000 persons, of which 3,234 live in the cities of Cedar, Downs, Gaylord, Glade, Kirwin, Logan, Portis, and Speed.
Transportation
In the North Solomon Valley, the Lenora branch of the Missouri Pacific Railroad runs from Downs to its terminus at Lenora in Norton County. At Downs this branch line connects with the Stockton branch, which connects with a larger branch line of the Missouri Pacific at Jamestown in Cloud County. The Lenora branch is an important carrier in this area, transporting many of the principal grain crops.
An excellent system of hard-surfaced Federal and State highways serves this area (Pl. 1). U. S. Highway 24 traverses the eastern part of the area through Cawker City and Downs. U. S. Highway 281 passes through the eastern part of the area in a north-south direction, following the valley from south of Portis to 3 miles east of Gaylord. Kansas Highway 9 traverses the entire valley area; it follows the same route as U. S. Highway 24 from Cawker City to south of Portis, the route of U. S. Highway 281 to the junction east of Gaylord, and parallels North Solomon River on the north side of the valley until it passes into Norton County, 2 miles west of Logan. Kansas Highway 181 crosses the area from north to south through Downs and U. S. Highway 183 crosses the valley similarly through Glade. A system of improved county roads connects with these main highways.
Agriculture
The soils in the North Solomon Valley are primarily fertile silty clay-loam soils derived from reworked loess which was carried into the valley by tributary streams. Almost all the land in the valley area is cultivated, agriculture being the chief occupation. The most important crops are wheat and corn. In Phillips and Smith Counties the total acreage of corn about equals that of wheat, but in the valley areas corn is the most important crop. Other crops are sorghum, oats, and alfalfa. Surface water pumped from North Solomon River is used to irrigate some tracts in a few areas.
Much of the area bordering the valley is too steep for cultivation or has a rocky soil formed on the chalk and limestone rocks. Much of this area is range land used to pasture cattle. Many farms contain an upland area of range land and a valley area that is cultivated. Forty percent of the farm land in Smith, Phillips, and Osborne Counties is pasture land.
Mineral Resources
The principal mineral resources of the North Solomon Valley area, aside from ground water, are petroleum, chalk, ceramic materials, and construction materials.
Oil and gas--No gas is produced in this area, but oil is produced from the Logan pool, which is just south of Logan in the North Solomon Valley, and from several pools a few miles south of the valley, in southwestern Phillips County. Oil was discovered in this area in the Bow Creek pool in 1939. The Ray pool was discovered in 1940, the Hansen pool in 1943, and the Logan pool in 1945. Production is from the Reagan sandstone, Arbuckle rocks, and Kansas City-Lansing limestones.
The Logan pool was discovered in November 1945 from a well in the NW NW SE sec. 3, T. 5 S., R. 20 W., which produced oil from porous zones in the Arbuckle dolomite at depths of 3,381 to 3,387 and 3,391 to 3,404 feet. The well was plugged back to the Kansas City-Lansing limestone and gave an initial production of 201 barrels of oil a day (Ver Wiebe, 1946, p. 58). Three new oil wells were drilled in this pool in 1946 (Ver Wiebe, 1947, p. 62), five in 1947 (Ver Wiebe and others, 1948, table 51), and one during 1948 (Ver Wiebe, Jewett, Nixon, 1949, p. 124). By the end of 1950 this pool had produced 256,731 barrels of oil (Ver Wiebe and others, 1951, table 62).
Chalk--Chalk for whiting produced at a small quarry in the SW NW sec. 36, T. 4 S., R. 15 W., is trucked to Cedar, and is shipped via the Missouri Pacific Railroad. Several carloads are produced annually. Before being shipped, the chalk is broken into small boulders and the visible concretions of pyrite are chipped out by hand. This chalk occurs as fine-grained dense massive limestone beds in the Fort Hays limestone member of the Niobrara formation. Chalk from this member is quarried in northern Jewell County for use in the manufacture of Portland cement. It has also been used in this area as building stone and construction material, and it is well suited for use as industrial or agricultural lime. The chalk when processed with the underlying shale has also proved to be a satisfactory source of rock-wool material (Plummer, 1937, pp. 59-60). A chemical analysis of the chalk from the quarry near Cedar was made in the laboratory of the State Geological Survey (Table 2).
Table 2--Analysis of chalk from quarry near Cedar
| Component | Percent of total |
|---|---|
| SiO2 | 1.09 |
| Al2O3 | .50 |
| Fe2O3 + TiO2 | .10 |
| CaO | 55.01 |
| MgO | 1.08 |
| P2O5 | trace |
| Ignition loss 140-1,000° C. | 42.96 |
| Total | 100.74 |
| CaCO2 calculated 98.09 | |
| MgCO2 calculated 2.26 | |
Ceramic materials--Clays suitable for the manufacture of certain ceramic products are found in the Sanborn formation throughout this area. The State Geological Survey has made a study (Frye and others, 1949) of the ceramic uses of these beds in northern Kansas. This study shows (pp. 80-83) that the silts and soil zones of the Sanborn formation are the most suitable for the manufacture of brick, tile, and ceramic aggregate. Ceramic aggregate is used for concrete aggregate, road metal, and ballast. Clay that is usable in the manufacture of aggregate is present in the Loveland silt member of the Sanborn formation at a locality north of Speed (SW SW sec. 24, T. 4 S., R. 19 W.).
Construction materials--Rocks from three formations, the Greenhorn limestone, the Niobrara formation, and the Ogallala formation, have been used for building and foundation stone in this area. The limestone bed in the Greenhorn that has been used most extensively is the Fencepost bed at the top of the formation. Along its area of outcrop, the limestone is commonly used for building stone, fence posts, and flagstones. The county courthouse in Beloit is built of limestone from this bed.
The Fort Hays limestone member of the Niobrara formation also has been quarried for use as building stone. It is not as durable as the Fencepost limestone and crumbles badly when used for foundations. Several buildings in Kirwin are built of this stone.
The third rock used for building stone is the green "quartzite" of the Ogallala formation; it is quarried just south of North Solomon River in western Phillips County. Tests show that this rock is unsuitable for use as concrete aggregate (Frye and Swineford, 1946) because of the reaction between the opaline cement in the "quartzite" and the alkali in the cement.
Each of the three building stones discussed above has been crushed for use as road metal. The quartzite breaks into sharp jagged fragments which damage tires and the chalk of the Fort Hays limestone member disintegrates rapidly under traffic conditions. The Greenhorn limestone makes a satisfactory road material, and in Mitchell County it is generally crushed together with the underlying shales and thin limestones. The shale aids in packing and the combined material makes a hard serviceable all-weather road.
Sand and gravel deposits are fairly common in the valley area and have been quarried at many pits. The best gravel for most construction purposes contains a minimum amount of limestone pebbles and silt. The gravel in the Meade formation, which is being quarried at a pit in the NW sec. 11, T. 6 S., R. 13 W., and the gravel deposits from the Recent alluvium, which are being mined by hydraulic methods at Speed, are probably most suitable for concrete aggregate, road material, and general construction use. Gravel and sand have been obtained from several small pits in the Crete member of the Sanborn formation in western Phillips County, but these deposits contain a high percentage of fine material. In Osborne County, several pits for obtaining local highway material have been opened in limestone gravel deposits that were derived from the Fort Hays limestone member of the Niobrara formation (Pl. 1). This gravel contains silt and clay from the Sanborn formation and the Carlile shale; these bind the coarser material together to form a hard smooth road surface.
Prev Page--Introduction || Next Page--Geology
Kansas Geological Survey, Geology
Placed on web May 24, 2014; originally published November 1952.
Comments to webadmin@kgs.ku.edu
The URL for this page is http://www.kgs.ku.edu/Publications/Bulletins/98/03_geog.html