![]()
Prev Page--Ground water || Next Page--Formations
Quality of Water
The chemical character of ground water in Rice County is indicated by the analyses of 31 samples of water given in Table 3. The analyses were made by Howard A. Stoltenberg in the Water and Sewage Laboratory of the Kansas State Board of Health. The samples were collected from different water-bearing formations, and from some of the areas of possible contamination by mineralized water from industrial wastes. Analyses of all municipal supplies are given in Table 3.
Table 3---Analyses of water from typical wells and test holes in Rice County. Analyzed by H. A. Stoltenberg. Dissolved constituents given in parts per million,1 and in equivalents per million 2 [in italics].
| Well Designation | Depth (feet) |
Geologic source | Date of collection |
Temp. (°F) |
Dissolved solids |
Silica (SiO2) |
Iron (Fe) |
Calcium (Ca) |
Magnesium (Mg) |
Sodium and potassium (Na+K) |
Bicarbonate (HCO3) |
Sulfate (SO4) |
Chloride (Cl) |
Fluoride (F) |
Nitrate (NO3) |
Hardness as CaCO3 | ||
|---|---|---|---|---|---|---|---|---|---|---|---|---|---|---|---|---|---|---|
| Total | Carbonate | Non- carbonate |
||||||||||||||||
| 17-8-26dd | 803 | Dakota | 1-7-1947 | 274 | 13 | 0.02 | 73 3.64 |
6 .49 |
12 .51 |
203 3.33 |
11 .23 |
28 .79 |
0.3 .02 |
17.27 | 206 | 166 | 40 | |
| 18-6-8ba | 72.2 | Dakota and Kiowa | 12-20-1945 | 56 | 1,176 | 12 | 1.9 | 219 10.93 |
40 3.29 |
130 5.66 |
234 3.84 |
161 3.35 |
383 10.80 |
.7 .04 |
115 1.85 |
711 | 192 | 519 |
| 18-6-22cd | 35.2 | Dakota | 12-17-1945 | 54 | 465 | 20 | .34 | 107 5.34 |
8.6 .71 |
36 1.57 |
165 2.71 |
45 .94 |
105 2.96 |
.2 .01 |
62 1.0 |
302 | 136 | 166 |
| 18-6-29dd | 47.93 | Kiowa | 3-22-1946 | 289 | 16 | .06 | 68 3.39 |
8.2 .67 |
17 .73 |
227 3.72 |
15 .31 |
18 .51 |
.2 .01 |
15 .24 |
203 | 186 | 17 | |
| 18-7-14dd | 25 | Kiowa | 12-17-1945 | 51 | 404 | 9.2 | .25 | 75 3.74 |
17 1.40 |
50 2.18 |
278 4.56 |
30 .62 |
60 1.69 |
.9 .05 |
25 .40 |
257 | 288 | 29 |
| 18-8-17cc | 55.7 | Dakota | 12-17-1945 | 51 | 590 | 22 | .36 | 152 7.58 |
14 1.15 |
34 1.49 |
289 4.74 |
23 .48 |
141 3.98 |
.3 .02 |
62 1.00 |
436 | 237 | 199 |
| 18-9-1db | 50 | Dakota | 2-22-1947 | 655 | 19 | .70 | 150 7.48 |
17 1.40 |
64 2.80 |
294 4.82 |
34 .71 |
206 5.81 |
.6 .03 |
19 .31 |
444 | 241 | 203 | |
| 18-9-7da | 85 | Dakota | 12-17-1945 | 57 | 396 | 21 | .75 | 93 4.64 |
10 .82 |
37 1.59 |
336 5.51 |
21 .44 |
26 .73 |
.3 .02 |
22 .35 |
273 | 273d | 0 |
| 18-10-2ac | 993 | Dakota | 12-16-1946 | 365 | 16 | .03 | 97 4.84 |
11 .90 |
20 .87 |
329 5.40 |
14 .29 |
27 .76 |
.4 .02 |
8.9 .14 |
287 | 270 | 17 | |
| 18-10-14bc | 95 | Dakota | 12-17-1945 | 56 | 500 | 13 | 4.7 | 110 5.49 |
16 1.32 |
56 2.45 |
324 5.31 |
22 .46 |
122 3.44 |
.7 .04 |
.62 .01 |
340 | 266 | 74 |
| 18-10-16bb | 40 | Sanborn | 2-21-1947 | 1,004 | 24 | .23 | 254 12.67 |
20 1.64 |
78 3.40 |
306 5.02 |
34 .71 |
400 11.28 |
.2 .01 |
43 .69 |
716 | 251 | 465 | |
| 19-6-2aa | 12 | Kiowa | 12-20-1945 | 55 | 521 | 14 | .63 | 97 4.84 |
22 1.81 |
44 1.93 |
229 3.76 |
44 .92 |
72 2.03 |
.4 .02 |
115 1.86 |
332 | 188 | 144 |
| 19-6-17ab | 47.3 | Alluvium | 1-13-1940 | 685 | 29 | .76 | 164 8.18 |
20 1.64 |
32 1.41 |
427 7.00 |
84 1.75 |
84 2.37 |
.1 .01 |
7.1 .11 |
491 | 350 | 141 | |
| 19-7-6aa | 65 | Dakota | 12-17-1945 | 51 | 413 | 17 | 3.2 | 116 5.79 |
16 1.32 |
13 .56 |
378 6.20 |
12 .25 |
29 .82 |
.6 .03 |
23 .37 |
356 | 310 | 46 |
| 19-8-9bc | 25 | Dakota | 12-17-1945 | 64 | 537 | 20 | .13 | 129 6.44 |
12 .99 |
34 1.46 |
298 4.89 |
31 .64 |
58 1.64 |
.2 .01 |
106 1.71 |
372 | 244 | 128 |
| 19-9-15dc | 80 | Dakota | 12-17-1945 | 57 | 569 | 18 | .59 | 105 5.24 |
20 1.64 |
80 3.46 |
316 5.18 |
28 .58 |
161 4.54 |
.3 .01 |
.97 .02 |
344 | 259 | 85 |
| 19-9-30dd (TH) | 164 | Chase Channel | 8-2-1946 | 61 | 5,431 | 33 | .63 | 203 10.13 |
130 10.69 |
1,644 71.47 |
288 4.72 |
652 13.56 |
2,620 73.88 |
.6 .03 |
6.2 .10 |
1,041 | 236 | 805 |
| 19-9-31ac | 62 | Todd Valley | 12-11-1946 | 372 | 15 | .08 | 66 3.29 |
7.6 .62 |
57 2.49 |
256 4.20 |
23 .48 |
58 1.64 |
.3 .02 |
3.5 .06 |
196 | 196f | 0 | |
| 20-6-6cd | 24.3 | Kiowa | 12-20-1945 | 53 | 1,259 | 16 | 1.6 | 170 8.48 |
41 3.37 |
186 8.11 |
373 6.12 |
140 2.91 |
207 5.84 |
.6 .03 |
314 5.06 |
592 | 306 | 286 |
| 20-6-16dd | Kiowa | 12-20-1945 | 58 | 936 | 15 | .10 | 185 9.23 |
34 2.79 |
68 2.96 |
383 6.28 |
89 1.85 |
90 2.54 |
.5 .03 |
266 4.28 |
601 | 314 | 287 | |
| 20-8-9dd | 603 | Alluvium | 1-14-1947 | 639 | 21 | 0 | 91 4.54 |
17 1.40 |
113 4.90 |
326 5.35 |
49 1.01 |
156 4.40 |
.3 .02 |
3.1 .05 |
297 | 267 | 30 | |
| 20-9-2dd (TH) | 106 | Chase Channel | 10-3-1946 | 60 | 2,281 | 33 | .06 | 177 8.83 |
74 6.08 |
551 23.95 |
274 4.49 |
346 7.20 |
960 27.07 |
.5 .03 |
4.4 .07 |
746 | 224 | 522 |
| 20-9-10cd (TH) | 118 | Meade | 10-12-1946 | 59 | 472 | 32 | .11 | 78 3.89 |
9.8 .80 |
81 3.53 |
312 5.12 |
24 .50 |
90 2.54 |
.3 .02 |
2.5 .04 |
234 | 234g | 0 |
| 21-7-15dd (TH) | 61 | Alluvium | 9-26-1946 | 59 | 366 | 16 | .27 | 54 2.69 |
13 1.07 |
62 2.70 |
244 4.00 |
49 1.02 |
48 1.35 |
.5 .03 |
3.8 .06 |
188 | 188h | 0 |
| 21-7-20aa (TH) | 65 | Terrace | 9-27-1946 | 59 | 392 | 16 | .25 | 54 2.69 |
14 1.15 |
70 3.05 |
242 3.97 |
66 1.16 |
60 1.69 |
.6 .03 |
2.7 .04 |
192 | 192i | 0 |
| 21-8-11aa (TH) | 88 | Terrace | 11-13-1946 | 59 | 323 | 15 | 0 | 52 2.59 |
12 .99 |
50 2.16 |
224 3.67 |
37 .77 |
43 1.21 |
.5 .03 |
3.8 .06 |
179 | 179j | 0 |
| 21-8-16bb (TH) | 39 | Terrace | 10-1-1946 | 58 | 390 | 12 | .75 | 63 3.14 |
12 .99 |
60 2.59 |
210 3.44 |
61 1.27 |
47 1.32 |
.7 .04 |
23 .37 |
206 | 186 | 20 |
| 21-8-16bb (TH) | 87 | Terrace | 10-1-1946 | 60 | 397 | 11 | .66 | 65 3.24 |
15 1.23 |
58 2.52 |
212 3.48 |
61 1.27 |
58 1.64 |
.7 .04 |
15 .24 |
224 | 190 | 34 |
| 21-8-21ba | 383 | Terrace | 5-31-1946 | 683 | 15 | .06 | 92 4.59 |
22 1.81 |
111 4.81 |
310 5.08 |
112 2.33 |
121 3.41 |
1.4 .07 |
20 .32 |
320 | 254 | 66 | |
| 21-8-21bb | 92 | Terrace | 8-21-1946 | 721 | 13 | .04 | 96 4.79 |
23 1.89 |
126 5.48 |
310 5.08 |
115 2.39 |
147 4.15 |
1.1 .06 |
30 .48 |
334 | 254 | 80 | |
| 21-8-22bb (TH) | 86 | Terrace | 9-30-1946 | 59 | 1,871 | 21 | .85 | 221 11.03 |
60 4.93 |
314 13.67 |
222 3.64 |
847 17.62 |
292 8.23 |
1.0 .05 |
5.8 .09 |
798 | 182 | 616 |
| 1. One part per million is equivalent to one pound of substance per million pounds of water or 8.33 pounds per million gallons of water. 2. An equivalent per million is a unit chemical equivalent weight of solute per million unit weights of solution. Concentration in equivalents per million is calculated by dividing the concentration in parts per million by the chemical combining weight of the substance or ion. 3. Composite sample of more than one well. | ||||||||||||||||||
Chemical Constituents in Relation to Use
The following discussion of the chemical constituents of ground water has been adapted from publications of the United States Geological Survey and the State Geological Survey of Kansas.
Dissolved Solids
Ground water dissolves some of the rock materials with which it comes in contact. The kind and quantity of these materials present in the water, which reflect the conditions of its environment, determine its suitability for various uses. Water containing less than 500 parts per million of dissolved solids generally is satisfactory for domestic use, except for difficulties resulting from hardness or from some elements that may have adverse effects when occurring in only minor quantities. Water containing dissolved solids in concentrations of more than 1,000 parts per million is likely to be unsuitable for most uses.
Determination of the dissolved solids was made for 31 samples of water from wells and test holes in Rice County. Fourteen of the samples contained less than 500 parts per million of dissolved solids, 11 contained more than 500 parts per million, but less than 1,000, and 5 samples contained more than 1,000 parts per million of dissolved solids.
Hardness
The hardness of water is caused largely by the salts of calcium and magnesium. These materials react with soap to form a sticky curd and also cause scale on vessels in which water is heated. Carbonate hardness, sometimes called temporary hardness, is caused largely by calcium and magnesium bicarbonates and can be removed by boiling. Noncarbonate hardness, often called permanent hardness, is caused by the sulfates or chlorides of calcium and magnesium and is not removed by boiling. Water having a hardness of less than 50 parts per million is generally considered soft and treatment for removal of hardness is usually unnecessary. A hardness of between 50 and 150 parts per million, though satisfactory for most purposes, increases the consumption of soap and causes considerable scale in boilers. If the hardness of a water is as much as 200 or 300 parts per million, it is often treated to reduce hardness to the point where it is suitable for household use. Water for municipal supplies, where softening treatment is used, is usually reduced in hardness to 60 or 80 parts per million.
Ground water in Rice County is generally quite hard. None of the 31 wells sampled yielded water with a hardness below 179 parts per million. Only 13 samples contained less than 300 parts per million and 10 samples contained more than 400 parts per million of hardness.
Iron
A small quantity of iron gives the water a disagreeable taste and causes stain on vessels in which it is heated. The presence of more than 0.3 parts per million of iron usually results in a reddish sediment which precipitates after the water is exposed to air. Iron can usually be removed by simple aeration and filtration, but a few waters require additional treatment.
A high iron content is common in Rice County ground water. Fifteen of the 31 samples collected for analysis contained more than 0.3 parts per million of iron.
Fluoride
Usually only small quantities of fluoride are present in ground waters. It is desirable to know the amount of fluoride in water that is to be consumed by children as fluoride in drinking water has been shown to be associated with a dental defect known as mottled enamel. Water containing about 1.5 parts per million or more of fluoride is likely to produce mottled enamel (Dean, 1936). If as much as 4 parts per million of fluoride is present, 90 percent of the children drinking the water are likely to have mottled enamel and 35 percent or more of the cases will be classed as moderate or worse. The presence of fluoride in quantities less than about 1.5 parts per million will not have a measurable effect upon the quality of tooth enamel and may have a beneficial effect in decreasing the incidence of dental caries (Dean, Arnold, and Elvove, 1942).
Water from wells 21-8-21bb and 21-8-21ba contained 1.1 and 1.4 parts per million of fluoride, respectively. Water from well 21-8- 22bb contained 1 part per million. All other samples tested contained less than 1 part per million.
Sanitary Considerations
The analyses of water in Table 3 give only the dissolved mineral constituents and do not show the sanitary quality of the water. An abnormal amount of certain minerals, such as nitrates or chlorides, however, may indicate pollution of the water.
Wells in which a considerable thickness of relatively impermeable silt or clay overlies the aquifer, if properly cased and protected at the top from surface drainage, are less subject to pollution than shallow dug or driven wells or wells in which the permeable material extends to the surface. A high nitrate content is present in many poorly sealed dug wells in Rice County penetrating the Cretaceous sandstone where this formation crops out at the surface around the well.
Quality in Relation to Stratigraphy
The quality of the water in relation to the principal water-bearing formations is shown graphically in Figure 8. The softest water with the lowest mineral content is found in the late Wisconsinan terraces in south-central Rice County and in the Chase Channel. Highly mineralized water may be encountered locally, however. The mineral content is objectionable at many places near Arkansas River, in a belt 1 to 3 miles wide on both sides of the river, and is usually high at the base of gravel deposits resting on Permian shale. The sandstones of the Dakota formation and of the Marquette member of the Kiowa shale usually yield water of uniformly good quality, second only to the gravels of the Wisconsinan terraces. The sandstones of the Windom and Natural Corral members of the Kiowa and the shales and siltstones of Permian Age yield highly mineralized water.
Figure 8--Analyses of waters from the principal water-bearing formations in Rice County.
.jpg)
Quality Affected by Industrial Wastes
At the request of Ogden S. Jones, geologist in charge, Oil Field Section, Division of Sanitation, Kansas State Board of Health, special attention was given to the contamination of ground water by industrial wastes in Rice County. Many water samples were collected for analysis from test holes, wells, and streams near possible sources of contamination by industrial wastes. Samples collected from other areas in the county served as controls and helped to indicate the amount of natural mineralization of ground water. In most of the samples only the chloride content was determined as mineralization by either natural or industrial sources in Rice County is usually indicated by a high chloride content.
The chloride content, in parts per million, of 119 samples of water collected in Rice County is shown on Figure 9. Possible sources of contamination are shown by symbols given in the legend. The depths of wells and test holes from which samples were taken, as well as the points sampled and their position relative to possible sources of chloride, are given in Table 4. Complete analyses of the samples collected from streams are given in Table 5.
Figure 9--Map of Rice County showing the chloride content of water from wells, test holes, and streams.
.jpg)
Table 4--Chloride content of water samples collected from wells and test holes in Rice County.
| Location | Depth, feet1 |
Chloride, parts per million |
Remarks |
|---|---|---|---|
| T. 18 S., R. 6 W. | |||
| SE cor. NE sec. 2 | 10 | ||
| SW NE sec. 4 | 22.0 | 57 | |
| SW cor. sec. 6 | 61 | ||
| NE NW sec. 8 | 72.2 | 383 | |
| SE SW sec. 22 | 35.2 | 105 | |
| SE SE sec. 29 | 47.9 | 18 | |
| T. 18 S., R. 7 W. | |||
| SE SE sec. 14 | 25.0 | 60 | |
| NW NW sec. 21 | 280 | ||
| SW NW sec. 31 | 30.0 | 83 | |
| SW SE sec. 32 | 58.4 | 460 | |
| T. 18 S., R. 8 W. | |||
| SW cor. sec. 3 | 67 | ||
| SW SW sec. 17 | 55.7 | 141 | |
| T. 18 S., R. 9 W. | |||
| NW SE sec. 1 | 50 | 206 | |
| NW NW sec. 3 | 31.2 | 57 | |
| NE SE sec. 7 | 85 | 26 | |
| SW SW sec. 16 | 45 | 197 | |
| SE SE sec. 18 | 50 | 55 | |
| NW NW sec. 19 | 55 | 78 | |
| SE SW sec. 32 | 38.8 | 1..090 | |
| T. 18 S., R. 10 W. | |||
| NE cor. NW sec. 1 | 90 | 131 | |
| SW SE sec. 4 | 71.0 | 41 | |
| NW NE sec. 6 | 59.7 | 34 | |
| NE SE sec. 10 | 175 | 45 | |
| NW SW sec. 11 | 30 | 58 | |
| SW NW sec. 14 | 95 | 122 | |
| SE SE sec. 14 | 70 | 114 | |
| NW NW sec. 16 | 40 | 400 | |
| SW SE sec. 16 | 38.2 | 168 | |
| SE SW sec. 16 | 44.0 | 120 | |
| NE NE sec. 22 | 326 | ||
| NW NW sec. 22 | 50.3 | 167 | |
| T. 19 S., R. 6 W. | |||
| NE NE sec. 2 | 12 | 72 | |
| NW NE sec. 17 | 47.3 | 84 | |
| T. 19 S., R. 7 W. | |||
| NE NE sec. 6 | 65 | 29 | |
| NE SW sec. 21 | 85 | ||
| NW NW sec. 36 | 22.2 | 6..700 | Near abandoned oil well. |
| NW NW sec. 36 | 13.4 | 320 | |
| T. 19 S., R. 8 W. | |||
| SW NW sec. 9. | 25 | 58 | |
| SW SE sec. 30 | 52.8 | 356 | |
| T. 19 S., R. 9 W. | |||
| SE SE sec. 2 | 25.5 | 750 | |
| NE SE sec. 7 | 64.0 | 236 | |
| SW SE sec. 15 | 80 | 161 | |
| SW SW sec. 17 | 188 | ||
| SE cor. sec. 20 | 46-48 | 2,320 | |
| NE SE sec. 22 | 55.4 | 86 | |
| SW SE sec. 23 | 61.4 | 8 | |
| NE NW sec. 23 | 72.0 | 130 | |
| NW NW sec. 26 | 69.1 | 30 | |
| SE cor. sec. 27 | 76-78 | 910 | |
| SE cor. sec. 30 | 44-46 | 103 | |
| SE cor. sec. 30 | 162-164 | 2,620 | Channeled into Permian rocks. |
| SE NE sec. 31. | 62 | 58 | |
| SW SE sec. 32 | 308 | ||
| NW NE sec. 33 | 35 | 280 | |
| SW cor. sec. 35 | 89-91 | 426 | |
| T. 19 S., R. 10 W. | |||
| NW NW sec. 1 | 88.0 | 296 | |
| NW NW sec. 1 | 65.0 | 172 | |
| SE SE sec. 31. | 96.0 | 18 | |
| T. 20 S., R. 6 W. | |||
| SW SW sec. 6 | 24.3 | 207 | |
| SE SE sec. 16 | 90 | ||
| T. 20 S., R. 7 W. | |||
| NW SW sec. 6 | 47.3 | 31 | |
| SE cor. sec. 20 | 52-54 | 172 | |
| T. 20 S., R. 8 W. | |||
| SW SW sec. 6 | 52 | 99 | |
| NW cor. sec. 6 | 54-55 | 44 | |
| SE SE sec. 9 | 60 | 156 | |
| NW cor. NE NW sec. 14 | 65-67 | 21,800 | Near commercial salt-producing plant. |
| T. 20 S., R. 9 W. | |||
| SW cor. sec. 2 | 139-141 | 1,230 | Channeled into Permian rocks. |
| SW cor. sec. 2 | 31-33 | 150 | |
| SE cor. sec. 2 | 104-106 | 960 | Channeled into Permian rocks. |
| NW NW sec. 5 | 62.0 | 150 | |
| NE NE sec. 9 | 39 | ||
| NE NE sec. 9 | 38 | 38 | |
| SW SW sec. 10 | 34-36 | 12,055 | Near brine-disposal pond. |
| SE SW sec. 10 | 116-118 | 90 | |
| SE cor. sec; 10 | 28-30 | 62 | |
| SE cor. sec; 10 | 101-103 | 45 | |
| SE cor. sec; 10 | 166-168 | 800 | Channeled into Permian rocks. |
| SW SE sec. 10 | 188-190 | 945 | Channeled into Permian rocks. |
| SW SE sec. 10 | 115-117 | 107 | |
| SW SE sec. 10 | 42-44 | 196 | |
| SW SE sec. 10 | 118-120 | 72 | |
| SW SE sec. 10 | 38-40 | 680 | |
| NW NW sec. 11 | 31 | 79 | |
| NE NW sec. 17 | 45 | 31 | |
| NE NE sec. 18 | 75 | 27 | |
| NE NW sec. 18 | 50 | 25 | |
| T. 20 S., R. 10 W. | |||
| NE cor. sec. 1. | 28-50 | 67 | |
| SW cor. sec. 1. | 36 | 34 | |
| SW cor. sec. 1. | 122 | 28 | |
| SE SW sec. 7 | 52.7 | 115 | |
| SE SW sec. 9 | 20.51 | 19 | |
| SE cor. sec. 10 | 78-80 | 21 | |
| SW SE sec. 12 | 42 | ||
| SW SW sec. 12 | 62 | 25 | |
| NE SW sec. 27 | 39.5 | 49 | |
| NE SW sec. 27 | 25 | 55 | |
| NE SE SW sec. 27 | 460 | ||
| SW NE SW sec. 27 | 1,150 | Near abandoned oil well. | |
| T. 21 S., R. 6 W. | |||
| SE SW sec. 16 | 10 | ||
| SW SE sec. 16 | 15 | ||
| T. 21 S., R. 7 W. | |||
| NW cor. NE sec. 7 | 30 | 28 | |
| SW cor. sec. 13 | 59-61 | 17 | |
| SE cor. sec. 15 | 38-40 | 56 | |
| SE cor. sec. 15 | 59-61 | 48 | |
| NE cor. sec. 20 | 63-65 | 60 | |
| NW cor. sec. 22 | 51-53 | 56 | |
| NW cor. sec. 22 | 26-28 | 93 | |
| T. 21 S., R. 8 W. | |||
| NE cor. sec. 1. | 50-53 | 40 | |
| NE cor. sec. 11 | 86-88 | 43 | |
| SW cor. sec. 11 | 88-90 | 158 | |
| NW cor. sec. 16 | 37-39 | 47 | |
| NW cor. sec. 16 | 85-87 | 58 | |
| SE cor. sec. 20 | 26-27 | 430 | |
| NW NW sec. 21 | 92 | 147 | |
| NE NW sec. 21 | 38 | 121 | |
| NW cor. sec. 22 | 24-26 | 70 | |
| NW cor. sec. 22 | 84-86 | 292 | |
| T. 21 S., R. 9 W. | |||
| SE cor. sec. 36 | 39-37 | 350 | |
| SE cor. sec. 36 | 27-29 | 270 | |
| 1. Reported depths given to nearest foot, measured depths to the nearest tenth of a foot. Depth of samples taken from test holes given as interval at which screen was placed. |
|||
Figure 10 shows three test holes near a surface disposal pond for oil-field brine that were sampled at several horizons, and the chloride content of the ground water in parts per million at the points sampled. A fourth test hole outside the contaminated area is included for control. At this locality three zones of sand and gravel are separated by thick silt and clay bodies. The brine-disposal ponds are constructed in silt assumed to be relatively impermeable. The brine discharged into the pits contained 12,600 parts per million of chloride. The water pumped from the test hole nearest the pits, from a depth of 36 feet, contained 12,025 parts per million of chloride. This sample was taken from the Todd Valley sand and gravel which is the aquifer for most of the farm wells in the area. The chloride content of water from this aquifer from a farm well about 1 mile northwest of this test hole was 38 parts per million. Many other samples of water from this aquifer show a low chloride content where distant from sources of contamination. Figure 10 indicates that the second aquifer (Grand Island) is not affected by the highly mineralized water. The chloride content in the lowest aquifer (Holdrege) was found to be generally high in the Chase Channel where sampled. The high chloride content in this sand and gravel may be derived from the lower Kiowa and Permian rocks which form the channel floor and sides. Surface disposal of brine at this locality is reported to have been carried on continuously from 1936 to the time of this investigation in 1946. This group of tests and other chloride analyses from wells and test holes throughout the county indicate that surface disposal pits, even though constructed in silty soil, may cause local contamination.
Figure 10--Sketch map showing the location of ponds and test holes, and cross section showing sampling points in test holes near brine-disposal ponds and chloride content of water at the horizon from which the sample was taken.
.jpg)
There are many examples of contamination by brines where surface disposal pits or ditches are constructed in sand or sandy alluvium. Surface pits in dune sand in sees, 3 and 10, T. 21 S., R. 6 W. are receiving brine containing up to 89,500 parts per million of chloride. Water wells in sec. 3, T. 21 S., R. 6 W. are reported to have been abandoned as early as 1936, because of the intrusion of objectionable salt water. In sec. 2, T. 21 S., R. 6 W., wells also are reported to have become contaminated and in one well potable water is reported to have been found in the Permian shale beneath the contaminated fresh-water aquifer. Water samples from wells located upgrade from the oil field in this locality contained only 8 to 15 parts per million of chloride.
A quarter of a mile south of Silica, in western Rice County, oilfield brines were discharged into natural depressions in the sand dunes. Residents of Silica report that brine disposal into these ponds was discontinued about a year before the time of this investigation in 1946. A water sample taken from a well at the Wolf Mill in Silica in the NE SE sec. 31, T. 19 S., R. 10 W., which wars reported to be 76 feet deep and to end in sand and gravel, contained 2,660 parts per million of chloride. This well and others in the vicinity were abandoned after surface disposal of brines was begun in the area. One well in the SE cor. sec. 31, T. 19 S., R. 10 W., in the center of the area of contamination, which is reported to be cased to sandstone, yielded water containing only 18 parts per million of chloride. This indicates that the underlying Cretaceous sandstones in this area are probably not contaminated by the highchloride water in the overlying unconsolidated deposits.
Several cases of contamination of ground water in Rice County are evidently the result of improperly plugged abandoned oil wells. In the NW cor. sec. 36, T. 19 S., R. 7 W., a domestic and stock well was abandoned in 1943 when it became too salty for use. The water from this well contained 6,700 parts per million of chloride in 1946. The well is in sandstone of the Marquette member of the Kiowa shale. An abandoned oil test well, just west of the salty water well in the NE cor. sec. 35, is the only known possible source for the high chlorides. The movement of ground water, as shown by the water table contours (Pl. 1), is from west to east at this point.
Brine used by salt-processing plants in Lyons is allowed to flow in a surface ditch between the plant in sec. 10, T. 20 S., R. 8 W., and the brine recovery wells in sec. 15, T. 20 S., R. 8 W. In dry seasons white saline deposits occur at the borders of this ditch and in Owl Creek, east of the ditch. Farm wells east of this ditch have been abandoned progressively eastward. Water pumped from the base of the alluvial materials in a test hole 0.8 of a mile east of this ditch and brine-recovery field contained 21,800 parts per million of chloride in 1946. The Lyons municipal wells, about half a mile west of the brine ditch, which obtain water from the entire thickness of saturated alluvial material, contained only 101 parts per million of chloride. The movement of ground water in this area is to the southeast.
The supposed principle of operation of surface disposal pits for brine is evaporation. The evaporation of water from a free surface in Rice County during the months of highest evaporation, April to October, is about 76 inches. The average rainfall during the same period is about 21 inches. This leaves an effective evaporation from surface storage ponds of 55 inches. The two brine pits in sec. 10, T. 20 S., R. 9 W., near which the test holes shown in Figure 10 were drilled, have a combined surface area of 23,100 square feet. Assuming the same rate of evaporation as from a free water surface, these pits would lose about 791,369 gallons by evaporation. The measured rate of 7 gallons a minute for brine flowing into the ponds would add 1,814,400 gallons in the 6-month period, an excess of 1,023,031 gallons over effective evaporation in the summer months. This figure is probably low, because the brine will evaporate slower than fresh water and the surface of both pits is usually partly covered by a thin film of oil, which retards evaporation. The excess in the winter months, with a lower evaporation rate, also would be greater than the April to October excess. The excess brine must be released at the surface or seep into the soil and eventually into the underlying aquifers.
A striking demonstration of the fact that seepage into the soil predominates over evaporation as the factor in brine disposal in surface pits is found in the comparison of size of the pits in silt in sec. 10, T. 20 S., R. 9 W., which are 165 by 70 feet each, and the pit in dune sand shown in Plate 4C, which is less than 10 feet in diameter.
Data collected during the course of this investigation seem to indicate, in general, that (1) wells in areas of dune sand over materials of low permeability are most susceptible to contamination by surface discharge of brine; (2) wells in well-sorted, very permeable alluvium and near the source of contamination are affected, but wells a short distance away from the source are affected only slightly, probably because of dilution; (3) wells in silt in contaminated regions are likely to have a very high chloride content or are seemingly entirely unaffected; (4) wells in fine sand or poorly sorted sand, silt, and gravel are more likely to be affected, but dilution is greater than in silt areas.
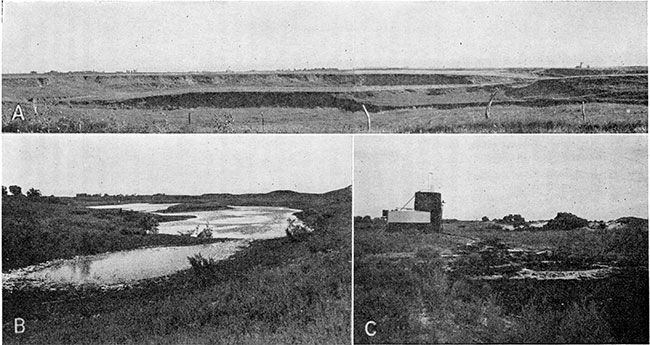
Plate 4--A, Tributary stream valley in the NE sec. 33, T. 18 S., R. 10 W., showing meandering stream incised into the late Wisconsinan terrace material. The flat upland typical of northern Rice County is shown by the level sky line in the background. B, Interdune water-table pond in the NE sec. 17, T. 20 S., R. 10 W. C, Disposal pit in the NE NE sec. 10, T. 21 S., R. 6 W. Oil-field brine containing 89,500 parts per million of chloride is being discharged into a small "evaporation" pit constructed in dune sand. Farm wells in the area have been abandoned because of salt water intrusion. (Photograph by B. F. Latta.)
Quality of Water in Streams
Water samples for analysis were taken from streams at 12 points in Rice County. These samples were taken at low water stage when most of the water was derived from ground water. Because each point was sampled only once, the samples may not represent the average chemical characteristics of the streams. The results of these analyses, however, are in accord with the chloride tests made on streams in this area in 1934-36 by the U. S. Bureau of Mines and the Kansas State Board of Health (Wilhelm and others, 1936, pp. 17-19). The analyses of samples taken are given in Table 5.
Table 5--Analyses of water from streams in Rice County. Analyzed by H. A. Stoltenberg. Dissolved constituents given in parts per million 1, and in equivalents per million 2 [in italics].
| Location number3 |
Name of stream |
Date of collection |
Temp. (°F) |
Dissolved solids |
Silica (SiO2) |
Iron (Fe) |
Calcium (Ca) |
Magnesium (Mg) |
Sodium and potassium (Na+K) |
Bicarbonate (HCO3) |
Sulfate (SO4) |
Chloride (Cl) |
Fluoride (F) |
Nitrate (NO3) |
Hardness as CaCO3 | ||
|---|---|---|---|---|---|---|---|---|---|---|---|---|---|---|---|---|---|
| Total | Carbonate | Non- carbonate |
|||||||||||||||
| 18-10-31bb | Cow Creek | 12-17-45 | 32 | 2,130 | 22.0 | 0.20 | 215 10.73 |
54 4.44 |
512 22.28 |
421 6.90 |
136 2.83 |
980 27.64 |
0.3 .02 |
3.6 .06 |
758 | 345 | 413 |
| 19-16-17ab | Little Arkansas River | 12-20-45 | 32 | 516 | 16 | .16 | 124 6.19 |
20 1.64 |
43 1.88 |
461 7.56 |
38 .79 |
46 1.30 |
.3 .02 |
2.2 .04 |
392 | 378 | 14 |
| 20-6-25da | Little Arkansas River | 12-20-45 | 32 | 680 | 20 | .84 | 152 7.58 |
30 2.47 |
60 2.61 |
543 8.90 |
62 1.29 |
85 2.40 |
.3 .02 |
3.0 .05 |
502 | 445 | 57 |
| 20-8-16dd | Cow Creek, at highway bridge south of Lyons. | 12-19-45 | 32 | 1,217 | 19 | .21 | 167 8.33 |
31 2.55 |
245 10.65 |
386 6.33 |
89 1.85 |
470 13.25 |
.3 .02 |
5.3 .08 |
544 | 316 | 228 |
| 20-8-23ba | Cow Creek, at highway bridge south of Lyons. | 12-20-45 | 32 | 1,347 | 21 | .18 | 163 8.13 |
30 2.47 |
300 13.06 |
373 6.12 |
93 1.93 |
550 15.51 |
.3 .02 |
5.3 .08 |
530 | 306 | 224 |
| 20-9-11a | Cow Creek, at highway bridge south of Lyons. | 12-19-45 | 32 | 1,538 | 24 | .06 | 206 10.28 |
39 3.21 |
314 13.66 |
415 6.81 |
107 2.22 |
640 18.05 |
.3 .02 |
3.2 .05 |
674 | 340 | 334 |
| 20-10-19d | Arkansas River | 12-19-45 | 32 | 1,473 | 18 | .22 | 175 8.73 |
54 4.44 |
245 10.64 |
303 4.97 |
618 12.85 |
209 5.89 |
.8 .04 |
3.9 .06 |
658 | 248 | 410 |
| 21-6-31dd | Cow Creek | 12-19-45 | 32 | 1,242 | 15 | .27 | 121 6.04 |
24 1.97 |
315 13.68 |
288 4.72 |
79 1.64 |
540 15.23 |
.3 .02 |
5.3 .08 |
400 | 236 | 164 |
| 21-9-19b | Arkansas River, 300-yards up stream from mouth of Rattlesnake Creek. |
12-19-45 | 32 | 1,724 | 17 | .46 | 168 8.38 |
51 4.19 |
362 15.75 |
306 5.02 |
556 11.56 |
410 11.56 |
.7 .04 |
8.8 .14 |
628 | 251 | 377 |
| 21-9-19b | Rattlesnake Creek, 200 yds. up stream from the Arkansas River. |
12-19-45 | 32 | 3,015 | 18 | 1.4 | 129 6.44 |
33 2.71 |
981 42.67 |
334 5.48 |
168 3.49 |
1,510 42.58 |
.6 .03 |
5.3 .08 |
458 | 282 | 176 |
| 21-9-21bd | Arkansas River | 12-19-45 | 32 | 1,895 | 17 | .49 | 167 8.33 |
51 4.19 |
434 18.87 |
315 5.17 |
526 10.94 |
535 15.09 |
.7 .04 |
9.3 .15 |
626 | 258 | 368 |
| 22-8-4ab | Arkansas River | 12-19-45 | 32 | 2,171 | 17 | .38 | 150 7.48 |
41 3.37 |
593 25.77 |
315 5.17 |
372 7.74 |
830 13.41 |
.7 .04 |
8.8 .14 |
542 | 264 | 278 |
| 1. One part per million is equivalent to one pound of substance per million pounds of water or 8.33 pounds per million gallons of water. 2. An equivalent per million is a unit chemical equivalent weight of solute per million unit weights of solution. Concentration in equivalents per million is calculated by dividing the concentration in parts per million by the chemical combining weight of the substance or ion. 3. Location number: Numbers give the location of the stream sampling points according to General Land Office surveys and according to the following formula: Township-Range-Section, 160-acre tract within that section, and the 40-acre tract within the quarter section, The 160-acre and 40-acre tracts are designated a, b, c, or d in a counter-clockwise direction, beginning in the northeast quarter. For example: 18-6-29dd is located in SE SE sec. 29, T. 18 S., R. 6 W. |
|||||||||||||||||
Little Arkansas River
Two samples were taken from Little Arkansas River. The downstream sample, taken where the stream crosses the east county line, contained a greater concentration of solids than the upstream sample, taken near the town of Little River. All minerals for which tests were made, except fluoride, increased in concentration in the downstream sample. The stream, in its headwater area, receives water of low mineral content from the sandstones of the upper Kiowa and in the lower part of its course receives water from the shales of lower Kiowa and the Permian.
Cow Creek
Five water samples were taken from Cow Creek. At the point of entrance of Cow Creek on the west county line, the stream was carrying a high concentration of dissolved solids. The concentration decreased downstream to Lyons, probably because of dilution by water from the dune sand and alluvial sand and gravel of the Chase Channel. Below the drainage from Lyons, the water contained an increased concentration of dissolved solids, increasing in sodium, chloride, and sulfate. This increase is ascribed to the municipal and industrial wastes from Lyons, which includes wastes from two salt-producing plants. The calcium, magnesium, bicarbonate, and total hardness decrease consistently downstream in Cow Creek in its course through the county.
Arkansas River
Samples were taken from Arkansas River at four points in Rice County, and one sample was taken in Rattlesnake Creek near its junction with the river. The total hardness of water in Arkansas River decreases downstream; the calcium, magnesium, and sulfate show a consistent decrease from west to east. The dissolved solids show a consistent rise, due to increasing amounts of sodium and chloride. Most of the added chloride and sodium is believed to come from natural sources. The sample taken from Rattlesnake Creek, 200 yards upstream from the point where it empties into Arkansas River, contained 1,510 parts per million of chloride. The source of the chloride in Rattlesnake Creek is the Permian rocks in Stafford County (personal communication from B. F. Latta, who has made a study of the ground-water resources of Stafford County).
Prev Page--Ground water || Next Page--Formations
Kansas Geological Survey, Geohydrology
Placed on web June 16, 2015; originally published July 1950.
Comments to webadmin@kgs.ku.edu
The URL for this page is http://www.kgs.ku.edu/Publications/Bulletins/85/06_qual.html