![]()
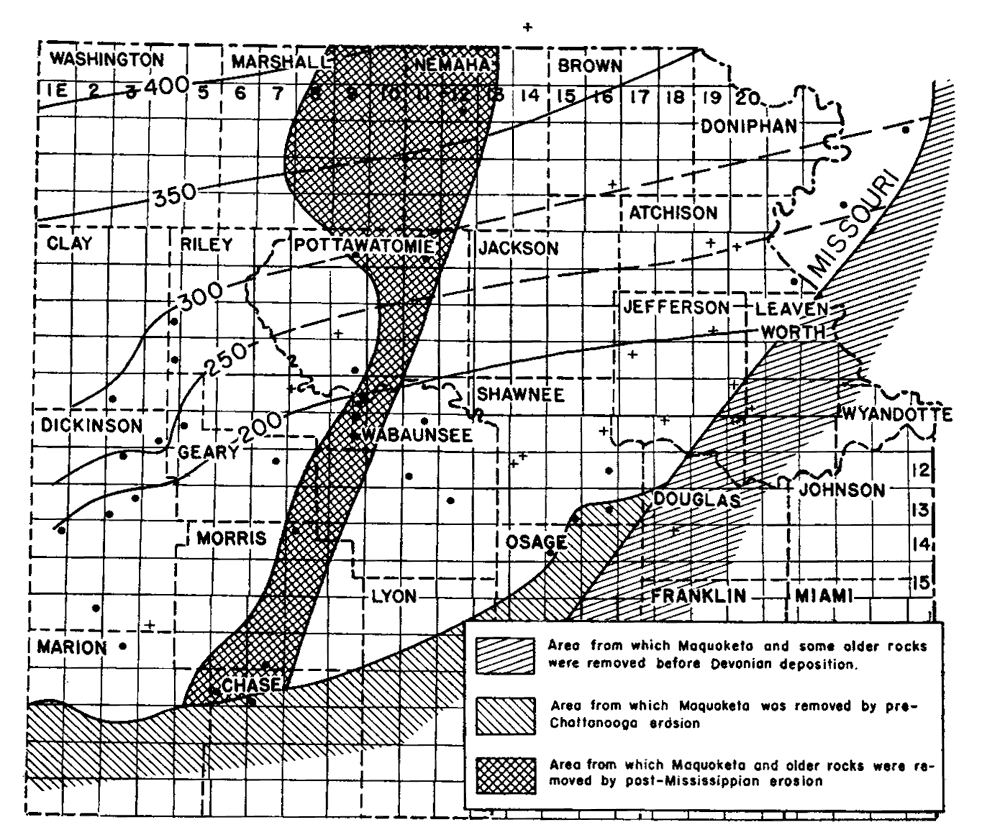
Figure 11--Map of northeastern Kansas showing the thickness of rocks between the top of the St. Peter sandstone and the top of the Maquoketa shale.
Isopachous lines connecting points of equal thickness are drawn at intervals of 50 feet. Plus signs show locations of wells from which samples were examined. Dots show locations of wells for which data were taken from drillers logs.
Kansas Geological Survey, Forest City Basin
Comments to webadmin@kgs.ku.edu
Web version July 2005. Original publication date Dec. 1943.
URL=http://www.kgs.ku.edu/Publications/Bulletins/51/fig11.html