Kansas Geological Survey, Bulletin 38, pt. 2, originally published in 1941
Federal geologist in charge of ground-water investigations in Kansas
Originally published in 1941 as Kansas Geological Survey Bulletin 38, pt. 2. This is, in general, the original text as published. The information has not been updated. An Acrobat PDF version (8 MB) is also available.
This report presents the results. of a detailed investigation of the groundwater conditions in and near Lawrence, with particular reference to the possibility of replacing the present municipal surface-water supply with a suitable supply of ground water. A geologic reconnaissance was made of the Kansas river valley north of Lawrence supplemented by extensive test drilling and water sampling.
It was found that the bedrock underlying Lawrence and vicinity is not capable of supplying water in amounts sufficient to meet the needs of the city, and that at many places the water from the bedrock is brackish or salty.
The test drilling and other field and laboratory work indicate that the alluvium in the Kansas river valley is by far the most productive source of ground water in the vicinity of Lawrence. The alluvium is very permeable and ranges in thickness from about 40 feet along the south side of the valley to as much as 80 feet in the deepest part of an old bedrock channel along the northern side of the valley-the area most favorable for the development of a large ground-water supply. It is conservatively estimated that recharge from Kansas river (especially from the dammed portion) and from local precipitation plus the recoverable part of the ground-water underflow from upstream areas would be sufficient to maintain a ground-water development of 2,000,000 to 3,000,000 gallons a day-adequate to meet the needs of the city. Suggestions are included as to the propert type and spacing of wells and the optimum rate of pumping in order to obtain a large supply of ground water without danger of local overdevelopment.
The ground water in the alluvium is very hard and contains considerable iron and some manganese, but it is very low in chloride and fluoride. The hardness is almost all carbonate or so-called temporary hardness, so that the hardness, iron, and manganese can be removed by relatively simple and inexpensive treatment. Moreover, the ground water is clear, and is free of the noxious tastes and odors and the excessive turbidity found in the river water now used to supply the city.
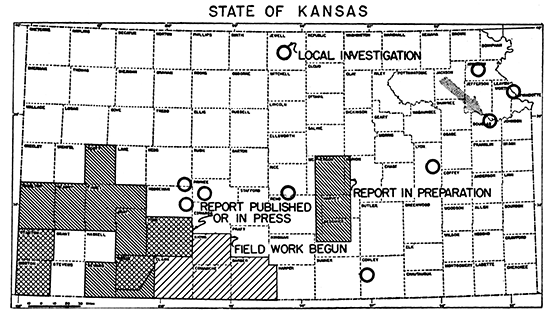
Lawrence is the county seat of Douglas county, Kansas, and is the home of the University of Kansas. It is situated on the south side of the Kansas river valley (fig. 1). In 1940 Lawrence had a population of 14,390.
Figure 1--Index map of Kansas showing areas in which cooperative groundwater investigations have been made. Arrow points to Lawrence.
Lawrence derives its present water supply from Kansas river but owing to the high content of silt or algae or both in the water at certain times of the year, the city has been desirous of replacing or augmenting the present surface-water supply with a suitable supply of ground water. On September 13, 1940, Frank E. Willey, superintendent of the Lawrence Water Department, requested the cooperation of the Federal Geological Survey and of the Kansas Geological Survey in making an investigation of the groundwater resources in the vicinity of Lawrence.
After conferences with Raymond C. Moore, director and state geologist, and Earnest Boyce, director and chief engineer of the Division of Sanitation of the Kansas State Board of Health, it was agreed that: (1) The cost of test drilling and other necessary field and office work would be financed jointly by the State and Federal Geological Surveys with funds provided by an agreement covering ground-water work in Douglas county; (2) the city of Lawrence would repay the State Survey for a part of the cost of the work; and (3) the Division of Sanitation of the State Board of Health would analyze all samples of water collected during the investigation without special charge to the city, as a part of its regular service available to cities of Kansas that have public water supplies.
The field work was done during the period from October 30 to December 23, 1940, by members of the Federal and State Surveys. Using the portable rotary drilling machine owned by the State and Federal Geological Surveys, Ellis D. Gordon, driller, Perry MeNally, sampler, and Laurence P. Buck, helper, drilled 29 test holes in the alluvium of the Kansas river valley. Gordon also obtained records of domestic and irrigation wells in the valley, and collected samples of water from 24 of the 29 test holes and from 10 of the private wells. Partial analyses of all samples of water were made by Elza O. Holmes, chemist of the Water and Sewage Laboratory, Kansas State Board of Health, Lawrence. McNally and Buck ran levels to all the test holes and to some of the private wells, in part with an alidade and plane table and in part with a spirit level. Charles C. Williams made mechanical analyses and determined the coefficients of permeability of all samples of water-bearing material obtained in test drilling. John C. Frye assisted in a geologic reconnaissance of the valley and in planning the test drilling, prepared the four cross sections (fig. 5.), and supervised the laboratory work done by Williams. Frank Willey, superintendent of the Lawrence Water Department, accompanied me on several visits to the field, obtained permission from several landowners for drilling test holes, and supplied maps and information from the files of the Water Department.
This report was reviewed critically by O. E. Meinzer and W. D. Collins of the Federal Geological Survey; R. C. Moore, K. K. Landes, and Ralph King of the State Geological Survey; Earnest Boyce, director and chief engineer of the Division of Sanitation of the Kansas State Board of Health; and George S. Knapp, chief engineer of the Division of Water Resources of the Kansas State Board of Agriculture. The illustrations were drawn by G. W. Reimer.
According to Haskins and Young (1915, p. 131), the first water plant at Lawrence was built by a private company in 1886, and the supply was obtained from
one large curb well, in the neighborhood of 30 feet in diameter and 30 feet deep; 24 driven points 6 inches in diameter, 50 feet in depth; and 500 feet of infiltration vitrified pipe laid 28 feet below the surface of the ground.
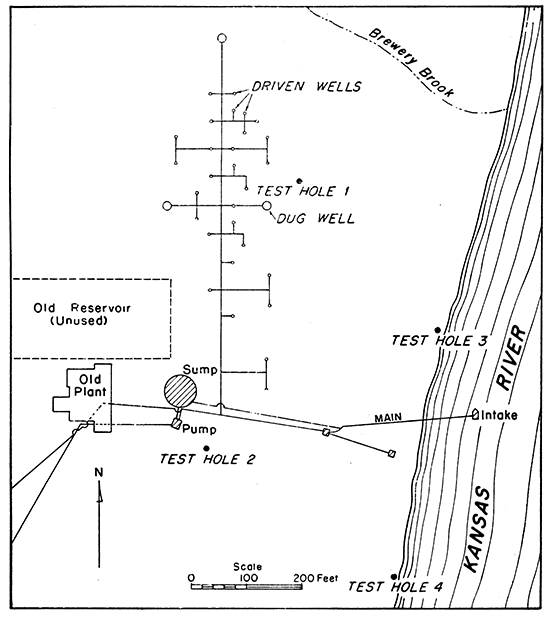
The water was obtained from alluvium in the Kansas river valley. The old well field and plant are situated in the NE sec. 25, T. 12 S., R. 19 E., and are shown in figure 2. Very little information is available concerning the old well field, but it is known that at some later date the use of the infiltration pipe (not shown in fig. 2) was discontinued and the three dug wells shown in the sketch were constructed. At a still later date a drilled gravel-wall well was constructed near the northernmost dug well. The large curb well mentioned by Haskins and Young is indicated in the sketch as a sump-its present use.
Figure 2--Sketch map showing the old Lawrence water plant and well field, present intake system from the river, and locations of test holes 1 to 4 put down during the present investigation. (Based on maps provided by the Lawrence Water Department).
To quote further from Haskins and Young,
The water is pumped by a Joseph Edwards Co. 4,000,000-gallon daily centrifugal pump into an open channel for aeration. This channel discharges into a large reservoir . . . with a capacity of 3% million gallons. Water flows from this reservoir into a second reservoir . . . with a capacity of 3/4 million gallons. This is for the purpose of aeration and sedimentation to remove iron. From either of these reservoirs the water may be pumped by a steam duplex compound pump with a capacity of 1,000 g.p.m., or a duplex compound pump, with a capacity of 2,100 g.p.m. directly into the mains. [Storage is provided by] a standpipe 20 feet in diameter and 102 feet high, with a capacity of 250,000 gallons . . . . The daily consumption is close to 1,300,000 gallons.
The water was hard and contained about 17 parts per million of iron and a small amount of manganese, and, as only part of the iron and manganese was removed by aeration and sedimentation, the water was regarded as unsatisfactory. A series of experiments was conducted in 1914 to determine what additional treatment was necessary, and it indicated that the iron could be removed and the manganese somewhat reduced by aeration followed by sedimentation and filtration (Schwab, 1916, pp. 29-38). There is no evidence that this method of treatment was applied, however.
Owing to faulty well construction, local overpumping due to close-spacing of wells, or the inefficient pumping method, the supply of ground water was not adequate at all times for the needs of the city, and it became necessary to reinforce the supply with water pumped from the river. There is some evidence that each of these three factors was partly responsible for the ultimate abandonment of the well field. Carl Graber of north Lawrence, who constructed many of the original wells, informed me that in constructing the three dug wells (fig. 2), solid concrete caissons were sunk to bedrock, keeping out virtually all ground water. It then became necessary to cut holes and extend short well points radially from the sides of the wells to allow the water to enter. The wells were grouped in such a small area that there must have been considerable mutual pumping interference. Moreover, considerable friction loss resulted from pumping all wells with a single suction pump, and the yield would have been greatly reduced by any slight leaks that developed in the long suction lines. Possibly for the above reasons, the well field was abandoned altogether about 1920, and thereafter the entire supply was pumped from the river.
The intake of the present surface-water supply is a crib in a dammed portion of Kansas river, as shown in figure 2. The dam (fig. 3), which is about half a mile down-stream from the intake and just below the Massachusetts Street bridge, is owned by the Bowersock Mills and Power Co. The water flows by gravity from the crib into the "intake well" or sump, whence it is pumped by one or more of four electrically-driven low service pumps through two 16-inch pipes to the treating plant, which is situated at Third and Indiana Streets. Two of the low service pumps each have a capacity of 1,000,000 gallons a day; the others are rated at 1,500,000 and 2,750,000 gallons a day. The treated water is pumped from the clear well directly into the low distribution system, which aggregates 44.4 miles of pipe, by the three steam-driven high service pumps, two of which are rated at 3,000,000 gallons a day, the other, 1,000,000 gallons a day. Storage is provided by the Oread reservoir, which holds 1,000,000 gallons. Two automatic electric booster pumps each rated at 500,000 gallons a day take water from the Oread reservoir and supply the high distribution system, aggregating 11.25 miles of pipe, the excess water being stored in a 75,000-gallon elevated tank in West Hills. The average pressure in the low distribution system is 75 pounds to the square inch; in the high system the pressure ranges from 75 to 120 pounds to the square inch. The capacity of the treating plant is 3,000,000 gallons a day; the daily consumption ranges from 800,000 to 2,500,000 gallons, and in 1940 averaged 1,451,200 gallons.
The supply of surface water has always been adequate in quantity, but considerable trouble has been caused by the large amount of silt or algae or both in the river at certain periods of the yearparticularly during the last several years. The troublesome turbidity has been removed successfully. The removal of noxious tastes and odors resulting from the algae (and at times from decaying vegetation) has proved very difficult and costly. Under extremely bad conditions, large amounts of activated carbon have been added directly into the pump pits at the low service pump station. Often it has not been economically practicable to remove the odor and taste completely, and as a result many complaints have been received. A discussion of the chemical character and silt content of the river water is given under "Quality of water."
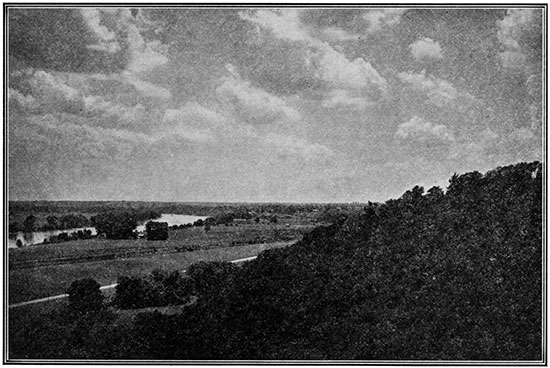
Plate 1--Kansas river valley east of Lawrence. Photo by Oren Bingham
The bedrock underlying Lawrence and vicinity is the Lawrence shale, a part of the Douglas group of Pennsylvanian age. The hills both north and south of the Kansas river valley at Lawrence are held up by the Oread limestone and younger beds of the Shawnee group, also of Pennsylvanian age (Moore, 1940, p. 45).
The Douglas group contains several fairly thick and widespread beds of sandstone that generally yield supplies of good water near the outcrops, but yield brackish or salty water at some distance west of the outcrops. Several wells in Lawrence obtain moderate supplies of water from these sandstones for cooling and for air conditioning, but the water from most of the wells is brackish or salty. The quantity of water available from these beds, however, is not adequate to supply the needs of the city, and the quality of the water would be unsatisfactory.
The alluvium in the Kansas river valley, which is known to have formerly supplied the city with water, supplies water to many domestic and stock wells in the valley, and yields abundant supplies to several irrigation and industrial wells. Very little was known concerning the thickness, character, and distribution of the alluvium, and the quality of the water, other than the statements of many well owners that the water generally contains considerable iron.
A geologic reconnaissance of the valley indicated that at one time the valley had been filled with alluvium to an altitude of more than 920 feet and was about 5 miles wide. Subsequently an inner valley had been excavated to a width of about 3 miles, the highest parts of which lie at altitudes of only 820 to 830 feet. Remnants of the material that formerly filled the valley are preserved as dissected terraces on both sides of the valley but most prominently on the north side (fig. 3). The high terrace deposits contain beds of large cobbles and boulders, a few of which are composed of red .quartzite-a rock that is foreign to Kansas but occurs several hundred miles to the northeast and could have been brought into Kansas only by glaciers during the Pleistocene epoch.
Figure 3--Topographic map of Lawrence and vicinity (After Monta E. Wing).
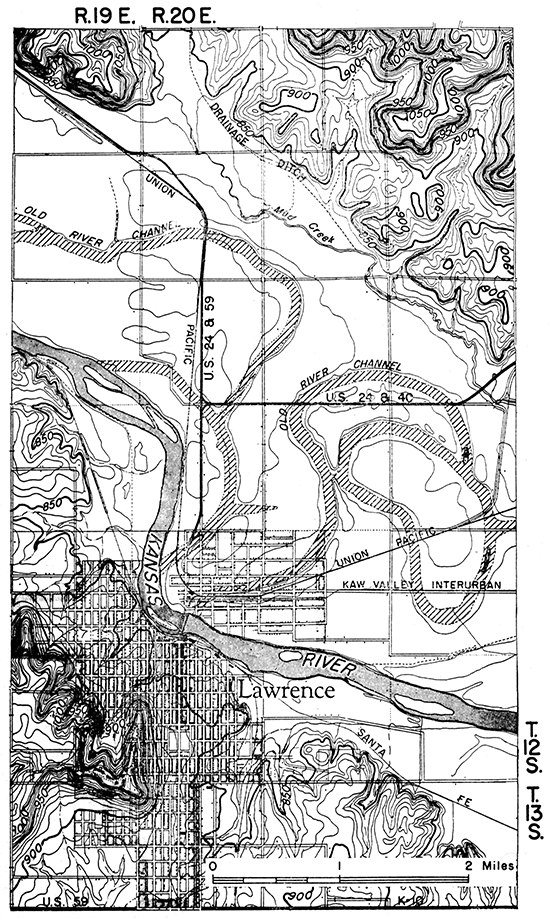
The inner floor of the valley is not smooth and flat, but contains several old channels formerly occupied by Kansas river (fig. 3), and the present channel and narrow floodplain have been cut below the general level of the valley.
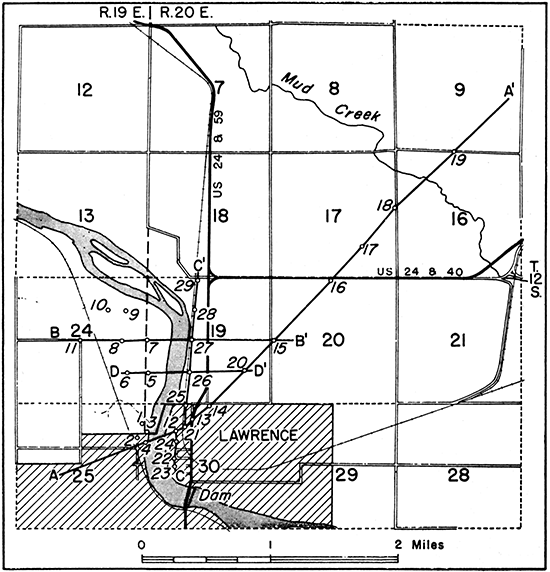
In order to determine the thickness, character, and extent of water-bearing alluvium on both sides of the river, the locations of any deep channels that might have been excavated into bedrock, the thickness and character of the terrace deposits, and the quality of the water, 29 test holes were put down at the localities shown in figure 4.
Figure 4--Map of Lawrence and vicinity showing locations of test holes and lines along which the cross sections were drawn.
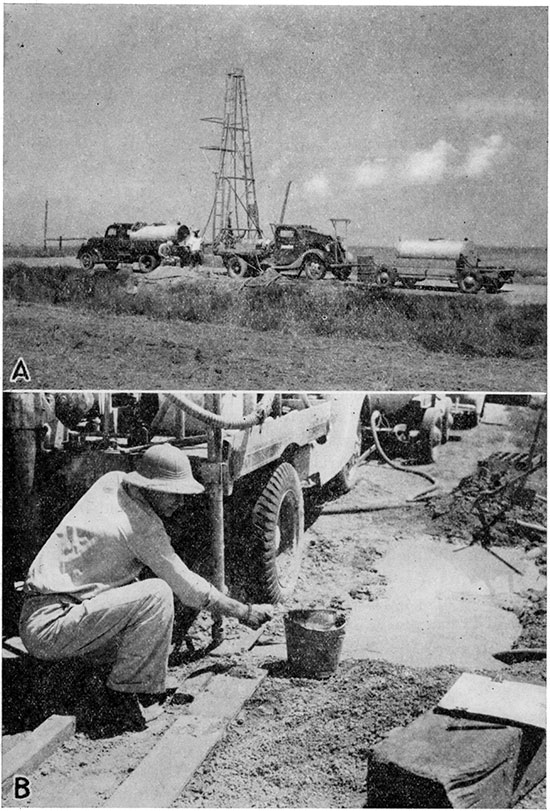
The test holes were drilled to bedrock and from 1 to 15 feet into bedrock by the hydraulic-rotary method (pl. 2). Samples of material were collected at regular intervals or whenever the slightest change in the character of the material was noted, and later were studied in the laboratory, as described in the next section. After a test hole had been completed, a 5-foot length of 1/4-inch slotted pipe attached to several lengths of 1/4-inch pipe was lowered nearly to the bottom of the hole so that a sample of clear ground water could be pumped. The samples of water were pumped with the mud pump on the well rig for a period of time sufficient to clear the water as much as possible. The analyses of the samples are given and discussed below under "Quality of water."
Plate 2--A, Portable rotary drilling machine used in putting down test holes near Lawrence; B, Catching samples of water-bearing gravel brought up by the drilling mud. (Photos by J. C. Frye).
Test holes 1 to 4 were put down to determine the thickness and character of the alluvium in the old municipal well field (fig. 2), as logs of these wells were not available. Test holes 1 to 11 were put down to test the small area of alluvium that lies southwest of the river, and the rest of the test holes were put down to test the much larger area north of the river.
The results of the test drilling are shown graphically in figure 5 and are given in the logs at the end of this report. Figure 5 shows that the buried valley is divided by a slight bedrock "ridge" in the vicinity of test hole 15, and that the deepest channel occurs along the north side of the valley between test holes 16 and 18. There is also a shallower channel found by test hole 12. In most of the test holes all the material encountered below the water table was water-bearing sand or gravel, and sand and gravel were found above the water table in several of the test holes. By far the thickest bed of saturated sand and gravel was found in the deep channel shown in figure 5.
Figure 5--Sections across the Kansas river valley along lines A-A' to D-D'. Numbers refer to test holes on figures 4.
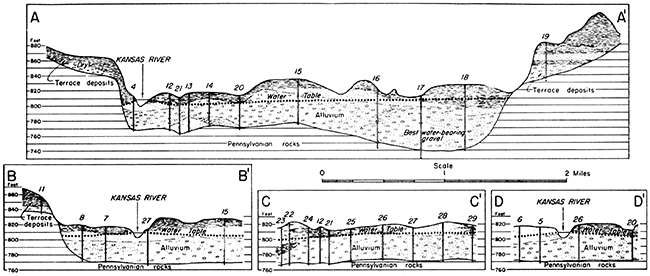
From the geologic reconnaissance it was at first thought that the deep bedrock valley might extend beneath the high terrace deposits on one or both sides of the valley, but, as shown by test holes 11 and 19 (fig. 5), the bedrock beneath the terrace deposits stands at a higher altitude than it does beneath the inner valley. Not until after test hole 19 had been drilled was the outcrop of bedrock discovered at foot of the high terrace between test holes 18 and 19.
The information gained from the test drilling and the reconnaissance of the surface features throws light on several chapters in the geologic history of the Kansas river valley, although the complete history could be worked out only after a painstaking study of a much longer section of the valley and its tributaries. According to Frye (Lohman and Frye, 1940, p. 846), there is evidence that Kansas river once headed at some point east of the Flint Hills, was dammed by one of the early Pleistocene glaciers (presumably the Kansan), and did not accumulate all its western tributaries until the retreat of this glacier. It is believed that the first major downcutting of Kansas river began during or soon after the retreat of this early glacier. The shape of the early bedrock valley may have been that obtained by extending the gentle bedrock surfaces shown beneath the high terrace deposits in figure 5 toward a point in the middle of the valley somewhat higher than the present bedrock floor.
Evidence of more than one stage of glaciation in northeastern Kansas (Atchison county) has been found by John C. Frye (personal communication) and during one of these later stages the Kansas river valley could have been filled to a level of or above the highest terrace (figs. 3 and 5), which lies about 140 feet below the top of the bedrock hills on both sides of the valley. The presence of scattered cobbles of red quartzite foreign to Kansas and to the drainage basin of Kansas river clearly attests the glacial origin of the high terrace deposits.
There is evidence from the shape of the bedrock floor (fig. 5) and from the distribution of the coarse and fine material that after the complete filling of the valley, downcutting during the succeeding interglacial stage again exceeded deposition and cut entirely through the valley fill, scouring the bedrock deeper-notably near the northern side of the valley (fig. 5) . This second stage of downcutting produced a steeper bedrock slope on the northern side than did the first stage.
The youngest Pleistocene glaciers seemingly did not reach as far south as Kansas, but after the second stage of downcutting by Kansas river the valley was once more partly filled to a level of or above the present low terrace, at altitudes of 820 to 830 feet. This material comprises sand and coarse gravel, but, except locally just above the bedrock, it lacks the large cobbles found in the high terrace deposits.
That the channel of the river has shifted back and forth across the valley in relatively recent times is shown in figures 3 and 5 by the several abandoned river channels. The present channel lies at an altitude slightly lower than that of the abandoned channels, which indicates that the stream is again cutting down its channel.
Samples of material penetrated by the rotary drilling machine were collected and dried in the field by Perry McNally (pl. 2B), who also prepared the logs given at the end of this report. When dry the samples were sacked and taken to the laboratory of the U. S. Geological Survey at Lawrence, where mechanical analyses and determinations of the coefficient of permeability were made by Charles C. Williams.
The samples collected from the test holes were washed to the surface by the drilling mud and therefore cannot be regarded as truly representative of the materials as they occur undisturbed in nature. An effort was made to use mud as light as possible, and nearly clear water was used in some test holes. The water or light mud may have removed some of the finer particles that occur naturally in the sands and gravels. On the other hand, very heavy mud was used in several test holes, such as numbers 28 and 29, with the result that the samples are believed to contain more mud than they should. Despite these difficulties in sampling, it is believed that the laboratory determinations gave reasonably correct answers, and that the data are sufficiently accurate for comparing the water-bearing character of the alluvium in different parts of the valley and for determining conservatively the underground movement of water. For most of the test holes, laboratory determinations were made only on samples obtained below the water table.
A mechanical analysis of granular material consists in separating into groups the grains of different sizes and determining what percentage, by weight, each group constitutes. The dried samples were placed in a large mortar and adhering lumps of material gently broken up. Representative samples of the desired size were obtained by repeated quartering through a modified Jones sample splitter. Carefully weighed samples that averaged 75 grams each were put into a set of standard 3-inch screens; the screens were shaken vigorously for 25 minutes in a rotary shaker designed by me; and the fractions were weighed on a precision balance.
The permeability of a water-bearing material is its capacity for transmitting water under pressure. The coefficient of permeability, as determined in the field or laboratory, is expressed by O. E. Meinzer as the number of gallons of water a day, at 60° F., that is conducted laterally through each mile of the water-bearing bed under investigation (measured at right angles to the direction of flow), for each foot of thickness of the bed, and for each foot per mile of hydraulic gradient (Stearns, 1927, p. 148). The coefficients of permeability given below were determined by means of a portable field apparatus designed by V. C. Fishel and V. T. Stringfield of the Federal Geological Survey.
The laboratory determinations made on samples of water-bearing material from 27 of the 29 test holes are given in table 1. Two of the test holes (11 and 19) were put down through the high terrace deposits and did not reach the water table.
Table 1--Physical properties of water-bearing materials from test holes in the Kansas river valley near Lawrence. Collected by Perry McNally; analyzed by Charles C. Williams.
| Test hole no. on fig 4 |
Depth of sample (feet) |
Mechanical analyses (percent by weight) | Coefficient of permeability1 |
Weighted average coefficient of permeability3 |
||||||
|---|---|---|---|---|---|---|---|---|---|---|
| Medium and coarse gravel (larger than 2.0 mm) |
Fine gravel (2.0-1.0 mm) |
Coarse sand (1.0-0.5 mm) |
Medium sand (0.5-0.25 mm) |
Fine sand (0.25-0.125 mm) |
Very fine sand (0.125-0.062 mm) |
Silt and clay (Less than 0.062 mm) |
||||
| 1 | 13-20 | 11.2 | 22.0 | 36.6 | 26.0 | 3.2 | 0.3 | 0.7 | 1,105 | 1,054 |
| 20-30 | 53.0 | 19.3 | 15.9 | 10.3 | .9 | .2 | .4 | 1,613 | ||
| 30-40 | 44.9 | 32.0 | 18.1 | 4.0 | .3 | .3 | .4 | 505 | ||
| 40-45.5 | 53.4 | 33.5 | 8.7 | 2.9 | .4 | .4 | .7 | 2,784 | ||
| 2 | 21-30 | 22.2 | 35.7 | 30.6 | 10.2 | .7 | .2 | .4 | 1,588 | 1,114 |
| 30-40 | 44.8 | 31.7 | 15.5 | 4.3 | 1.1 | .8 | 1.8 | 465 | ||
| 40-44.5 | 35.9 | 33.9 | 26.8 | 1.8 | .5 | .3 | .8 | 1,610 | ||
| 3 | 14-20 | 25.5 | 32.7 | 25.5 | 15.2 | .6 | .2 | .3 | 1,696 | 1,058 |
| 20-30 | 24.2 | 34.1 | 28.3 | 12.3 | .5 | .2 | .4 | 2,218 | ||
| 30-40 | 26.5 | 28.9 | 31.7 | 10.6 | 1.0 | .5 | .8 | 239 | ||
| 40-45 | 18.7 | 42.1 | 29.8 | 7.4 | .8 | .3 | .9 | 1,727 | ||
| 4 | 13-20 | 9.6 | 20.9 | 34.6 | 31.2 | 3.1 | .2 | .4 | 1,278 | 1,256 |
| 20-27 | 20.0 | 28.2 | 24.1 | 24.1 | 2.0 | .4 | .2 | 492 | ||
| 27-293 | ||||||||||
| 29-34 | 1.5 | 7.9 | 15.9 | 47.2 | 18.4 | 2.6 | 6.5 | 62 | ||
| 34-40 | 19.6 | 40.8 | 28.0 | 7.6 | 2.6 | .4 | .9 | 3,952 | ||
| 40-44 | 19.0 | 29.8 | 35.0 | 12.4 | 2.2 | .4 | 1.2 | 1,604 | ||
| 5 | 0-11 | .7 | 1.8 | 19.9 | 62.0 | 7.1 | 3.2 | 5.3 | 167 | 1,0914 |
| 11-15 | .5 | 4.5 | 22.2 | 60.8 | 8.0 | 1.2 | 2.8 | 590 | ||
| 15-20 | 1.1 | 2.7 | 8.8 | 77.4 | 7.2 | .9 | 1.9 | 594 | ||
| 20-30 | 16.2 | 28.4 | 23.5 | 26.1 | 4.4 | .4 | 1.0 | 1,976 | ||
| 30-40 | 30.5 | 31.4 | 14.8 | 12.6 | 7.1 | 1.6 | 2.0 | 567 | ||
| 40-45.5 | 2.7 | 13.9 | 38.2 | 37.9 | 5.9 | .5 | .9 | 1,162 | ||
| 6 | 4-10 | .0 | 1.0 | 18.5 | 69.7 | 9.1 | :8 | .9 | 1,139 | 1,4034 |
| 10-20 | .3 | 2.1 | 15.5 | 77.5 | 3.6 | .3 | .7 | 1,162 | ||
| 20-24 | .3 | 1.8 | 34.8 | 58.9 | 3.6 | .2 | .4 | 1,339 | ||
| 24-30 | 7.4 | 20.0 | 30.0 | 39.0 | 3.1 | .2 | .3 | 1,627 | ||
| 30-40 | 15.3 | 24.3 | 37.1 | 20.0 | 2.6 | .2 | .5 | 1,627 | ||
| 40-47.5 | 32.2 | 30.0 | 11.0 | 19.7 | 5.5 | .6 | 1.0 | 395 | ||
| 7 | 10-20 | 1.5 | 8.3 | 33.2 | 45.4 | 8.3 | 1.1 | 2.2 | 710 | 1,121 |
| 20-30 | 19.1 | 31.0 | 31.0 | 14.7 | 3.1 | .3 | .8 | 1,450 | ||
| 30-40 | 6.2 | 26.2 | 47.4 | 16.9 | 1.7 | .5 | 1.1 | 1,150 | ||
| 40-43.5 | 3.7 | 21.8 | 54.2 | 15.1 | 2.6 | .8 | 1.8 | 1,275 | ||
| 8 | 8-10 | .2 | .9 | 5.0 | 66.7 | 20.3 | 2.6 | 4.3 | 112 | 9994 |
| 10-19 | .0 | 1.0 | 5.0 | 59.7 | 27.4 | 3.0 | 3.9 | 23 | ||
| 19-30 | 4.8 | 15.2 | 35.4 | 36.2 | 6.9 | .5 | 1.0 | 1,170 | ||
| 30-40 | 20.0 | 23.8 | 26.1 | 22.6 | 6.2 | .6 | .7 | 850 | ||
| 40-46 | 14.4 | 32.6 | 31.6 | 17.1 | 2.5 | .6 | 1.2 | 2,550 | ||
| 9 | 10-23 | 8.0 | 24.4 | 44.6 | 19.5 | 2.2 | .3 | 1.0 | 1,550 | 1,6124 |
| 23-30 | 6.7 | 22.9 | 45.3 | 22.7 | 1.9 | .2 | .3 | 2,050 | ||
| 30-40 | 4.0 | 25.7 | 36.2 | 31.3 | 1.9 | .4 | .5 | 1,820 | ||
| 40-47.5 | .0 | 2.5 | 28.9 | 60.6 | 5.0 | 1.2 | 1.9 | 1,020 | ||
| 10 | 11-20 | 2.4 | 15.3 | 49.4 | 25.5 | 3.6 | 1.5 | 2.3 | 815 | 1,5494 |
| 20-22 | 1.7 | 29.8 | 45.5 | 18.7 | 2.4 | .4 | 1.5 | 3,000 | ||
| 22-30 | 7.2 | 23.4 | 39.1 | 22.5 | 4.3 | 1.6 | 1.9 | 556 | ||
| 30-40 | 8.0 | 16.1 | 43.3 | 29.5 | 1.8 | .3 | 1.0 | 1,650 | ||
| 40-49 | .0 | 6.8 | 67.7 | 23.1 | 1.4 | .2 | .8 | 2,650 | ||
| 12 | 14-20 | 9.9 | 19.0 | 42.6 | 26.9 | .9 | .2 | .5 | 2,653 | 3,267 |
| 20-30 | 30.9 | 26.2 | 28.4 | 13.0 | .6 | .2 | .7 | 2,218 | ||
| 30-40 | 23.3 | 28.9 | 32.3 | 13.5 | 1.4 | .2 | .4 | 3,262 | ||
| 40-48 | 24.7 | 35.7 | 28.6 | 9.6 | 1.0 | .1 | .3 | 5,046 | ||
| 13 | 10-20 | 3.4 | 18.3 | 49.2 | 27.2 | 1.1 | .2 | .6 | 2,523 | 2,1104 |
| 20-30 | 6.6 | 36.0 | 42.5 | 13.6 | .6 | .2 | .5 | 3,262 | ||
| 30-40 | 8.9 | 25.9 | 24.5 | 35.2 | 4.9 | .3 | .3 | 1,395 | ||
| 40-48 | .6 | 1.4 | 17.3 | 71.1 | 8.5 | .5 | .6 | 1,078 | ||
| 14 | 13-20 | 17.5 | 22.9 | 31.7 | 25.2 | 1.5 | .3 | .9 | 1,792 | 1,634 |
| 20-30 | 31.7 | 28.1 | 23.9 | 14.0 | 1.5 | .6 | .2 | 802 | ||
| 30-43.5 | 22.7 | 34.0 | 28.5 | 13.4 | .9 | .1 | .4 | 2,268 | ||
| 15 | 22-30 | 4.0 | 29.1 | 45.4 | 15.5 | 2.8 | 1.8 | 1.4 | 1,872 | 1,560 |
| 30-40 | 17.6 | 29.8 | 32.6 | 17.7 | 1.3 | .3 | .7 | 3,242 | ||
| 40-50 | 2.1 | 17.7 | 32.6 | 37.0 | 7.9 | 1.0 | 1.7 | 281 | ||
| 50-57 | 5.5 | 23.2 | 41.3 | 24.4 | 3.9 | .7 | 1.0 | 508 | ||
| 16 | 8-10 | 0.2 | 1.7 | 60.1 | 34.8 | 1.2 | 0.6 | 1.4 | 750 | 3,433' |
| 10-20 | .1 | 1.0 | 38.5 | 55.1 | 3.7 | .6 | 1.0 | 1,620 | ||
| 20-25 | 5.0 | 22.2 | 42.3 | 25.8 | 3.2 | .7 | .8 | 1,670 | ||
| 25-30 | 29.5 | 28.6 | 29.8 | 10.1 | .7 | .5 | .8 | 1,375 | ||
| 30-39 | 2.6 | 11.9 | 38.6 | 34.2 | 8.8 | 1.4 | 2.5 | 54 | ||
| 39-43 | 17.0 | 28.8 | 39.4 | 10.9 | 3.0 | .4 | .5 | 1,970 | ||
| 43-50 | 3.9 | 40.2 | 43.0 | 10.7 | 1.5 | .3 | .4 | 3,550 | ||
| 50-60 | 23.2 | 51.3 | 20.5 | 2.8 | .3 | .6 | 1.3 | 12,750 | ||
| 60-72 | 1.5 | 27.2 | 56.9 | 8.2 | 1.3 | 2.2 | 2.7 | 1,725 | ||
| 17 | 14-21 | 5.3 | 15.3 | 36.9 | 35.7 | 4.2 | 1.3 | 1.3 | 1,180 | 4,726 |
| 21-26 | 1.6 | 12.2 | 49.5 | 34.5 | 1.5 | .2 | .5 | 2,280 | ||
| 26-30 | 28.5 | 25.0 | 27.4 | 15.9 | 1.1 | .5 | 1.6 | 910 | ||
| 30-40 | 56.6 | 24.6 | 9.9 | 3.8 | .9 | .9 | 3.3 | 1,725 | ||
| 40-50 | 50.1 | 32.5 | 9.9 | 3.9 | .6 | .7 | 2.3 | 4,900 | ||
| 50-60 | 62.5 | 24.9 | 7.2 | 2.0 | .5 | .7 | 2.2 | 9,100 | ||
| 60-67.5 | 73.0 | 15.6 | 5.2 | 1.5 | 1.1 | 1.2 | 2.4 | 9,100 | ||
| 67.5-70 | 79.8 | 7.7 | 2.8 | 1.0 | 3.1 | 2.6 | 3.0 | 6,350 | ||
| 18 | 29.5-35 | 5.5 | 1.6 | 12.3 | 59.1 | 9.0 | 2.0 | 10.5 | 6.5 | 2,490 |
| 35-39 | 9.2 | 12.7 | 22.6 | 46.8 | 6.3 | .4 | 2.0 | 147 | ||
| 39-50 | 43.5 | 27.3 | 21.7 | 5.4 | .5 | .4 | 1.2 | 1,050 | ||
| 50-62 | 27.5 | 33.8 | 28.1 | 7.3 | .8 | .5 | 2.0 | 1,420 | ||
| 62-70 | 46.3 | 27.2 | 19.3 | 4.8 | .6 | .4 | 1.4 | 2,770 | ||
| 70-79 | 55.4 | 25.2 | 14.5 | 2.9 | .3 | .3 | .9 | 9,100 | ||
| 20 | 12-21 | 33.1 | 33.4 | 21.6 | 7.8 | 1.5 | .6 | 2.0 | 335 | 992 |
| 21-30 | 23.4 | 37.4 | 26.5 | 9.3 | 1.1 | .6 | 1.7 | 755 | ||
| 30-40 | 34.9 | 35.4 | 22.2 | 5.2 | .7 | .4 | 1.2 | 1,210 | ||
| 40-41.5 | 34.0 | 39.7 | 20.7 | 3.7 | .6 | .3 | 1.0 | 4,900 | ||
| 21 | 8-12 | 1.3 | 11.2 | 37.2 | 44.4 | 2.8 | .8 | 2.3 | 385 | 1,902 |
| 12-20 | 34.0 | 25.2 | 27.1 | 12.7 | .5 | .2 | .3 | 3,550 | ||
| 20-30 | 37.2 | 30.8 | 26.3 | 3.9 | .6 | .3 | .9 | 1,470 | ||
| 30-40 | 24.7 | 40.8 | 26.7 | 5.8 | .7 | .3 | 1.0 | 1,750 | ||
| 40-42 | 19.5 | 28.8 | 41.8 | 8.1 | .8 | .5 | .5 | 1,270 | ||
| 22 | 11-20 | .8 | 5.5 | 46.7 | 42.0 | 3.3 | 1.1 | .7 | 1,739 | 1,576 |
| 20-28 | 11.1 | 18.8 | 33.1 | 32.3 | 3.8 | .4 | .5 | 1,418 | ||
| 28-385 | ||||||||||
| 38-50 | 18.9 | 32.3 | 29.3 | 16.2 | 2.7 | .3 | .3 | 1,471 | ||
| 50-52 | 5.5 | 19.9 | 44.6 | 27.5 | 1.9 | .2 | .6 | 2,113 | ||
| 23 | 10-20 | 3.0 | 22.0 | 55.2 | 17.4 | 1.1 | .4 | .9 | 1,305 | 1,844 |
| 20-22.5 | 6.5 | 16.4 | 40.4 | 34.0 | 2.4 | .1 | .2 | 2,268 | ||
| 22.5-365 | ||||||||||
| 36-40 | 12.7 | 38.1 | 42.1 | 5.3 | .8 | .3 | .7 | 4,012 | ||
| 40-46.5 | .5 | 5.2 | 46.9 | 45.0 | 1.6 | .2 | .6 | 1,177 | ||
| 24 | 10.5-17 | .3 | 3.6 | 45.0 | 42.2 | 5.6 | 1.7 | 1.6 | 1,257 | 1,657 |
| 17-20 | 2.5 | 30.5 | 45.4 | 18.1 | 2.4 | .4 | .7 | 1,947 | ||
| 20-30 | 10.8 | 29.9 | 37.3 | 19.7 | 1.4 | .4 | .5 | 2,193 | ||
| 30-40 | 21.6 | 21.0 | 28.2 | 26.0 | 2.3 | .3 | .6 | 1,444 | ||
| 40-50 | 28.3 | 49.5 | 17.5 | 2.7 | .7 | .4 | .9 | 1,508 | ||
| 25 | 8-14 | 14.2 | 36.3 | 32.4 | 11.4 | 1.7 | .7 | 3.3 | 33 | 564 |
| 14-20 | 20.8 | 29.9 | 31.7 | 14.8 | 1.4 | .4 | 1.0 | 113 | ||
| 20-30 | 28.0 | 33.7 | 28.4 | 7.6 | .8 | .4 | 1.1 | 738 | ||
| 30-41 | 37.7 | 32.7 | 22.3 | 5.5 | .5 | .3 | 1.0 | 941 | ||
| 26 | 13-19 | 4.0 | 15.7 | 34.2 | 36.4 | 4.8 | 1.4 | 3.5 | 148 | 1,0904 |
| 19-30 | 9.7 | 21.0 | 36.3 | 28.2 | 2.1 | .8 | 1.9 | 530 | ||
| 30-40 | 37.4 | 30.6 | 21.6 | 8.1 | .7 | .5 | 1.1 | 855 | ||
| 40-45 | 36.3 | 36.9 | 20.0 | 5.0 | .5 | .4 | .9 | 3,550 | ||
| 27 | 1.5-11 | 1.1 | 2.6 | 10.3 | 67.0 | 8.8 | 3.0 | 7.2 | 33 | 1,003 |
| 11-20 | 9.9 | 41.7 | 38.6 | 7.0 | 1.0 | .6 | 1.2 | 1,580 | ||
| 20-30 | 30.1 | 34.1 | 25.7 | 7.9 | .7 | .5 | 1.0 | 915 | ||
| 30-43.5 | 22.3 | 33.2 | 34.9 | 7.6 | .5 | .5 | 1.0 | 970 | ||
| 286 | 16-303 | |||||||||
| 30-40 | 27.9 | 34.5 | 13.9 | 8.4 | 10.0 | 2.4 | 2.9 | 130 | ||
| 40-49.5 | 42.7 | 38.2 | 12.1 | 2.1 | 2.3 | 1.1 | 1.5 | 670 | ||
| 296 | 11-21 | 12.2 | 28.6 | 30.1 | 23.8 | 2.2 | .7 | 2.4 | 180 | |
| 21-30 | 24.9 | 28.2 | 27.9 | 15.9 | 1.2 | .6 | 1.3 | 400 | ||
| 30-40 | 22.6 | 28.0 | 44.9 | 1.4 | 1.1 | .5 | 1.5 | 2,350 | ||
| 40-45 | 26.9 | 34.1 | 25.2 | 11.6 | 1.0 | .4 | .8 | 820 | ||
| 1 Number of gallons of water a day, at 60°F., that is conducted laterally through each mile of water-bearing bed under investigation (measured at right angles to the direction of flow), for each foot of thickness of the bed and for each foot per mile of hydraulic gradient. 2 Sum of the products of the coefficient of each bed times the thickness of each hed; divided by the total thickness. 3 Samples contained too much heavy drilling mud and could not be determined. 4 Excluding unsaturated part of top sample. 5 Silty clay. 6 Test holes drilled with very heavy mud, therefore percentages of clay and silt are too high-coefficient of permeability too low. |
||||||||||
The figures given in table 1 indicate that the character and permeability of the alluvium range between somewhat wide limits. Most of the samples had a coefficient of permeability greater than 1,000, indicating that the materials are almost uniformly permeable and capable of transmitting considerable water. Some of the coefficients were less than 1,000, and a few were less than 100. Although the low permeability of some of these samples was due to the high content of drilling mud, others doubtless contained sufficient natural silt and clay to restrict their permeability. Many of the samples had coefficients of 2,000 to 5,000, and several had coefficients of 9,000 to 12,000. By far the thickest, coarsest, and most permeable water-bearing materials were those encountered in the deepest part of the bedrock valley (fig. 5) by test holes 16, 17, and 18.
Test holes 1 to 4 were put down to determine the character of the water-bearing material in the old well field of the city of Lawrence (fig. 2) and test holes 5 to 10 were put down to determine the character and extent of the material southwest of the river and north of the old well field. Table 1 indicates that although some of the individual beds tapped by these test holes are fairly coarse and moderately permeable, the material southwest of the river generally is thinner and less permeable than that north of the river-particularly at and beyond the middle of the valley. The determinations on materials from test holes 1 to 4, however, indicate that the abandonment of the old well field probably was due to inefficient wells and pumping methods rather than to poor water-bearing materials.
Records of 16 wells in the Kansas river valley obtained by Ellis D. Gordon are given in table 2, and the locations of the wells are shown in figure 6. Records of the driven wells were obtained in connection with the collection of water samples and the preparation of the water-table contour map (fig. 6), and generally do not indicate the quantity of water available. Wells 1, 3, and 14, however, are drilled irrigation wells that are equipped with larger pumps and hence give a better idea of the potential yield of the alluvium. Well 1 has a reported yield of 900 gallons a minute with a draw-down of only 12 or 13 feet, and well 3 has a reported yield of 800 gallons a minute with a draw-down of only 9 to 11 feet. Well 14 is not so deep as the others and may tap poorer water-bearing material, as it is reported to yield only about 400 gallons a minute with a draw-down of 12 or 13 feet.
Figure 6--Map of Lawrence and vicinity showing locations of water wells for which records are given, and water-table contours as of December, 1940.
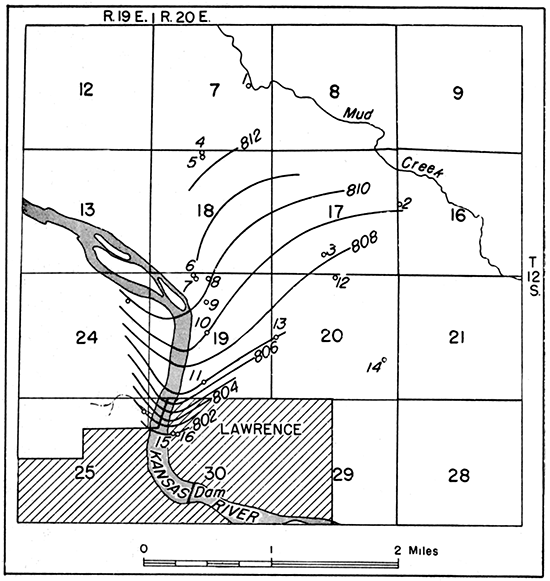
Table 2--Records of water wells in the Kansas river valley north of Lawrence.
| Well on fig. 6 |
Location in T. 12 S., R. 20 E. | Type of well1 |
Depth of well (feet) |
Diameter of well (inches) |
Method of lift2 |
Use of water3 |
Measuring point | Depth to water level below measuring point (feet) |
Date of measurement, 1940 |
|
|---|---|---|---|---|---|---|---|---|---|---|
| Height above land surface (feet) |
Height above sea level (feet) |
|||||||||
| 1 | SW cor. SE NE sec. 7 | Dr | 85.8 | 24 | C,G | I | 1.8 | 24.95 | Dec. 6 | |
| 2 | SW cor. SW NW sec. 16 | Dn | 45 | 1 1/4 | Cy,W | D,S | .7 | 831.4 | 22.30 | Nov. 30 |
| 3 | SE SW sec. 17 | Dr | 54 | 19 | C,G | I | .2 | 818.8 | 10.60 | Nov. 30 |
| 4 | NE NW sec. 18 | Dn | 50 | 1 1/4 | Cy,W | S | 16± | |||
| 5 | NE NW sec. 18 | Dn | 36.6 | 1 1/4 | Cy,H | S | .8 | 827.9 | 15.55 | Dec. 7 |
| 6 | NE NW sec. 19 | Dn | 1 1/4 | P,H | D | |||||
| 7 | NE NW sec. 19 | Dn | 21.32 | 1 1/4 | P,H | S | 2.1 | 823.2 | 12.62 | Dec. 7 |
| 8 | NE cor. NW sec. 19 | Dn | 26.8 | 1 1/4 | N | N | 2.5 | 825.6 | 15.43 | Dec. 5 |
| 9 | NE NW sec. 19 | Dn | 23.6 | 1 1/4 | Cy,E | D | .7 | 825.9 | 16.16 | Dec. 6 |
| 10 | SE NW sec. 19 | Dn | 25.5 | 1 1/4 | P,H | S | 3.2 | 825.8 | 16.82 | Dec. 6 |
| 11 | SE SW sec. 19 | Dn | 1 1/4 | N | N | .7 | 820.2 | 13.10 | Nov. 29 | |
| 12 | NW cor. NE sec. 20 | Dn | 32.2 | 1 1/4 | Cy,H | D,S | 1.2 | 828.8 | 20.66 | Nov. 30 |
| 13 | SW cor. NW sec. 20 | Dn | 35.8 | 1 1/4 | Cy,H | D | .5 | 829.3 | 21.95 | Nov. 30 |
| 14 | NE SE sec. 20 | Dr | 50 | 19 | C,G | I | 14 | |||
| 15 | SE NW sec. 30 | Dn | 29.3 | 1 1/4 | N | N | .3 | 823.6 | 21.63 | Nov. 30 |
| 16 | SE NW sec. 30 | Dn | 27 | 1 1/4 | Cy,E | S | ||||
| 1 Dr, drilled well; Dn, driven well. 2 Type of pump: C. centrifugal; Cy, cylinder; N, none; P, pitcher. Type of power: E, electric motor; G, gasoline engine; H, hand; W. windmill. 3 D, domestic; I, irrigation; N, none; S, stock. |
||||||||||
Supplement to Table 2--Owners of wells, descriptions of measuring points, and remarks.
| Well no. 1. Owner--Charles B. Young (American Butter Co., tenant). MP (measuring point)--top of concrete platform at southwest corner of well. Remarks--Bottom 20 feet of casing perforated. Reported to yield 900 gallons a minute with a draw-down of 9 to 11 feet after pumping 24 hours. Irrigated 215 acres in 1940. Temperature of water, 56°F. See log. Well no. 2. Owner--W. J. Gilmore estate (J. W. House, tenant). MP--top of wooden platform at east side of pump base. Remarks--See analysis. Well no. 3. Owner--University of Kansas (W. H. Hayden, tenant). MP--top of tile curb at southeast corner. Remarks--Bottom 24 feet of casing perforated. Reported to yield 800 gallons a minute with a draw-down of 9 feet after pumping 24 hours. See log. Well no. 4. Owner--Fred Laptad. Remarks--See analysis. Well no. 5. Owner--Fred Laptad. MP--top of concrete curb at south side. Remarks--South of well 4. See analysis. Well no. 6. Owner--Lester McGee (Alfred Saler, tenant). Remarks--Well at house. See analysis. Well no. 7. Owner--Lester McGee (Alfred Saler, tenant). MP--top of bolt on pump base at southwest side. Remarks--Well at hog pen. Well no. 8. Owner--W. L. Moore (Harold Moline, tenant). MP--top of base of pitcher pump. Remarks--Well east of tourist cabins. Well no. 9. Owner--Harold Brown (William Dunn, tenant). MP--bottom of sill of northwest window; west side. Remarks--Well in basement. See analysis. Well no. 10. Owner--Frank Fox. MP--top of east bolt of pump base. Remarks--See analysis. Well no. 11. Owner--L. R. Iles. MP--top of concrete curb at northwest corner. Remarks--Top of pipe 3.74 feet below top of concrete curb. Well no. 12. Owner--E. B. Pine. MP--top of wooden platform at north side of pump base. Remarks--See analysis. Well no. 13. Owner--Clarence Pine. MP--top of concrete curb at south side of pump. Remarks--See analysis. Well no. 14. Owner--W. H. Pendleton (G. E. Robinson, tenant). RemarksBottom 30 feet of casing perforated. Reported to yield about 400 gallons a minute with a draw-down of 12 or 13 feet after pumping 10 hours. Irrigates 10 to 16 acres. See log. Well no. 15. Owner--Carl Graber. MP--top of concrete porch floor. Remarks--First and Lincoln Streets, Lawrence. See analysis. Well no. 16. Owner--Carl Graber. Remarks--East of well 15. See analysis. |
Brune Brothers have an irrigation well in the SE corner sec. 4, T. 12 S., R. 19 E., which is just north of Lakeview and 2 miles west of the western border of the map (fig. 6). It is 82 feet deep, is finished with 15 feet of concrete well screen that has an inside diameter of 15 inches and an outside diameter of 21 inches, and is gravel packed to a diameter of 42 inches. The well is equipped with a turbine pump driven by a tractor. The static water level is reported to be about 22 feet below the surface, and the well is reported to yield about 700 gallons a minute with a draw-down of only about 4 feet. The owner reported that the driller (Air Made Well Company, Kansas City) estimated that if a larger pump were used the well would readily deliver 1,500 gallons a minute. The owner reported that the water from this well is relatively free of iron, whereas the water from nearby shallow wells contains considerable iron.
The Kansas Electric Power Company has two drilled wells on the south side of Kansas river just upstream from the western border of the map (fig. 6) in sec. 14, T. 12 S., R. 19 E. The wells are about 53 feet deep, have 18-inch Layne stainless steel shutter screens, and are gravel packed to a diameter of 42 inches. Each well is reported to yield 600 gallons a minute with a draw-down of only 4 to 6 feet. The water is used for boiler feed, for plant use, and to cool bearings, but river water is used for condensing. The wells yield more water than is required at present, and generally only one well at a time is pumped 24 hours a day at a rate of only about 200 gallons a minute or less. The total daily pumpage ranges from 160,000 to 200,000 gallons.
The information on the irrigation and industrial wells cited above indicates that yields of 600 to 900 gallons a minute or more with relatively small draw-down are obtainable from properly constructed wells in the Kansas river valley near Lawrence. The large yield of the irrigation well of Brune Brothers is especially significant in indicating the potential yield of properly constructed wells in the deepest part of the alluvium.
The approximate shape of the water table in part of the valley north of Lawrence is shown by the water-table contours in figure 6. As a basis for constructing this map the altitude of the water level was determined at most of the wells described in table 2 and at some of the test holes southwest of the river.
Near the middle of the valley the contours trend almost at right angles to the axis of the valley, and the spacing of the contours indicates an average gradient or slope of about 3 1/2 feet to the mile from northwest to southeast.
The contours are observed to flex sharply downstream along Kansas river, and in the southern part of the mapped area the gradient is about 20 feet to the mile. It will be remembered that the river is dammed just below the Massachusetts Street bridge, as shown in the maps. The dam seems to hold the water in the reservoir somewhat above the normal level of the water table, for, as shown by the contours, the stream and reservoir above the dam are influent-that is, the stream is losing considerable water to the underground reservoir. In the vicinity of wells 15 and 16 (fig. 6) the water, which moves at right angles to the contour lines, is moving rapidly in a direction toward the downstream side of the dam. Thus, there seems to be considerable underground leakage of water through the sand and gravel from the reservoir to the river below the dam. A water-table contour map covering more of the valley would throw more light on the details of this movement, but the general trend seems to be well demonstrated by the contours in the small area mapped in figure 6.
The contour map was not extended far enough to the north to determine whether Mud creek is influent or effluent, but from the fact that Mud creek seems to be a perennial stream it may be inferred that in its course across the Kansas river valley it is probably influent to a slight extent.
Had the contouring been extended both upstream and downstream for several miles, probably it would have been found that in stretches of the valley in which the river assumes its normal gradient and is not dammed artificially, the river is in approximate equilibrium with respect to the water table, that is, it normally probably neither gains nor loses water to the ground-water reservoir. During floods from upstream areas, however, the river probably is influent; conversely, during periods of abundant rainfall locally but deficient rainfall in upstream areas, it may become effluent and take water from the underground reservoir.
To summarize, in the vicinity of Lawrence, Kansas river is an important factor in recharging the ground-water reservoir and discharge from the river locally increases the gradient from the normal gradient of about 3% feet to the mile to as much as 20 feet to the mile.
From the information given in table 1 and figures 5 and 6, it is possible to compute the approximate quantity of ground water moving down the valley each day as underflow, but the basic data used in this computation are subject to limitations as noted previously.
The coefficients of permeability (table 1) were determined from disturbed samples of material collected by the hydraulic rotary method; hence, as noted above, most of these samples may contain sufficient drilling mud to give a low value for the coefficient of permeability. An average hydraulic gradient of 3% feet to the mile may be assumed for most of the valley, but, as shown in figure 6, the gradient on the south side of the valley is about 20 feet to the mile. In the following computations (table 3) a gradient of only 10 feet to the mile is assumed for the south side of the valley because it is thought that all the water moving toward the downstream side of the dam under the unnaturally high gradient of 20 feet to the mile would not be recoverable by wells.
From the definition of the coefficient of permeability, it may be stated that the number of gallons of water (at 60° F.) moving down any segment of the valley is equal to the product of the width of the segment in miles, the thickness of the water-bearing material in feet, the average hydraulic gradient in feet per mile, and the average weighted coefficient of permeability. The data thus computed are given in table 3.
Table 3--Computation of underflow in the Kansas river valley north of Lawrence, based on data in table 1 and figures 5 and 6.
| Segment of cross section of valley, figure 5, between test holes, by number |
Width of segment, (miles) |
Average thickness of saturated material (feet) |
Assumed hydraulic gradient (feet per mile) |
Average weighted coefficient of permeability, from table 1 |
Approximate underflow (gallons a day) |
|---|---|---|---|---|---|
| T 18 to northeast bank |
0.25 | 50 | 3.5 | 2,490 | 109,000 |
| T 18 to T 17 | .37 | 53 | 3.5 | 3,608 | 241,000 |
| T 17 to T 16 | .35 | 58 | 3.5 | 4,080 | 290,000 |
| T 16 to T 15 | .65 | 47.5 | 3.5 | 2,497 | 270,000 |
| T 15 to T 20 | .475 | 32.5 | 3.5 | 1,276 | 69,300 |
| T 20 to T 14 | .25 | 30 | 10 | 1,325 | 99,400 |
| T 14 to T 13 | .175 | 33.3 | 10 | 1,885 | 110,000 |
| T13 to T21 | .075 | 35 | 10 | 2,006 | 52,800 |
| T21 to T12 | .08 | 34 | 10 | 2,585 | 54,600 |
| T 12 to T 4 | .30 | 29.5 | 10 | 2,261 | 200,000 |
| T 4 to southwest bank |
.05 | 25 | 10 | 1,256 | 15,710 |
| Total | 1,511,680 |
Although the total underflow, 1,511,680 gallons a day, as computed in table 3, probably is too low for the reasons given, the underflows for individual segments of the valley were computed from data of comparable accuracy and hence may be compared with one another. Thus, with reference to figure 5, it may be seen that the underflow is greatest on the north side of the valley where the water-bearing materials are thickest and most permeable. It is interesting to note that the underflow in the segment between test holes 17 and 16 is greater than that in the segment between test holes 16 and 15, even though the latter segment is nearly twice as wide as the former.
According to the U.S. Weather Bureau the mean annual precipitation at Lawrence is 36.73 inches, but in 1940 the total annual precipitation amounted to 42.58 inches. In any given area, detailed study covering a year or more is necessary in order to determine what percentage of the annual precipitation percolates downward to the water table and recharges the underground reservoir. No such studies have been made in the valley north of Lawrence, but certain tentative conclusions may be drawn from the amount of the precipitation and from the character of the soil and surficial deposits.
The logs and cross sections (fig. 5) indicate that the material above the water table is not as permeable as that at greater depth. Most of the surficial material is silty or sandy, however, and very little of it is clay. Moreover, as shown in figure 5, several old river channels have been cut through the surficial beds into the more permeable underlying material. Over most of the valley, therefore, conditions for recharge from rainfall seem to be good. The abandoned river channels (fig. 3) provide for the concentration and effective downward percolation of precipitation. In Kansas as a whole, the percentage of the annual precipitation that reaches the water table seems to range widely from probably less than 1 percent over parts of the High Plains to possibly 25 percent over some of the sand hills. It might be safe to assume that in the Kansas river valley north of Lawrence as much as 10 percent of the precipitation percolates through the porous surficial deposits and recharges the underground reservoir. This assumed amount of recharge would amount to a total of about 64 million gallons on each square mile annually.
Partial analyses of 34 samples of water collected from 33 test holes and private wells in the Kansas river valley are given in table 4. The samples were collected by Ellis D. Gordon and were analyzed in the Water and Sewage Laboratory of the Kansas State Board of Health by E. O. Holmes.
Table 4--Partial analyses of waters from test holes and wells in the Kansas river valley north of Lawrence. (All samples from alluvium except 17b, which is from sandstone of the Lawrence shale. Dissolved solids reported as parts per million. Collected by Ellis D. Gordon, analyzed by E. O. Holmes).
| No. of test hole or (*) well |
Location and depth | Date of collection, 1940 |
pH | Free carbon dioxide (CO2)1 |
Iron (Fe) |
Manganese (Mn) |
Calcium (Ca) |
Magnesium (Mg) |
Bicarbonate (HCO3) |
Chloride (Cl) |
Fluoride (F) |
Hardness (as CaCO3) | ||
|---|---|---|---|---|---|---|---|---|---|---|---|---|---|---|
| Total (soda reagent method) |
Carbonate | Non- carbonate |
||||||||||||
| 1 | NE NE 25-12-19, 46 ft. | Nov. 5 | 7.5 | 23 | 6.6 | 456 | 26 | 0.3 | 396 | 374 | 22 | |||
| 2 | SE NE 25-12-19, 44.5 ft. | Nov. 6 | 7.2 | 40 | 6.6 | 395 | 23 | .2 | 324 | 324 | 0 | |||
| 3 | NW NW 30-12-20, 45 ft. | Nov. 6 | 7.2 | 42 | 8.3 | 2.1 | 125 | 24 | 416 | 37 | .2 | 4112 | 341 | 70 |
| 4 | SW NW 30-12-20, 44 ft. | Nov. 6 | 7.2 | 41 | 11 | 403 | 23 | .2 | 380 | 330 | 50 | |||
| 5 | SW SW 19-12-20, 45.5 ft. | Nov. 7 | 7.1 | 59 | 13 | 466 | 15 | .3 | 350 | 3503 | 0 | |||
| 7 | SW cor. NW 19-12-20, 43.5 ft. | Nov. 8 | 7.1 | 65 | 12 | 1.1 | 126 | 21 | 510 | 12 | .2 | 4012 | 4013 | 0 |
| 8 | SE NE 24-12-19, 46 ft. | Nov. 9 | 6.9 | 105 | 16 | 527 | 21 | .1. | 420 | 4203 | 0 | |||
| 9 | SE NE 24-12-19, 47.5 ft. | Nov. 14 | 7.1 | 55 | 6.6 | 98 | 21 | 437 | 59 | .4 | 3312 | 3313 | 0 | |
| 10 | Middle NE 24-12-19, 49 ft. | Nov. 14 | 6.9 | 110 | 17 | 549 | 28 | .3 | 440 | 4403 | 0 | |||
| 12 | NE NW 24-12-20, 48 ft. | Nov. 16 | 7.3 | 31 | 7 | 124 | 24 | 476 | 46 | .4 | 4082 | 390 | 18 | |
| 13 | NE NE 24-12-20, 48 ft. | Nov. 18 | 7.1 | 76 | 6.7 | 1.8 | 135 | 30 | 605 | 78 | .3 | 4612 | 4613 | 0 |
| 14 | NW cor. NE 30-12-20, 43.5 ft. | Nov. 18 | 7.3 | 27 | 2.8 | 103 | 18 | 334 | 183 | .5 | 3312 | 274 | 57 | |
| 16 | NE cor. NW 20-12-20, 72 ft. | Nov. 19 | 6.9 | 85 | 1.6 | 422 | 16 | .3 | 356 | 346 | 10 | |||
| 17a | SE SE 17-12-20, 67.5 ft. | Nov. 20 | 6.9 | 86 | 1.5 | 113 | 14 | 425 | 6 | .3 | 3402 | 3403 | 0 | |
| 17b | Same location, 73 ft. | Nov. 20 | 7.1 | 53 | 2.0 | 420 | 32 | .4 | 330 | 3303 | 0 | |||
| 20 | NE SE 19-12-20, 41.5 ft. | Nov. 25 | 7.0 | 89 | 16 | 1.6 | .559 | 56 | .2 | 448 | 4483 | 0 | ||
| 21 | NE NW 30-12-20, 42 ft. | Nov. 26 | 7.1 | 85 | 13 | 154 | 32 | 673 | 23 | .1 | 5162 | 5163 | 0 | |
| 22 | SW NW 30-12-20, 52.5 ft. | Nov. 27 | 7.2 | 48 | 3.3 | 481 | 46 | .1 | 400 | 394 | 6 | |||
| 23 | SW NW 30-12-20, 46.5 ft. | Dec. 3 | 7.1 | 48 | 4.6 | 2.6 | 123 | 18 | 383 | 26 | .2 | 3812 | 314 | 67 |
| 25 | NE NW 30-12-20, 41 ft. | Dec. 4 | 6.9 | 132 | 14 | 3.1 | 666 | 38 | .3 | 502 | 5023 | 0 | ||
| 26 | SE SW 19-12-20, 45 ft. | Dec. 4 | 6.9 | 175 | 30 | 7 | 221 | 45 | 874 | 89 | .1 | 7372 | 716 | 21 |
| 27 | NE SW 19-12-20, 43.5 ft. | Dec. 4 | 7.0 | 105 | 9.3 | 2.4 | 160 | 28 | 659 | 68 | .2 | 5152 | 5153 | 0 |
| 28 | SE NW 19--12-20, 49.5 ft. | Dec. 5 | 7.0 | 125 | 19 | 2.6 | 786 | 92 | .1 | 640 | 6403 | 0 | ||
| 29 | NE NW 19-12-20, 45 ft. | Dec. 5 | 6.9 | 123 | 13 | 1.4 | 612 | 34 | .2 | 500 | 5003 | 0 | ||
| *2 | SW cor. SW 16-12-20, 45 ft. | Dec. 2 | 7.1 | 46 | .06 | .17 | 106 | 14 | 368 | 2.5 | .1 | 3222 | 302 | 20 |
| *4 | NE NW 18-12-20, 50 ft. | Dec. 9 | 7.0 | 61 | 14 | .7 | 383 | 3.0 | .3 | 308 | 3083 | 0 | ||
| *5 | NE NW 18-12-20, 36.6 ft. | Dec. 9 | 7.0 | 61 | 1.4 | .6 | 386 | 3.0 | .2 | 316 | 316 | 0 | ||
| *6 | NE NW 19-12-20. | Dec. 9 | 6.9 | 135 | 8.3 | 202 | 35 | 673 | 34 | .2 | 6842 | 552 | 96 | |
| *9 | NE NW 19-12-20, 23.6 ft. | Dec. 7 | 7.1 | 68 | 2.9 | 193 | 26 | 542 | 47 | .2 | 5892 | 444 | 145 | |
| *10 | SE NW 19-12-20, 25.5 ft. | Dec. 6 | 6.9 | 116 | .43 | 214 | 23 | 581 | 50 | .4 | 6292 | 476 | 153 | |
| *12 | NW cor. NE 20-12-20, 32.2 ft. | Dec. 2 | 7.1 | 51 | 1.4 | .21 | 119 | 13 | 400 | 1.5 | .2 | 3512 | 328 | 23 |
| *13 | SW cor. NW 20-12-20, 35.8 ft. | Dec. 2 | 7.0 | 62 | 3.9 | 118 | 13 | 387 | 6.0 | .3 | 3482 | 317 | 31 | |
| *15 | SE NW 30-12-20, 29.3 ft. | Dec. 2 | 6.9 | 265 | 49 | 6 | 274 | 69 | 1,313 | 41 | .1 | 9682 | 9683 | 0 |
| *16 | SE NW 30-12-20, 27 ft. | Dec. 6 | 6.9 | 156 | 22 | 5.3 | 780 | 38 | .2 | 626 | 6263 | 0 | ||
| 1 Not determined immediately after samples were collected, therefore amounts of carbon dioxide shown probably are too small. 2 Calculated. 3 See supplemental table for total and excess alkalinity. |
||||||||||||||
Supplement to Table 4--Total and excess alkalinity of samples, in parts per million.
| Test hole or (*) well | 5 | 7 | 8 | 9 | 10 | 13 | 17a | 17b | 20 |
|---|---|---|---|---|---|---|---|---|---|
| Total alkalinity | 382 | 418 | 432 | 358 | 450 | 494 | 348 | 344 | 458 |
| Excess alkalinity | 32 | 17 | 12 | 27 | 10 | 33 | 8 | 14 | 10 |
| Test hole or (*) well | 21 | 25 | 27 | 28 | 29 | *4 | *15 | *16 |
|---|---|---|---|---|---|---|---|---|
| Total alkalinity | 552 | 546 | 540 | 644 | 502 | 314 | 1076 | 640 |
| Excess alkalinity | 36 | 44 | 25 | 4 | 2 | 6 | 108 | 14 |
The waters sampled were very hard, ranging in total hardness from 308 to 968 parts per million. Most of the hardness, however, is in the form of carbonate or so-called temporary hardness, and very few of the waters had appreciable amounts of non-carbonate or permanent hardness. The waters from wells and test holes near the river generally were harder and somewhat higher in non-carbonate hardness than the waters in the middle and northern parts of the valley.
In most of the analyses the total hardness was calculated from the content of calcium and magnesium-the constituents that cause most of the hardness. In some analyses, however, the hardness was determined by the faster but less accurate soda-reagent method. In 10 analyses in which both methods were used, the values obtained by the soda-reagent method were about 5 percent lower.
The values given for the content of free carbon dioxide gas should not be taken as exact measurements of the content of this constituent in the natural ground water, as the determinations were made at varying intervals of time after the samples were collected. In general, therefore, the content indicated probably is lower than the true content. The content of free carbon dioxide as determined in the laboratory ranged from 23 to 265 parts per million and in most of the_samples was 50 to 100 parts.
As indicated in the table almost all of the waters contained iron in amounts sufficient to produce a reddish sediment on exposure to air, and several of the waters contained 10 to 49 parts per million of iron.
Manganese was determined in only 16 of the 34 samples, but most of the 16 samples contained sufficient quantities of manganese to precipitate on exposure to air.
The chloride content of the water in the alluvium was found to be relatively low, and was less than 100 parts per million in all but one sample. The water from test hole 14 contained 183 parts per million of chloride, but in a few wells the chloride content was only 1.5 to 6 parts.
As indicated on a preceding page, the deep-lying sandstones tapped by dairy wells in Lawrence yield brackish or salty water in some places. One of the upper sandstones was tapped at the bottom of test hole 17, and a sample of water was pumped from the sandstone in order to determine the chloride content. As given in the table, the sample of water from sandstone (17b) contained 32 parts per million of chloride whereas the sample from the overlying alluvium (17a) contained only 6 parts. Thus the chloride content of the water in the upper sandstone in this well is as low as that in most of the alluvium.
Fluoride in water has been shown to be associated with the dental defect known as mottled enamel, which may appear on the teeth of children who drink water containing damaging amounts of fluoride during the period of formation of the permanent teeth. It has been stated that waters containing 1 part per million or more of fluoride are likely to produce mottled enamel. although the effect of 1 part per million generally is not very serious (Dean, 1935, pp. 1269-1272). As indicated in the table, none of the waters sampled contained more than 0.5 part per million of fluoride and most of the waters contained only 0.1 to 0.3 part. Thus the quantities of fluoride present are well below the harmful limit for this constituent.
Information in regard to the chemical character and silt content of the water of Kansas river at Lawrence and Topeka is given below in tables 5 to 8.
Table 5--Monthly average hardness, alkalinity, and carbonate removal of raw and treated water from Kansas river at Lawrence in 1940. (Data from Frank Willey, superintendent, Lawrence Water Department.)
| Month | Raw water (parts per million, as CaCO3) |
Treated water | ||||
|---|---|---|---|---|---|---|
| Parts per million, as CaCO3) | Carbonates removed (tons) |
|||||
| Total hardness |
Non- carbonate hardness |
Total alkalinity |
Total hardness |
Total alkalinity |
||
| Jan. | 393 | 72 | 315 | 164 | 72 | 43.89 |
| Feb. | 308 | 56 | 253 | 156 | 64 | 30.94 |
| Mar. | 236 | 51 | 186 | 107 | 42 | 24.32 |
| Apr. | 262 | 42 | 223 | 97 | 46 | 32.18 |
| May. | 220 | 43 | 174 | 104 | 49 | 25.04 |
| June | 181 | 33 | 146 | 107 | 63 | 16.80 |
| July | 214 | 36 | 168 | 110 | 56 | 28.90 |
| Aug. | 164 | 33 | 127 | 119 | 56 | 13.84 |
| Sept. | 168 | 39 | 125 | 113 | 55 | 12.60 |
| Oct. | 211 | 44 | 164 | 111 | 49 | 23.76 |
| Nov. | 250 | 44 | 204 | 118 | 58 | 25.79 |
| Dec. | 258 | 44 | 214 | 116 | 67 | 26.29 |
| Average | 239 | 45 | 192 | 119 | 56 | 25.36 |
| Total | 304.35 | |||||
Table 6--Average chemical character of water from Kansas river at Topeka during 1940 (Anonymous, 1940, p. 34)
| (Parts per million) | |
|---|---|
| Silica (SiO2) | 26.8 |
| Iron (Fe) | 1.30 |
| Manganese (Mn) | 9.26 |
| Calcium (Ca) | 81.4 |
| Magnesium (Mg) | 15.8 |
| Sulphate (SO4) | 84.8 |
| Chloride (Cl) | 113.0 |
| Fluoride (F) | .43 |
| Total dissolved solids | 501 |
| Total hardness as CaCO3 | 264 |
| Carbonate hardness as CaCO3 | 224 |
| Non-carbonate hardness as CaCO3 | 40 |
| Turbidity | 2,955 |
Table 7--Monthly turbidity and silt content of water from Kansas river at Lawrence in 1940. (Data from Frank Willey, superintendent, Lawrence Water Department.)
| Month | Turbidity (parts per million) | Silt removed (tons) |
||
|---|---|---|---|---|
| Maximum | Minimum | Average | ||
| Jan. | 30 | 20 | 22 | 3.97 |
| Feb. | 73 | 20 | 34 | 5.56 |
| Mar. | 2,133 | 121 | 621 | 104.S9 |
| Apr. | 1,300 | 146 | 310 | 56.36 |
| May | 25,759 | 252 | 2,917 | 584.25 |
| June | 26,400 | 537 | 7,529 | 1,524.70 |
| July | 32,524 | 194 | 5,100 | 1,316.02 |
| Aug. | 42,S35 | 150 | 7,945 | 1,549.2 |
| Sept. | 11,125 | 403 | 4,442 | 799.42 |
| Oct. | 28,706 | 175 | 3,704 | 765.49 |
| Nov. | 1,217 | 167 | 519 | 91.69 |
| Dec. | 1,557 | 91 | 550 | 98.384 |
| Average | 14,471 | 190 | 2,80S | 574.99 |
| Total | 6,899.9 | |||
Table 8--Turbidity of water from Kansas river at Topeka, 1935-1940. (Anonymous, 1940, p. 35.)
| Parts per million | Number of days per year in | |||||
|---|---|---|---|---|---|---|
| 1935 | 1936 | 1937 | 1938 | 1939 | 1940 | |
| 0 to 100 | 5 | 108 | 39 | 25 | 95 | 57 |
| 101 to 999 | 185 | 152 | 150 | 135 | 138 | 133 |
| 1,000 to 3,999 | 119 | 52 | 93 | 83 | 48 | 82 |
| 4,090 to 9,999 | 43 | 46 | 71 | 115 | 67 | 71 |
| 10,000 to 19,999 | 12 | 8 | 12 | 7 | 17 | 19 |
| 20,000 and more | 1 | 0 | 0 | 0 | 0 | 4 |
The data in tables 5 and 6 indicate that the river water has a lower total hardness than the ground water (table 4). The noncarbonate hardness of the river water ranges from 33 to 72 parts per million. The non-carbonate hardness of some of the ground waters equals or exceeds that of the river water but is zero for many of the ground waters.
The river water seems to contain less iron but more manganese than most of the ground waters (table 6).
The chloride content of the river water (table 6) is greater than that of all but one of the ground waters analyzed, which may account for the fact that some of the ground waters near the river contain more chloride than those farther from the river. The fluoride content of the river water is low and is comparable to that of the ground water.
Ground water obtained from properly constructed wells in the alluvium of the Kansas river valley should be clear and free of turbidity except for possible precipitation of iron and manganese in raw-water mains prior to treatment. An indicated in tables 7 and 8, however, the river water is nearly always turbid and. during a large part of the year it is very turbid. In 1940 the average monthly turbidity of the river water at Lawrence (table 7) ranged from 22 to 7,945 parts per million and averaged 2,808 parts. In 1940 a total of 6,899.9 tons of silt was removed from the total quantity of river water pumped to the treatment plant. Table 8 indicates that on 23 days in 1940 the turbidity of the river water at Topeka was more than 10,000 parts per million and on 4 of those days it was more than 20,000 parts. To quote from the 1940 Report of the Topeka Water and Light Department (p. 30),
During 1940 the plant removed over 23,000 tons of turbidity (mud). The average turbidity was 2,955 [parts] per million (all removed) the highest in the history of the plant. This indicates that the Kaw [Kansas] River was more than 6 times more turbid than the muddy Mississippi at New Orleans.
To summarize, the water of Kansas river contains somewhat less dissolved mineral matter and is softer than the ground water in the alluvium, but whereas the ground water is clear, the river water is very turbid most of the time, necessitating the removal of thousands of tons of silt each year. Moreover, as discussed previously, at certain times of the year, algae or decaying vegetation or both impart noxious tastes and odors to the river water, and it has not always proved practicable to remove completely the taste and odor. Another serious objection to the use of the river water is the pollution in the river resulting from upstream sewage discharge.
The Pennsylvanian bedrock in the vicinity of Lawrence contains beds of sandstone that yield water in sufficient quantity for use by small industries, such as dairies, but the water from most of the wells is reported to be brackish or salty and hence is unsuited for domestic or public water supply.
The test drilling and other field and laboratory work done during the course of the present investigation indicate that the alluvium in the Kansas river valley is by far the most productive source of ground water in the vicinity of Lawrence. The alluvium consists mainly of permeable sand and gravel-especially below the water table-but at or near the surface it contains also beds of silt and a few thin beds of clay. The total thickness of the alluvium ranges from about 40 feet along the south side of the valley to as much as 80 feet in the deepest part of the old bedrock channel (figs. 4 and 5). The thickness of the saturated part of the alluvium ranges from about 25 feet along the south side of the valley to about 60 feet in the northern part of the valley. The thickest, coarsest, and most permeable water-bearing materials were those encountered in the deepest part of the bedrock valley by test holes 16,17, and 18 (fig. 5).
The alluvium yields adequate supplies of water to many domestic and stock wells and to several irrigation and industrial wells, and formerly supplied the needs of the city of Lawrence. The available information indicates that yields of 600 to 900 gallons a minute, or even more, with relatively small draw-down are obtainable from properly constructed wells in the Kansas river valley near Lawrence.
The water-table contour map of a part of the valley (fig. 6) indicates that in general the hydraulic gradient is about 3.5 feet to the mile but that near the river the gradient is as much as 20 feet to the mile and the shape of the contours indicates that water from the dammed part of the river is entering the ground-water reservoir. The total underflow of ground water down the valley, computed from available data on the gradient and on the thickness, permeability, and extent of the alluvium, amount to 1,511,680 gallons a day, but this value probably is too low for reasons given in this report. If the rate of withdrawal by heavy pumping, such as for public water supply, should equal or exceed the total underflow, water would be taken from storage with an attendant lowering of the water table. The lowering of the water table below the level of the river, however, would allow recharge to take place from the river to the ground-water reservoir. Recharge from local rainfall would constitute another source of water to replace withdrawals from storage, and, as pointed out above, a conservative estimate of recharge from this source would be about 64,000,000 gallons annually on each square mile. Thus it is conservatively estimated that recharge from Kansas river and from local precipitation plus the recoverable part of the underflow from upstream areas would be sufficient to maintain a ground-water development of 2,000,000 to 3,000,000 gallons a day from a group of properly constructed wells situated so as to take the fullest advantage of the local conditions.
As indicated in table 4, the ground water in the alluvium is very hard, owing mainly to calcium and magnesium bicarbonate, contains 'considerable iron and manganese, and probably contains considerable free carbon dioxide. The hardness, however, can be reduced by relatively simple treatment, and, with proper aeration and treatment, the iron, manganese, and carbon dioxide can be eliminated. The ground water is low in chloride and the samples analyzed contained only 0.5 part per million or less of fluoride. Ground water from properly constructed wells should not be turbid and should be entirely free of the noxious tastes and odors that are present in the river water. It is believed that the ground water can be treated much more easily and cheaply than the river water, and that the treated ground water will be more palatable.
The most favorable location for a large ground-water development in the vicinity of Lawrence is in that part of the valley north of the river, preferably as far north as section 17, where the waterbearing materials are thickest and most permeable (figs. 4 and 5). If more than one well is employed, the wells should be situated along a line trending northeast, at right angles to the direction of ground-water movement (fig. 7). In order to prevent local overdevelopment, the wells should be spaced as far apart as practicable--preferably a quarter mile or more, and the rate of pumping from individual wells should be limited to 500 gallons or at most to 700 gallons a minute, even though pumping tests indicate much larger potential yields. The maximum development of sand-free water with the minimum draw-down would entail the use of wells of the gravel-wall type of construction. Each well should be drilled to bedrock, and should be preceded by test holes to determine the thickness and character of the water-bearing material, the proper length and slot-size screen to employ, and the proper grade of screened gravel to use in gravel packing the final well.
Anonymous, 1940, 1940 Report of the Water and Light Department, Topeka, Kansas, pp. 1-45, illus.
Dean, H. T., 1936, Chronic endemic dental fluorosis: Jour. Amer. Med Assoc., vol. 107, pp. 1269-1272.
Haskins, C. A., and Young, C. C., 1915, Water supplies of Kansas, Part 1, ground-water supplies: Univ. of Kansas Eng. Exper. Sta., Bull. 5, pp. 1-187, pls, 1-12.
Lohman, S. W., and Frye, J. C., 1940, Geology and ground-water resources of the "Equus beds" area in south-central Kansas: Econ. Geology, vol. 35, pp. 839-866, figs. 1-5.
Moore, Raymond C., 1940, Ground-water resources of Kansas: Kansas Geol. Survey, Bull. 27, pp. 1-79, pls. 1-34.
Schwab, J. W., 1916, The removal of iron from municipal water supplies: Univ. of Kansas Eng. Exp. Sta., Bull. 1, pp. 1-41, illus.
Stearns, N. D., 1927, Laboratory tests on physical properties of water-bearing materials: U. S. Geol. Survey, Water-Supply Paper 596-F, pp. 121-176, pls. 11-13, figs. 18-26.
(Locations shown in figure 4)
| Log of test hole 1 in the NE NE sec. 25, T. 12 S., R. 19 E. Surface altitude, 815.5 feet. (Authority, samples studied by Perry McNally and Charles C. Williams). | Thickness (feet) |
Depth (feet) |
|
|---|---|---|---|
| Alluvium | |||
| Soil, silty, dark, containing some sand and gravel | 2.5 | 2.5 | |
| Soil, silty, dark | 3.5 | 6 | |
| Soil, silty clay, dark brown (Water level, 13 feet below land surface) |
7 | 13 | |
| Sand, coarse, and gravel, fine | 7 | 20 | |
| Gravel, medium, and sand, coarse | 10 | 30 | |
| Gravel, medium and fine | 10 | 40 | |
| Gravel, coarse to fine | 5.5 | 45.5 | |
| Lawrence shale | |||
| Shale, sandy, light gray, and sandstone | 4.5 | 50 | |
| Log of test hole 2 in the SE NE sec. 25, T. 12 S., R. 19 E. Surface altitude, 815.8 feet. (Authority, samples studied by Perry McNally and Charles C. Williams). | Thickness (feet) |
Depth (feet) |
|
|---|---|---|---|
| Alluvium | |||
| Soil, earthy, black | 10.5 | 10.5 | |
| Clay, dark blue to gray | 10.5 | 21 | |
| Gravel, fine, and sand, coarse | 9 | 40 | |
| Gravel, medium to fine | 10 | 40 | |
| Gravel, medium to fine | 4.5 | 44.5 | |
| Lawrence shale | |||
| Shale, sandy, gray, and sandstone | 5.5 | 50 | |
| Log of test hole 3 in the NW NW sec. 30, T. 12 S., R. 20 E. Surface altitude, 814.9 feet: (Authority, samples studied by Perry McNally and Charles C. Williams). | Thickness (feet) |
Depth (feet) |
|
|---|---|---|---|
| Alluvium | |||
| Soil, dark | 1 | 1 | |
| Sand, fine, light tan | 2 | 3 | |
| Clay, soft, dark | 11 | 14 | |
| Gravel, fine to coarse, and sand, coarse | 6 | 20 | |
| Gravel, fine, and sand, coarse | 10 | 30 | |
| Sand, coarse, and gravel, fine | 10 | 40 | |
| Gravel, fine, and sand, coarse | 5 | 45 | |
| Lawrence shale | |||
| Shale, sandy, light gray | 5 | 50 | |
| Log of test hole 4 in the SW NW sec. 30, T. 12 S., R. 20 E. Surface altitude, 814.4 feet. (Authority, samples studied by Perry McNally and Charles C. Williams). | Thickness (feet) |
Depth (feet) |
|
|---|---|---|---|
| Alluvium | |||
| Soil, earthy, black | 5 | 5 | |
| Clay, dark blue to gray | 8 | 13 | |
| Sand, coarse to medium | 7 | 20 | |
| Gravel, fine, and sand, coarse to medium | 7 | 27 | |
| Clay and sand (sample contained too much heavy drilling mud to determine) | 2 | 29 | |
| Sand, medium | 5 | 34 | |
| Gravel, fine, and sand, coarse | 6 | 40 | |
| Sand, coarse, and gravel, fine | 4 | 44 | |
| Lawrence shale | |||
| Shale, sandy, light gray | 3 | 47 | |
| Log of test hole 5 in the SW SW sec. 19, T. 12 S., R. 20 E. Surface altitude, 818.0 feet. (Authority, samples studied by Perry McNally and Charles C. Williams). | Thickness (feet) |
Depth (feet) |
|
|---|---|---|---|
| Alluvium | |||
| Sand, medium, brown | 11 | 11 | |
| Sand, medium to coarse, brown | 4 | 15 | |
| Sand, medium | 5 | 20 | |
| Gravel, fine, to sand, medium | 10 | 30 | |
| Gravel, fine to coarse | 10 | 40 | |
| Sand, coarse to medium | 5.5 | 45.5 | |
| Lawrence shale | |||
| Shale, sandy, gray, and sandstone | 4.5 | 50 | |
| Log of test hole 6 in the SW NE SE sec. 24, T. 12 S., R. 19 E. Surface altitude, 817.7 feet. (Authority, samples studied by Perry McNall'll and Charles C. Williams.) | Thickness (feet) |
Depth (feet) |
|
|---|---|---|---|
| Alluvium | |||
| Soil, sandy, dark | 4 | 4 | |
| Sand, medium, brown | 6 | 10 | |
| Sand, medium, brown | 10 | 20 | |
| Sand, medium to coarse | 4 | 24 | |
| Sand, medium, to gravel, fine | 6 | 30 | |
| Sand, coarse | 10 | 40 | |
| Gravel, medium and coarse, some fine | 7.5 | 47.5 | |
| Lawrence shale | |||
| Shale, sandy, gray, and sandstone | 2.5 | 50 | |
| Log of test hole 7 in the SW corner NW sec. 19, T. 12 S., R. 20 E. Surface altitude, 817.2 feet. (Authority, samples studied by Perry McNally and Charles C. Williams.) | Thickness (feet) |
Depth (feet) |
|
|---|---|---|---|
| Alluvium | |||
| Soil, sandy, dark | 10 | 10 | |
| Sand, medium to coarse | 10 | 20 | |
| Gravel, fine, and sand, coarse | 10 | 30 | |
| Sand, coarse, and gravel, fine | 10 | 40 | |
| Sand, coarse | 3.5 | 43.5 | |
| Lawrence shale | |||
| Sandstone, hard, light gray | 5.5 | 49 | |
| Log of test hole 8 in the SE NE sec. 24, T. 12 S., R. 19 E. Surface altitude, 819.2 feet. (Authority, samples studied by Perry McNally and Charles C. Williams.) | Thickness (feet) |
Depth (feet) |
|
|---|---|---|---|
| Alluvium | |||
| Soil, sandy, brown | 1 | 1 | |
| Soil, black | 7 | 8 | |
| Sand, medium to fine, brown (Water level, 9.2 feet below land surface) |
2 | 10 | |
| Sand, medium to fine | 9 | 19 | |
| Sand, medium to coarse, gray | 11 | 30 | |
| Gravel, coarse to fine, and sand, coarse to medium | 10 | 40 | |
| Gravel, fine, and sand, coarse | 6 | 46 | |
| Lawrence shale | |||
| Shale, sandy, light gray | 4 | 50 | |
| Log of test hole 9 in the SE NE sec. 24, T. 12 S., R. 19 E. Surface altitude, 821.6 feet. (Authority, samples studied by Perry McNally and Charles C. Williams.) | Thickness (feet) |
Depth (feet) |
|
|---|---|---|---|
| Alluvium | |||
| Sand, fine, earthy | 10 | 10 | |
| Sand, coarse, and gravel, fine | 13 | 23 | |
| Sand, coarse (Water level, 11.8 feet below land surface) |
7 | 30 | |
| Sand, coarse to medium | 10 | 40 | |
| Sand, medium | 7.5 | 47.5 | |
| Lawrence shale | |||
| Shale, sandy, light gray, and sandstone | 2.5 | 50 | |
| Log of test hole 10 in the center of NE sec. 24, T. 12 S., R. 19 E. Surface altitude, 821.4 feet. (Authority, samples studied by Perry McNally and Charles C. Williams.) | Thickness (feet) |
Depth (feet) |
|
|---|---|---|---|
| Alluvium | |||
| Soil, silty, dark | 11 | 11 | |
| Sand, coarse to fine, and gravel, fine (Water level, 12.4 feet below land surface) |
9 | 20 | |
| Sand, coarse, and gravel, fine | 2 | 22 | |
| Sand, coarse to fine, and gravel, fine | 8 | 30 | |
| Sand, coarse to medium | 10 | 40 | |
| Sand, coarse | 9 | 49 | |
| Lawrence shale | |||
| Shale, sandy, light gray, and sandstone | 1 | 50 | |
| Log of test hole 11 in the middle of sec. 24, T. 12 S., R. 19 E. Surface altitude, 856.1 feet. (Authority, samples studied by Perry McNally) | Thickness (feet) |
Depth (feet) |
|
|---|---|---|---|
| Older alluvium | |||
| Soil, clay, silty, dark | 3 | 3 | |
| Clay, silty, yellow brown | 6 | 9 | |
| Clay, silty, light gray | 3 | 12 | |
| Sand, fine to coarse, dirty | 4.5 | 16.5 | |
| Sand and gravel, poorly sorted, orange brown | 3.5 | 20 | |
| Lawrence shale | |||
| Shale and sandstone, yellow green to gray | 5.5 | 25.5 | |
| Shale, dark blue gray | 4.5 | 30 | |
| Log of test hole 12 in the NE NW sec. 24, T. 12 S., R. 20 E. Surface altitude, 816.2 feet. (Authority, samples studied by Perry McNally and Charles C. Williams.) | Thickness (feet) |
Depth (feet) |
|
|---|---|---|---|
| Alluvium | |||
| Soil, sandy, dark brown (Water level, 12.6 feet below land surface) |
14 | 14 | |
| Sand, coarse, and sand, medium | 6 | 20 | |
| Gravel, medium and coarse, and sand, coarse and medium | 10 | 30 | |
| Sand, coarse, and gravel, fine to coarse | 10 | 40 | |
| Gravel, fine, and sand, coarse | 8 | 48 | |
| Lawrence shale | |||
| Shale, sandy, light gray, and sandstone | 2 | 50 | |
| Log of test hole 13 in the NE NE sec. 24, T. 12 S., R. 20 E. Surface altitude, 816.9 feet. (Authority, samples studied by Perry McNally and Charles C. Williams.) | Thickness (feet) |
Depth (feet) |
|
|---|---|---|---|
| Alluvium | |||
| Road fill, soil and rock | 6 | 6 | |
| Soil, silty, dark brown | 4 | 10 | |
| Sand, coarse and medium, and some fine gravel (Water level, 12.8 feet below land surface) |
10 | 20 | |
| Sand, coarse, and gravel, fine | 10 | 30 | |
| Sand, medium, to gravel, coarse | 10 | 40 | |
| Sand, medium, and some coarse sand | 8 | 48 | |
| Lawrence shale | |||
| Coal, black, and shale, sandy, light gray | 2 | 50 | |
| Log of test hole 14 in the NW corner NE sec. 30, T. 12 S., R. 20 E. Surface altitude, 816.6 feet. (Authority, samples studied by Perry McNally and Charles C. Williams.) | Thickness (feet) |
Depth (feet) |
|
|---|---|---|---|
| Alluvium | |||
| Soil, silty, sandy, brown (Water level, 10.8 feet below land surface) |
13 | 13 | |
| Sand, coarse to medium, and some fine gravel | 7 | 20 | |
| Gravel, coarse to fine, and sand, coarse and medium | 10 | 30 | |
| Gravel, fine to coarse, and sand, coarse | 13.5 | 43.5 | |
| Lawrence shale | |||
| Sandstone, light gray, a hard boulder bed just above it | 6.5 | 50 | |
| Log of test hole 15 in the SW corner NW sec. 20, T. 12 S., R. 20 E. Surface altitude, 829.4 feet. (Authority, samples studied by Perry McNally and Charles C. Williams.) | Thickness (feet) |
Depth (feet) |
|
|---|---|---|---|
| Alluvium | |||
| Soil, black | 3 | 3 | |
| Clay, silty, light brown | 8 | 11 | |
| Sand, very fine to medium, tan | 11 | 22 | |
| Sand, coarse, and some fine gravel (Water level, about 22 feet below land surface) |
8 | 30 | |
| Sand, coarse, and gravel, fine to medium | 10 | 40 | |
| Sand, medium to coarse, and gravel, fine | 10 | 50 | |
| Sand, coarse to medium, and gravel, fine | 7 | 57 | |
| Lawrence shale | |||
| Shale, sandy, light gray, and some hard brown sandstone | 3 | 60 | |
| Log of test hole 16 in the NE corner NW sec. 20, T. 12 S., R. 20 E. Surface altitude, 821.5 feet. (Authority, samples studied by Perry McNally and Charles C. Williams.) | Thickness (feet) |
Depth (feet) |
|
|---|---|---|---|
| Alluvium | |||
| Soil, silty, dark | 6 | 6 | |
| Soil, silty, brown | 2 | 8 | |
| Sand, coarse, brown, and some medium sand | 2 | 10 | |
| Sand, medium to coarse (Water level, 14 feet below land surface) |
10 | 20 | |
| Sand, coarse to medium, and some gravel, fine | 5 | 25 | |
| Sand, coarse, to gravel, coarse | 5 | 30 | |
| Sand, coarse to medium, and some gravel, fine | 9 | 39 | |
| Sand, coarse, to gravel, coarse | 4 | 43 | |
| Gravel, fine, and sand, coarse | 7 | 50 | |
| Gravel, fine to coarse, and sand, coarse | 10 | 60 | |
| Sand, coarse, containing boulders | 12 | 72 | |
| Lawrence shale | |||
| Shale, sandy, gray, and sandstone | 8 | 80 | |
| Log of test hole 17 in the middle of SE sec. 17, T. 12 S., R. 20 E. Surface altitude, 815.7 feet. (Authority, samples studied by Perry McNally and Charles C. Williams.) | Thickness (feet) |
Depth (feet) |
|
|---|---|---|---|
| Alluvium | |||
| Soil, silty, sandy, dark | 8 | 8 | |
| Soil, silty, containing abundant shell fragments (Water level, 8.2 feet below land surface) |
1 | 9 | |
| Sand, fine, brown | 5 | 14 | |
| Sand, coarse to medium, and some gravel, fine | 7 | 21 | |
| Sand, coarse to medium, brown to green | 5 | 26 | |
| Gravel, coarse, to sand, medium | 4 | 30 | |
| Gravel, coarse to fine | 10 | 40 | |
| Gravel, coarse to fine | 10 | 50 | |
| Gravel, coarse to fine | 10 | 60 | |
| Gravel, coarse and medium | 7.5 | 67.5 | |
| Lawrence shale | |||
| Sandstone, light gray and brown | 2.5 | 70 | |
| Sandstone, fine grained, light gray | 10 | 80 | |
| Log of test hole 18 in the SE corner NE sec. 17, T. 12 S., R. 20 E. Surface altitude, 829.4 feet. (Authority, samples studied by Perry McNally and Charles C. Williams.) | Thickness (feet) |
Depth (feet) |
|
|---|---|---|---|
| Alluvium | |||
| Soil, silty, dark brown | 3 | 3 | |
| Soil, silty, clayey, dark | 5 | 8 | |
| Clay, silty, dark | 4 | 12 | |
| Clay, silty, light brown | 8 | 20 | |
| Clay, silty, light yellow (Water level, 21.4 feet below land surface) |
6 | 26 | |
| Clay, silty, dark | 3.5 | 29.5 | |
| Sand, medium, and some coarse sand | 5.5 | 35 | |
| Sand, medium to coarse | 4 | 39 | |
| Gravel, coarse to fine | 11 | 50 | |
| Gravel, fine to coarse, and some sand, coarse | 12 | 62 | |
| Gravel, coarse to fine, and some sand, coarse | 8 | 70 | |
| Gravel, coarse to fine | 9 | 79 | |
| Lawrence shale | |||
| Sandstone, yellow green | 1 | 80 | |
| Log of test hole 19 in the SE corner SW sec. 9, T. 12 S., R. 20 E. Surface altitude, 883.0 feet. (Authority, samples studied by Perry McNally.) | Thickness (feet) |
Depth (feet) |
|
|---|---|---|---|
| Older alluvium | |||
| Clay, silty, reddish | 3 | 3 | |
| Clay, silty, light gray and brown | 4 | 7 | |
| Clay, silty, yellow | 2 | 9 | |
| Clay, silty, orange yellow and light gray | 5.5 | 14.5 | |
| Sand, fine to coarse, yellow brown | 6.5 | 21 | |
| Clay, silty, containing concretions of limonite | 4 | 25 | |
| Clay, silty, orange yellow and light gray | 2 | 27 | |
| Gravel, poorly sorted, orange brown, containing concretions of limonite | 6.5 | 33.5 | |
| Sand and gravel, brown, and some cobbles | 10 | 43.5 | |
| Lawrence shale | |||
| Shale, gray | 6.5 | 50 | |
| Log of test hole 20 in the NE SE sec. 19, T. 12 S., R. 20 E. Surface altitude, 813.1 feet. (Authority, samples studied by Perry McNally and Charles C. Williams.) | Thickness (feet) |
Depth (feet) |
|
|---|---|---|---|
| Alluvium | |||
| Soil, sandy, dark | 3 | 3 | |
| Soil, clayey, silty, muddy gray (Water level, 6.9 feet below land surface) |
9 | 12 | |
| Gravel, fine to coarse, and sand, coarse | 9 | 21 | |
| Gravel, fine to coarse, and sand, coarse | 20.5 | 41.5 | |
| Lawrence shale | |||
| Sandstone, medium grained, light gray | 3.5 | 45 | |
| Log of test hole 21 in the NE NW sec. 30, T. 12 S., R. 20 E. Surface altitude 811.0 feet. (Authority, samples studied ,by Perry McNally and Charles C. Williams.) | Thickness (feet) |
Depth (feet) |
|
|---|---|---|---|
| Alluvium | |||
| Soil, sandy, dark | 8 | 8 | |
| Sand, medium to coarse, brown | 4 | 12 | |
| Gravel, coarse to medium, and sand, coarse to medium | 8 | 20 | |
| Gravel, coarse to fine, and some coarse sand | 10 | 30 | |
| Gravel, fine to coarse, and sand, coarse | 10 | 40 | |
| Sand, coarse, and gravel, fine to coarse | 2 | 42 | |
| Lawrence shale | |||
| Shale, sandy, light gray | 3 | 45 | |
| Log of test hole 22 in the SW NW sec. 30, T. 12 S., R. 20 E. Surface altitude 821.7 feet. (Authority, samples studied by Perry McNally and Charles C. Williams.) | Thickness (feet) |
Depth (feet) |
|
|---|---|---|---|
| Alluvium | |||
| Sand, fine, brown | 9 | 9 | |
| Silt, soft, plastic, brown | 2 | 11 | |
| Sand, coarse to medium (Water level, 19.3 feet below land surface) |
9 | 20 | |
| Sand, coarse to medium, and gravel, fine | 8 | 28 | |
| Clay, silty, dark gray | 10 | 38 | |
| Gravel, fine to coarse, and sand, coarse to medium | 12 | 50 | |
| Sand, coarse to medium, and some gravel, fine | 2.5 | 52.5 | |
| Lawrence shale | |||
| Sandstone, light gray, and shale, sandy | 2.5 | 55 | |
| Log of test hole 23 in the SW NW sec. 30, T. 12 S., R. 20 E. Surface altitude 814.8 feet. (Authority, samples studied by Perry McNally and Charles C. Williams.) | Thickness (feet) |
Depth (feet) |
|
|---|---|---|---|
| Alluvium | |||
| Soil, sandy, brown | 5 | 5 | |
| Sand, fine, brown | 2 | 7 | |
| Clay, silty, dark | 3 | 10 | |
| Sand, coarse, and gravel, fine (Water level, 14.35 feet below land surface) |
10 | 20 | |
| Sand, coarse to medium, and some fine gravel | 2.5 | 22.5 | |
| Clay, silty, dark blue gray | 13.5 | 36 | |
| Sand, coarse, and gravel, fine | 4 | 40 | |
| Sand, coarse to medium | 6.5 | 46.5 | |
| Lawrence shale | |||
| Shale, sandy, light gray, and sandstone | 1.5 | 48 | |
| Log of test hole 24 in the SW NW sec. 30, T. 12 S., R. 20 E. Surface altitude, 818.2 feet. (Authority, samples studied by Perry McNally and Charles C. Williams.) | Thickness (feet) |
Depth (feet) |
|
|---|---|---|---|
| Alluvium | |||
| Soil, sandy, brown | 10.5 | 10.5 | |
| Sand, coarse to medium, brown | 6.5 | 17 | |
| Sand, coarse, and gravel, fine (Water level, 16.15 feet below land surface) |
3 | 20 | |
| Sand, coarse to medium, and gravel, fine | 10 | 30 | |
| Sand, coarse to medium, and gravel, fine to coarse | 10 | 40 | |
| Gravel, fine to coarse, and some sand, coarse | 9.5 | 49.5 | |
| Lawrence shale | |||
| Shale, sandy, light gray, and sandstone | 2.5 | 52 | |
| Log of test hole 25 in the NE NW sec. 30, T. 12 S., R. 20 E. Surface altitude, 814.8 feet. (Authority, samples studied by Perry McNally and Charles C. Williams.) | Thickness (feet) |
Depth (feet) |
|
|---|---|---|---|
| Alluvium | |||
| Soil, dark | 1.5 | 1.5 | |
| Silt, brown, and sand, fine (Water level, 8 feet below land surface) |
6.5 | 8 | |
| Gravel, fine to coarse, and sand, coarse to medium | 6 | 14 | |
| Sand, coarse to medium, and gravel, fine to coarse | 6 | 20 | |
| Gravel, fine to coarse, and sand, coarse | 10 | 30 | |
| Gravel, coarse to fine, and sand, coarse | 11 | 41 | |
| Lawrence shale | |||
| Sandstone, light gray | 4 | 45 | |
| Log of test hole 26 in the SE SW sec. 19, T. 12 S., R. 20 E. Surface altitude, 820.0 feet. (Authority, samples studied by Perry McNally and Charles C. Williams.) | Thickness (feet) |
Depth (feet) |
|
|---|---|---|---|
| Alluvium | |||
| Soil, containing some sand and cinders | 8 | 8 | |
| Clay soil, silty, gray | 5 | 13 | |
| Sand, coarse to medium, and some gravel, fine (Water level, 14.9 feet below land surface) |
6 | 19 | |
| Sand, coarse to medium, and some gravel, fine | 11 | 30 | |
| Gravel, coarse to fine, and some sand, coarse | 10 | 40 | |
| Gravel, coarse to fine, and sand, coarse | 5 | 45 | |
| Lawrence shale | |||
| Sandstone, light gray, and shale, sandy | 5 | 50 | |
| Log of test hole 27 in the NE SW sec. 19, T. 12 S., R. 20 E. Surface altitude, 815.9 feet. (Authority, samples studied by Perry McNally and Charles C. Williams.) | Thickness (feet) |
Depth (feet) |
|
|---|---|---|---|
| Alluvium | |||
| Soil, dark | 1.5 | 1.5 | |
| Sand, medium, brown (Water level, 6.95 feet below land surface) |
9.5 | 11 | |
| Gravel, fine, and sand, coarse | 9 | 20 | |
| Gravel, fine to coarse, and sand, coarse | 10 | 30 | |
| Sand, coarse, and gravel, fine to coarse | 13.5 | 43.5 | |
| Lawrence shale | |||
| Clay, silty, light gray, and shale | 1.5 | 45 | |
| Log of test hole 28 in the SE NW sec. 19, T. 12 S., R. 20 E. Surface altitude, 822.5 feet. (Authority, samples studied by Perry McNally and Charles C. Williams.) | Thickness (feet) |
Depth (feet) |
|
|---|---|---|---|
| Alluvium | |||
| Soil, dark | 1 | 1 | |
| Sand, fine, light tan, and sand, medium (Water level, 12.86 feet below land surface) |
15 | 16 | |
| Sand, coarse, gray, to gravel, medium | 14 | 30 | |
| Gravel, fine to coarse, and sand, coarse | 10 | 40 | |
| Gravel, coarse to fine, and some sand, coarse | 9.5 | 49.5 | |
| Lawrence shale | |||
| Clay, silty, light gray, and shale, sandy | .5 | 50 | |
| Log of test hole 29 in the NE NW sec. 19, T. 12 S., R. 20 E. Surface altitude, 817.5 feet. (Authority, samples studied by Perry McNally and Charles C. Williams.) | Thickness (feet) |
Depth (feet) |
|
|---|---|---|---|
| Alluvium | |||
| Soil, silty, dark (gumbo at top) | 7 | 7 | |
| Sand, fine to coarse, interbedded with silty clay (Water level, 7.5 feet below land surface) |
4 | 11 | |
| Sand, coarse to medium, and gravel, fine to coarse | 10 | 21 | |
| Gravel, fine to coarse, and sand, coarse to medium | 9 | 30 | |
| Sand, coarse, and gravel, fine to coarse | 10 | 40 | |
| Gravel, fine to coarse, and sand, fine to medium | 5 | 45 | |
| Lawrence shale | |||
| Sandstone, hard, light gray | 4 | 49 | |
(Locations shown in Figure 6)
| Log of well on the Charles B. Young farm, SW corner SE NE sec. 7, T. 12 S., R. 20 E. (Authority, American Butter Co., tenant.) | Thickness (feet) |
Depth (feet) |
|
|---|---|---|---|
| Alluvium | |||
| Sand, fine to medium, gray | 40 | 40 | |
| Sand, coarse, and gravel, fine; brown | 10 | 50 | |
| Sand, medium, and gravel, coarse; brown | 5 | 55 | |
| Gravel, coarse, and some sand; brown | 8 | 63 | |
| Sand, medium, and gravel, coarse | 4 | 67 | |
| Gravel, coarse, and sand; brown | 3 | 70 | |
| Sand, medium, and gravel, coarse | 4 | 74 | |
| Gravel, medium, and sand, fine | 3 | 77 | |
| Gravel, coarse, and sand, medium | 3 | 80 | |
| Gravel, coarse, and sand, fine; iron stained and contains limonite concretions | 3 | 83 | |
| Lawrence shale | |||
| Shale, silty | 1 | 84 | |
| Log of well 3 on property owned by the University of Kansas in the SE SW sec. 17, T. 12 S., R. 20 E. (Authority, W. H. Hayden, tenant.) | Thickness (feet) |
Depth (feet) |
|
|---|---|---|---|
| Alluvium | |||
| Clay, brownish yellow | 13.5 | 13.5 | |
| Sand, fine, white | .5 | 14 | |
| Clay, yellow brown | 12 | 26 | |
| Sand, coarse, and gravel, fine | 12 | 38 | |
| Clay, black | 1 | 39 | |
| Gravel, coarse, containing boulders | 3.5 | 42.5 | |
| Clay, black | 4.5 | 47 | |
| Gravel, coarse, gray | 7 | 54 | |
| Log of well 14 on the W. H. Pendleton farm in the NE SE sec. 20, T. 12 S., R. 20 E. (Authority, G. E. Robinson, tenant.) | Thickness (feet) |
Depth (feet) |
|
|---|---|---|---|
| Alluvium | |||
| Soil | 6 | 6 | |
| Sand, fine, white | 8 | 14 | |
| Sand and gravel, brown | 3 | 17 | |
| Sand, fine, white | 4 | 21 | |
| Gravel and sand, coarse; brown | 14 | 35 | |
| Clay, black | 1 | 36 | |
| Gravel, coarse, and sand; brown | 14 | 50 | |
| Log of well of the Kansas Electric Power Co. in sec. 14, T. 12 S., R. 19 E. (Authority, Layne-Western Co., drillers.) | Thickness (feet) |
Depth (feet) |
|
|---|---|---|---|
| Alluvium | |||
| Soil | 3 | 3 | |
| Clay, sandy | 8 | 11 | |
| Sand, fine (Water level, 14.5 feet below land surface) |
4 | 15 | |
| Sand, medium to coarse | 5 | 20 | |
| Sand, fine | 3 | 23 | |
| Sand, medium to coarse | 7 | 30 | |
| Clay | 1 | 31 | |
| Gravel and sand | 14 | 45 | |
| Gravel and sand, few boulders | 7 | 52 | |
| Lawrence shale | |||
| Log of well of the Kansas Electric Power Co. in sec. 14, T. 12 S., R. 19 E. (Authority, Layne-Western Co., drillers.) | Thickness (feet) |
Depth (feet) |
|
|---|---|---|---|
| Alluvium | |||
| Soil | 3 | 3 | |
| Clay | 11 | 14 | |
| Sand, fine (Water level, 14 feet below land surface) |
4 | 18 | |
| Sand, coarse, some gravel | 12 | 30 | |
| Clay | 5 | 35 | |
| Sand, coarse, some gravel | 10 | 45 | |
| Gravel and sand | 8 | 53 | |
| Lawrence shale | |||
Kansas Geological Survey
Placed on web March 3, 2015; originally published June 23, 1941.
Comments to webadmin@kgs.ku.edu
The URL for this page is http://www.kgs.ku.edu/Publications/Bulletins/38_2/index.html