
|
Original published in D.F. Merriam, ed., 1964, Symposium on cyclic sedimentation: Kansas Geological Survey, Bulletin 169, pp. 1-20 | |
University of New Mexico, Albuquerque, New Mexico
Second-order stratification finds its best expression in areas adjacent to, or influenced by, storm disturbances and is recorded in the Florissant lake beds (Oligocene) of Colorado. Third-order bedding occurs in quiet basins in the realm of continuous deposition and apparently is the result of somewhat regular climatic trends of near 100-300 years duration. This type of bedding has been found in the Beaverhill Lake Formation (Devonian) of Canada, Monterey Formation (Miocene) of California, and the Blancan lake beds near Channing, Texas. Fourth-order bedding and fifth-order bedding are more commonly associated with scour in areas of discontinuous deposition, but a few varved examples are known such as the Monterey Formation and Green River Formation (Eocene) of Colorado.
Both bedding and varving are complex, and at the outset one is restricted to a consideration of certain types of annual laminations in association with certain types of bedding. (Note: The overlapping scale of different kinds of hedding has caused a nomenclatural problem. Usually, layers thicker than about 1 cm are described as beds, and smaller features are considered laminations (Kelley, 1956). The terms bed, lamina, and layer are used here in the general sense, and no fixed scale is defined. The term varve implies an annual layer and is not synonymous with bed, layer, or lamina, and a bed is not a varve unless specified.) In fact, the association of the two features at all is somewhat of a geologic rarity. Several good examples have been found, however, and provide the basis for a few generalizations about the interpretation of bedding.
The simplest type of varve consists of one dominant and one minor constituent such as the Todilto Limestone (Jurassic) of New Mexico (Anderson and Kirkland, 1960). In this case seasonal temperature or other changes are manifested as changes in the amount of precipitated calcium carbonate, and varve thickness measurements can be used directly in determining the longer trends in carbonate precipitation (or climate). No stratification is obvious as only one constituent is dominant.
The next step in complexity is illustrated by the Beaverhill Lake Formation (Devonian) in which two components predominate: relatively pure calcium carbonate and organic-rich calcium carbonate. In this example one mode of deposition gives way to the other, and laminae thickness is a function of the purity of carbonate precipitation. The result is dark-gray and light-gray banding or bedding.
An even more complex example is found in the Blancan lake beds near Channing, Texas. Here clay, calcium carbonate, and organic matter are all present in quantities sufficient to influence the appearance of the deposit, and dark and light color layering (bedding) is an obvious feature. Varve thickness in this example shows little relation to variations in individual components as their effects are complementary.
Other compositional variations at the varve level are also capable of producing features commonly considered bedding. Some varve series, such as the Panther Seep Formation (Pennsylvanian) of New Mexico, have developed in unusually sensitive environmental situations, and gross changes in lithology such as gypsum and limestone beds (laminated) alternate every few decimeters. Others, such as the Castile Anhydrite (Permian), may show only minor changes in the proportions of carbonate to sulfate in 100,000 years. At least one sequence is known where varved and unvarved sediments alternate every few centimeters (Monterey Formation, Miocene, California). In still other examples, scour features or the insertion of extraneous beds are associated with varves as in the Beaverhill Lake and Florissant (Oligocene) sequences.
These textural and compositional changes within varve series are of considerable interest because the varves calibrate the rate of change and provide information about the time relations and climatic significance of the bedding features. This information could conceivably by extended to nonvarved bedding with appropriate controls.
So far, the term varve has been used without qualification. Actual proof of varving has now been demonstrated in a number of cases, and the evidence for seasonal deposition, the criteria for varve recognition, and the few details of a demonstrable effect of climate on modern varves have been discussed previously (Anderson, 1961; Anderson and Koopmans, 1963). The principal means of recognizing nonglacial varves is the organic-layer criterion developed by Bradley (1937). With very few exceptions all nonglacial varves, including evaporite varves, exhibit an organic layer that represents seasonal plankton growth and mortality or organic precipitation. Some difficulty arises over the fact that plankton blooming may not always be a strictly seasonal process. Occasionally, a year may be skipped or several blooms may occur in one year. This alters the usefulness of varves slightly but does not invalidate the concepts concerning stratification derived from varve study. Examples used in the present discussion all conform to the organic-layer generalization.
Acknowledgments--I wish to thank Douglas W. Kirkland for his help in gathering some of the data used in this report and for our frequent discussions on the subject. Carol Ann McLeroy provided much of the information concerning the petrography of the Florissant lake beds and the excellent photograph of the Monterey Formation. The Beaverhill Lake core was generously supplied by R. G. McCrossan of Imperial Oil Company, Alberta, Canada.
This work was supported in part by Research Grants G-17144 and GP 742 from the Earth Sciences Program of the National Science Foundation.
Barrell's bedding of several thousand years would be considered fourth-order, and features that might be related to the precession cycle (20,000 to 25,000 years) would be fifth-order. Sixth-order features are generally beyond the scale of bedding and would include complex changes such as those associated with cyclothems. Figure 11 is a modification of Barrell's system which illustrates the present classification. The orders have nothing to do with the type or origin of bedding, although for certain reasons the lower orders are more frequently found in the realm of continuous deposition and the opposite is true for the higher orders.
Varves generally show little evidence of subseasonal weather changes (storms and floods) other than changes in thickness because they customarily form in quiet water in the deeper part of basins beyond the influence of a single storm. Almost all varve series, however, do show an occasional interruption of the normal varving process in the form of a thick sand or silt layer or a disruption of the lamination.
These erratic oscillations are among the strongest climatic changes in the record, exceeded only by seasonal differences and perhaps by some very long trends such as those accompanied by glaciation. They are important because the extreme variations can be associated with an event that is recorded as a sedimentary layer or bed. A good deal of study has been directed toward these fluctuations in meteorologic data (Nupen and Kageorge, 1958), tree rings (Douglass, 1936), and varves (Anderson and Koopmans, 1963). Much of the early work was motivated by a desire to find some relationship to the 11-year sunspot cycle, and some of the analyses were not too objective. Computers have made possible variance or power spectrum techniques which are capable of obtaining objective estimates of periodic tendencies in time series. Harmonic analyses of meteorologic data (Landsberg and others, 1959); tree rings (Bryson and Dutton, 1961); and varves (Bryson and Dutton, 1961; Anderson, 1961; Anderson and Koopmans, 1963) have failed to find anything like a well-defined period near 11 years. Landsberg's study did find a slight peak near 11 years in a spectrum of temperature data, and a Fourier analysis of some recent varves yielded a somewhat variable tendency near 11 years (Seibold and Wiegert, 1960). A study of stream runoff by Matalis (1963) revealed a nonrandom relationship. Some meteorologists have gone so far as to say that nothing but random "noise" is represented in the spectra. The pulsations, however, have peculiar properties not inherent in random numbers and often appear as short runs of weak, changing periodic patterns with about 5 to 15 years between maxima (Fig. 1). Also, the same patterns appear over a wide geographic area at the same time, indicating a climatic relationship. Some kind of terrestrial climatic control is responsible, but the ultimate cause must be considered a problem for meteorologists.
Figure 1--Examples of unsmoothed varve thickness changes showing erratic second-order spacing of maxima and minima.
The usual rate of deposition for the varved part of the Florissant beds, referred to as "paper shales," is about 0.3 mm per year as diatomite-sapropel couplets form every year in the usual manner. A report on the petrography of the Florissant varves is now in preparation by Carol McLeroy and the author, and only a brief summary is presented here. The organic sapropel layer shows extinction under crossed nicols which makes the seasonal sapropel cycle recognizable as the petrography becomes more complex. In most of the Florissant section, either graded vitric tuff laminae (Fig. 2) or graded to inversely graded pumice layers (Fig. 3) are added to the normal diatomite-sapropel laminations with such frequency that the original varved texture is discernable only through the recognition of the diatomite-sapropel couplets. In some instances a series of normal diatomite-sapropel varves is interrupted by a single pumice layer followed by a continuation of normal deposition (Fig. 3). In some parts of the sequence only one graded lamina will occur between each sapropel, indicating that coarse, graded deposition has become part of the yearly process. Several graded layers occur in some sequences before the next diatomite-sapropel couplet closed out the year's activity (Fig. 2). The graded layers are certainly deposited subseasonally and probably represent periods of turbidity (storms?) that flushed material from the shallow to the deeper part of the basin. In this manner the normal deposition rate was increased ten to a hundredfold.
Figure 2--Thin section of Florissant lake deposits showing graded tuff and diatomite-sapropel laminae. Diatomite-sapropel unit is missing in third graded layer from top (X 10). A larger verison of this figure is available.
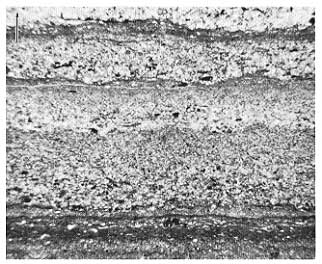
Figure 3--Thin section of Florissant lake deposits showing short series of normal diatomite-sapropel varves interrupted by pumice layers. Upper band contains 11 normal layers; middle band 12; and lower band 7 (X 8). A larger verison of this figure is available.
In a second sequence the deposition rate is about 5 times that of the first sequence and only 18 diatomite-sapropel units are involved (Fig 4B). Even this may be too long, as the diatomite-sapropel layers become more difficult to distinguish as the texture becomes coarser.
Figure 4--A, Graphic plot of distribution of graded and nongraded varves in sequence of Florissant lake beds. Note graded varving is near-seasonal process in first half and nongraded varying is rule in second half. B, As above. Deposition rate is about 8 times that indicated in normal couplets of Figure 3.
Note a progression from a condition of seasonal deposition of one texture to seasonal deposition of a coarser texture in the form of interlayering of distinctly different types of material. Also, the interlayering records fluctuations of second-order climatic change or is at least somewhat sensitive to them. The work of Kuenen and Migliorini (1950) shows that graded layers indicate turbidity, and some physical agency under the influence of seasonal and second-order climatic change caused the turbidity.
Storms occur many times each year, and it is not obvious that they are responsible for the erratically timed second-order deposition because in the Florissant example several years elapse between depositional events. This is probably the case, however, as it is the most severe storm that would move available material, and lesser storms might have little influence. The increased frequency of turbidity in some parts of the sequence is not the result of a change in the spacing of extremes in the second-order climatic pattern (Fig. 1). More likely, it is brought about by an increase in general storm intensity or availability of material that would increase the frequency of storms capable of disturbing the bottom at a given depth. Theoretically, the increased frequency of turbid-layer deposition would prevail until a new equilibrium was reached.
This does not mean that the most severe storms would automatically correspond to an unusually wet or cold year, but there would certainly be a tendency for this to happen. Hence, storms or storm-associated processes are logical agencies and second-order deposition (stratification) can be expected to be found adjacent to areas where storms exert an influence on the bottom. In the Florissant example, "overturn" should also be considered as a possible cause of turbidity. Storms and overturn are closely related, and overturn would also be sensitive to second-order climatic fluctuations.
A modern marine example, analogous to Florissant lacustrine stratification, has been described in the Santa Barbara Basin by Hiilsemann and Emery (1961). In this case, turbidite layers are scattered between diatomite varves in a similar erratic pattern. The timing of turbidity events ranges from 1 to 43 years with the most common frequency less than 5 years. Another example of a different type of second-order stratification and the probable role of storms in its formation is presented in the next section on third-order stratification.
Figure 5--Photograph of polished core of Beaverhill Lake Formation (Devonian) showing faint organic lamination, carbonate-organic color banding, and several intervals of scour (X 2.5). A larger verison of this figure is available.
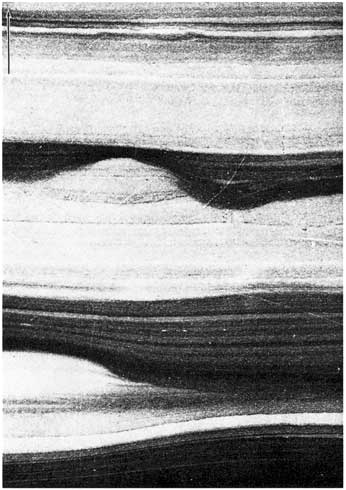
Table 1--Calcium and magnesium carbonate content of four bands.
| % CaCO3* | % MgCO3* | |
|---|---|---|
| Light band A | 88 | 7.4 |
| Light band B | 86 | 4.8 |
| Dark band A | 64 | 2.7 |
| Dark band B | 65 | 3.5 |
The light bands are clearly times of increased carbonate precipitation, consisting almost entirely of calcium and magnesium carbonate. The thickness of the two bedding types appears subequal in the core (Fig. 5), but actually the highly organic type of deposition was the norm with only about a third of the time involved in unusually high carbonate precipitation. The onset of increased precipitation was very sudden.
Many small disconformities interrupt the sequence. These generally occur at or near the contact of the light and dark bands and, less commonly, within the dark zones. The scouring can be seen to cut down into the underlying layer and, judging from the relief, a few to perhaps 10 laminae are removed in the process (Fig. 5). The breaks are of two types: scour, which seems to favor disturbance of the high-carbonate zones; and pods of other light zones, apparently ripped from an adjacent area and transported to the small area cored. A disturbance is often marked by a thicker than normal mixed organic lamina above the contact of the break. The material was apparently deposited in a lagoon at the lower limit of wave or current action and the breaks represent times of intensified current activity, probably the result of storms.
A better idea as to the details of deposition and the climatic implications can be obtained from a summary of all information in graphic form (Fig. 6). The laminations are used for calibration and the unit is assumed to be a year. Laminae thickness is smoothed over an interval of 15 years and appears as the basic curve. Light and dark bands are indicated as well as the position and relative intensity (slight vs. strong) of scour and the position of pods and abnormally thick layers.
Figure 6--Graphic plot of Beaverhill Lake Formation (Devonian) data showing changes in varve thickness, times of high and low carbonate deposition, and spacing of scour breaks. Note regularity of thickness trends in first half and change to irregularity in second half as scour becomes intensified. A larger verison of this figure is available.
In the younger half of the sequence there are twice as many major scours (15/8), the relief of scour increases, and a few pods and abnormally thick layers are present. A shortening and confusion of the 150-200 year thickness cycle (if it existed) occurs as the breaks intensify and remove a greater part of the sequence. This explanation also accounts for the greater number of light zones (14/9) in the younger half.
The total number of breaks in each half is approximately equal (14/17). The placement of the breaks seemingly is random, and there is no correlation with the third-order (150-200 year) climatic cycle in the first half. Breaks do not occur in the light zones, but this may be due to its physical properties or to the mechanics of the scour process. Scouring is definitely more frequent and erratic than the 150-200 year thickness pattern. Ripping and scouring would not affect the entire bottom at once, and one could expect scouring in one place and deposition of the ripped material in another, as shown by the pods in the younger half of the sequence. The breaks in the record have an average interval of about 40 years and probably represent only a few of the currents severe enough to disturb the bottom on the particular place that was cored. This suggests that erratic second-order change is involved, and the scour is evidence of current activity occurring over irregular intervals of several years. The intensification of scour in the younger half of the core may be evidence of a general cycle of current activity operating over a period of at least 1,000 years. Thus, there exist in one example first-, second-, third-, and possibly fourth-order stratification features. The third-order bedding (color banding), however, is the most obvious.
A sequence of chert-shale alternations located about 1 mile north of Dana Point, California, was measured by the writer to obtain more information about the timing and variation of Monterey bedding. The appearance of the bedding is very similar to the illustration of Bramlette (1946, Pl. 13B). Close inspection revealed that the chert beds contained organic laminations (Fig. 7A) and the coarser shale units were not laminated (Fig. 7B). The silicification, however, was not always confined to the laminated material, and soft laminated sediment was sometimes contiguous to the silicified laminated beds. The contact between the silty and laminated material was sometimes sharp and sometimes gradational. No evidence of scour was observed. Slightly more then 3 meters of bedding were measured. It was not possible to count the laminae in each bed without coring and sectioning the entire unit, so five representative samples were sectioned and measured in order to obtain an estimate of average rate of deposition. The average thickness of the laminae in the units sectioned was 0.44 mm. Samples collected from other nearby parts of the sequence ranged in average thickness from 0.28 mm to 0.38 mm. Bramlette gives 0.1 mm to 0.2 mm as the usual thickness of laminae at other localities. His illustration of this material (Bramlette, Pl. I5B) has an average thickness of 0.25 mm. The 0.44 mm estimate obtained from the samples taken from the measured interval might be lowered somewhat if the entire sequence were measured, and for purposes of calibration an average thickness of 0.4 mm is used.
Figure 7--A, Thin section of silicified laminated bed in Monterey Formation,. Dana Point, California, showing clay-organic laminations (X 20). B, Thin section of nonlaminated shale bed in Monterey Formation, Dana Point, California, showing silty unlaminated texture (X 20). A larger verison of this figure is available.
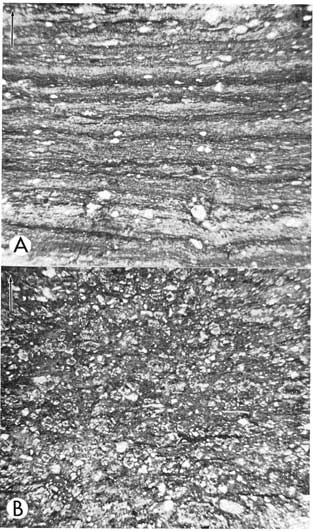
Figure 8--Graphic plot of laminated chert and nonlaminated shale alternations in Monterey Formation, Dana Point, California.
Another example of third-order stratification occurs in the varved Blancan lake beds near Channing, Texas, and they are now under study. In this case there are pulsations in carbonate precipitation, organic production, and clay influx that produce bedding changes that are more erratic than the previous examples and have an average cycle interval near 300 years (Fig. 9).
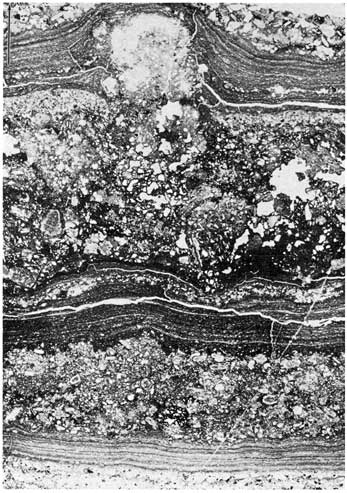
Figure 9--Outcrop of Blancan lake beds near Channing, Texas, showing bedding of third-order scale. The massive bed near the base is 1 foot thick and contains about 350 varves.
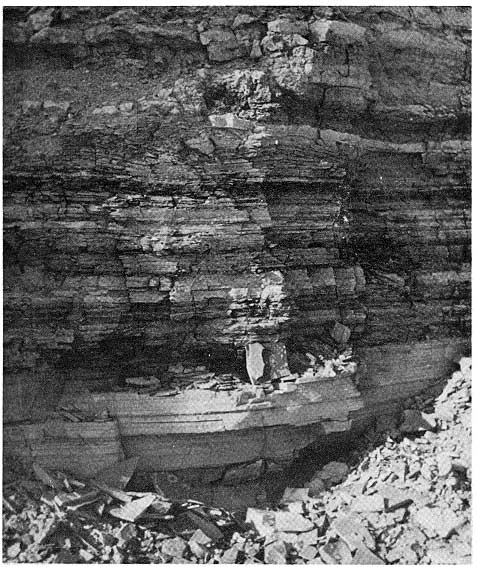
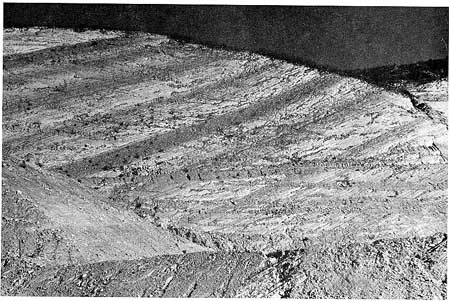
Figure 10--Excavated hillside in Los Angeles showing eight or nine fourth-order cycles in Monterey Formation. Fence post at lower left can be used for scale (photo courtesy Carol McLeroy). A larger verison of this figure is available.
The above rate (0.1 mm to 1.0 mm/yr) is such that 100-300 year (third order) climatic changes will produce bedding couplets with a thickness of 1 cm to 3 dcm. A 1 cm bedding couplet would be near the minimum possible, and the average thickness of the great majority of varves is somewhere between 0.2 mm and 0.4 mm. The varve thickness cycle most commonly observed so far is near 200 years, and one might expect 6 cm couplets to be typical of the process (Monterey example). This type of bedding would only be found in environments of low depositional energy (see Rich's, 1951, illustrations of fondo bedding).
The Florissant example suggests that the rate of deposition increases sharply near the margins of basins. In this case, the rate increased eightfold as a different process along the margins of the basin became operative; and this may well be a minimum estimate because rapid deposition and varving are usually incompatible. There are not many varved examples of deposition rates for the coarse (sand) sediments. Korn (1938) discusses a lower Carboniferous varved sandstone with a rate of 2.5 mm/yr, which is about 10 times the usual varve rate. He also reports a graywacke with a rate of 27 mm/yr. Pettijohn (1949, p. 473) reports Archean varves in siltstone and graywacke of 25 cm and 42.5 cm.
This sharp increase in deposition rate outside of the quiet bottom environment where varves are apt to form means that bedding features of the same scale as those observed associated with varves (1 cm to 3 dcm and greater) are under the influence of the next lower orders of climatic change; that is, subseasonal to 30 years with the greatest effect at the shorter end. The subtle trends of several hundred years that play a role in third-order stratification are insignificant when compared to storms, scour, and floods which are timed by the erratic second-order changes. One might expect the places between the quiet basins and active margins and shelves to record an intermediate effect, but the one-sided source of energy and sediments means that second-order influences are felt far beyond the margins and extend down the slopes into the basins (Florissant example). If this effect is not manifested in differences in lithology, it appears as varve thickness changes which find expression only in the deepest parts of the basin. Rich (1951) reasoned that each bed in the intermediate (clino) environment was the result of a great storm on the shelf (undathem). This conclusion agrees with the Florissant example. The average bed thickness in Rich's (1951) illustration of clino bedding is about 5 cm (scaled from photo) and this is about the scale for almost all "Flysch" bedding. If we assume second-order change as controlling severe storms and an average interval between layers of 5 years (using Florissant, Santa Barbara Basin, and Beaverhill Lake analogy), then the rate of deposition is on the order of 1 cm/yr, which seems consistent with the place and mode of deposition.
As one moves out of the realm of continuous deposition, the time gaps caused by scour enormously complicate the interpretation of bedding, and Barrell's (1917) explanation takes over at this point. Reineck (1960) has provided some valuable information about the time relations of deposition and scour under shallow marine conditions. The greatest discrepancy between observed rates of deposition and the measured rates of long-term accumulation is in the tidal flat where the actual rate of deposition is 4 to 5 powers greater than the eventual rate of accumulation; that is, only 1/10,000 to 1/100,000 of elapsed time is documented by sediments. Material is probably being supplied to the tidal flat in pulses responsive to first- and second-order climatic changes (storms) and seasonal tides, but because of the vast amount of reworking, the chances of these climatic events being preserved are nil. The flaser bedding illustrated by Reineck (1960, Fig. 3) indicates that a flaser couplet (23 couplets/5 cm) escaped to the permanent record at an average frequency of 0.7 couplets per year.
If one compares Reineck's flaser scour to the scour in the Beaverhill Lake, there is some similarity in the appearance of the bedding. The two examples represent extremes of the shallow-water scour process. The rate of preserved scour and escape ranges from slightly less than 1 year in the tidal flat where there are very active currents to less than 40 years (5 to 10 years is a fair estimate) in the lagoon at the limit of wave or current action. It is interesting that there is not much difference in the recorded effect of scour in spite of an enormous difference in scour frequency. Radiometric age determinations can provide some information about the average escape time of bedding in the shallow sea environment, and a preliminary attempt was made to determine the approximate time involved in the formation of calcarenite bedding in the Madera Limestone (Pennsylvanian) of New Mexico. The individual beds in the Desmoinesian Series were measured and counted using fusulinid genera to mark the top and bottom of the series. Scour is difficult to detect in the welded limestone beds, and each change in texture that suggested a break in deposition was considered. At the particular place of study near Tijeras, New Mexico, only two-thirds of the Desmoinesian section was usable. The average bed thickness is 43 cm, and the range is from a few centimeters to a few meters with a fairly high variance. If we assume that the Desmoinesian represents one-fifth of the Pennsylvanian and the two-thirds of the section used is representative, the average time interval for an individual bed is 21,500 years (number of beds, 186; duration of Desmoinesian, 6 million years). With so many assumptions the accuracy of the estimate is no better than somewhere between 10,000 and 30,000 years per bed. However, this means that there are about three orders of magnitude difference between the probable incidence of scour (second order) and the average escape frequency of the bedding (fifth order). Barrell (1917) suspected that climatic changes of the fourth order (several thousand years) were responsible for the escape of scour beds in the shallow sea, and a few simple calculations suggest that both fourth- and fifth-order escape frequencies are indicated for the great bulk of shelf and shallow geosynclinal limestone bedding.
Figure 11--Orders of stratification. Last three orders (5th, 6th, 7th) correspond approximately to cycles used by Barrell (1917, Fig. 5) to explain marine scour bedding and may be climatic, eustatic, or tectonic. Time limits beyond third order are for illustration only and happen to correspond to few examples available. All cycles are diagrammatic and degree of regularity or intensity is not implied.
Anderson, R. Y., and Kirkland, D. W., 1960, Origin, varves, and cycles of Jurassic Todilto Formation, New Mexico: Am. Assoc. Petroleum Geologists Bull., v. 44, p. 37-52.
Anderson, R. Y., and Koopmans, L. H., 1963, Harmonic analyses of varve time series: Jour. Geophys. Research, v. 68. p. 877-893.
Barrell, J., 1917, Rhythms and the measurement of geologic time: Geol. Soc. America Bull., v. 28, p. 745-904.
Bisque, R. E., 1961, Analysis of carbonate rocks for calcium, magnesium, iron, and aluminum with EDTA: Jour. Sed. Pet., v. 31, p. 113-122.
Bradley, W. H., 1929, The varves and climate of the Green River epoch: U. S. Geol. Survey Prof. Paper 158. p. 87-110.
Bradley, W. H., 1937, Non-glacial varves with selected bibliography: Nat. Research Council Ann. Report, App. A. Rept. of Committee on Geologic Time, p. 32-42.
Bramlette, M. N., 1946, The Monterey Formation of California and the origin of its siliceous rocks: U. S. Geol. Survey Prof. Paper 212, p. 1-57.
Bryson, R. A., and Dutton, J. A., 1961, Some aspects of the variance spectra of tree rings and varves: New York Acad. Sci. Annals, v. 95, p. 580-604.
Douglass, A. E., 1936, Climatic cycles and tree growth, a study of cycles: Carnegie Inst. Wash. Publ. 3, p. 1-171.
Gilbert, G. K., 1895, Sedimentary measurement of Cretaceous time: Jour. Geology, v. 3, p. 121-127.
Gillette, H. P., 1939, Climatic cycle of 25,500 years: Pan-American Geologist, v. 71. p. 107-115.
Hülsemann, J., and Emery, K. O., 1961, Stratification in Recent sediments of Santa Barbara Basin as controlled by organisms and water character: Jour. Geology, v. 69, p. 279-290.
Kelley, V. C., 1956, Thickness of strata: Jour. Sed. Pet., v. 26, p. 289-300.
Korn, H., 1938, Schichtung und absolute Zeit: Neues Jahrb. Mineral., Geol. Paläont., Stuttgart, v. 74A, p. 50-188.
Kuenen, P. H., and Migliorini, C. I., 1950, Turbidity currents as a cause of graded bedding: Jour. Geology. v. 58, p. 91-127.
Landsberg, H. E., Mitchell, J. M., Jr., and Crutcher, H. I., 1959, Power spectrum analysis of climatological data for Woodstock College, Maryland: Monthly Weather Rev., v. 87, p. 283-298.
Matalas, N. C., 1963, Autocorrelation of rainfall and streamflow minimums: U. S. Geol. Survey Prof. Paper 434-B, p. 1-10.
Nupen, W., and Kageorge, M., 1958, Bibliography on solar-weather relationships: Amer. Met. Soc. Meteorological Abstracts and Bibliography, Washington, D. C., 248 p.
Pettijohn, F. J., 1949, Sedimentary rocks: Harper & Bros., New York, p. 1.526.
Reineck, H. E., 1960, Über zeitlücken in rezent flach-see-sedimenten: Geologische Rundschau, v. 49, p. 149-160.
Rich, J. L., 1951. Three critical environments of deposition and criteria for recognition of rocks deposited in each of them: Geol. Soc. America Bull., v. 62, p. 1-19.
Rubey, W. W., 1930, Lithologic studies of fine-grained Upper Cretaceous sedimentary rocks of the Black Hills region: U. S. Geol. Survey Prof. Paper 165-A, p. 1-54.
Seibold, E., and Wiegert, R., 1960, Untersuchungen des zeitlichen Ablaufs der sedimentation im Malo Jezero (Mljet. Adria) auf periodizitäten: Z. Geophys., v. 26, p. 87-103.
Van Houten, F. B., 1963, Cyclic lacustrine sediments in (Upper Triassic) Lockatong Formation, central New Jersey and adjacent Pennsylvania (abs.): Am. Assoc. Petroleum Geologists Bull., v. 47, p. 373.