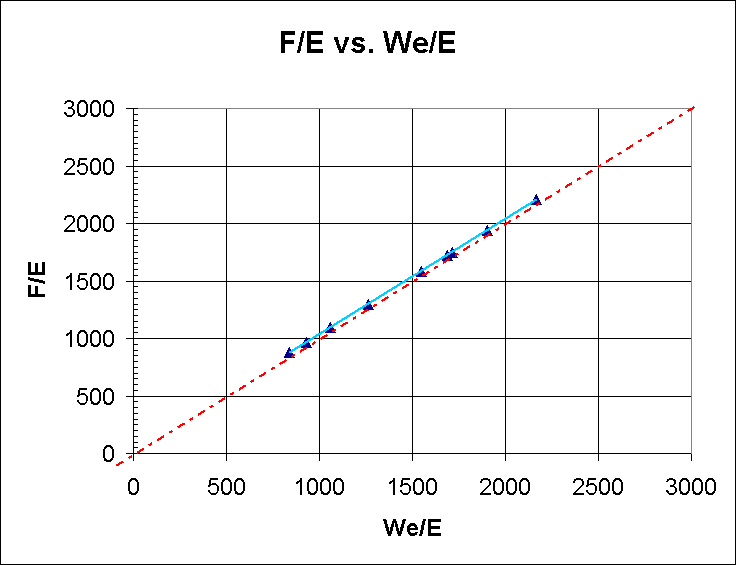
FIGURE 2.18. Plot of F/E versus We/E showing a straight line with unit slope and an intercept showing an OOIP value that is lower but within 10% of OOIP determined from volumetric calculations (37.8 MMSTB).