 |
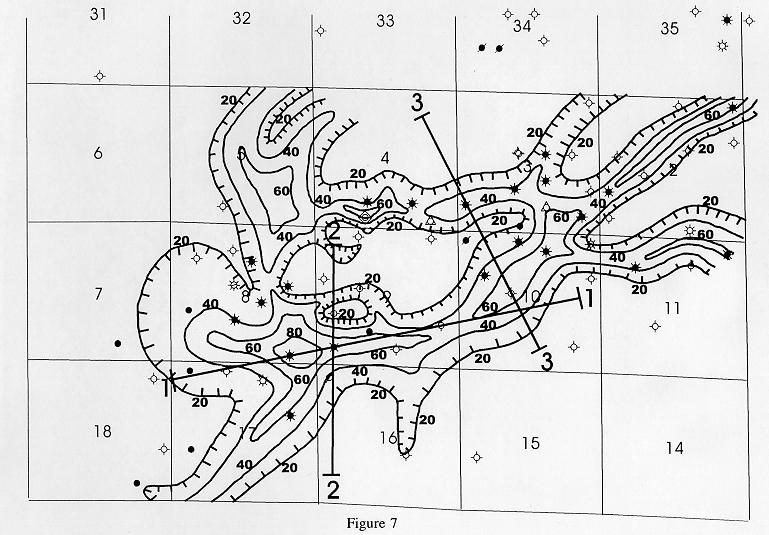
| Figure 7. Isopach map of top of Morrow to top of Mississippian indicating thicks associated with interpreted channels. Contour interval is 20 ft. with hatchers on 20 ft. contour pointing towards thicks. Also indicated are seismic lines from present study. Note that line I runs along the axis of one of these thicks while lines 2 and 3 cross one or more thicks. |