|
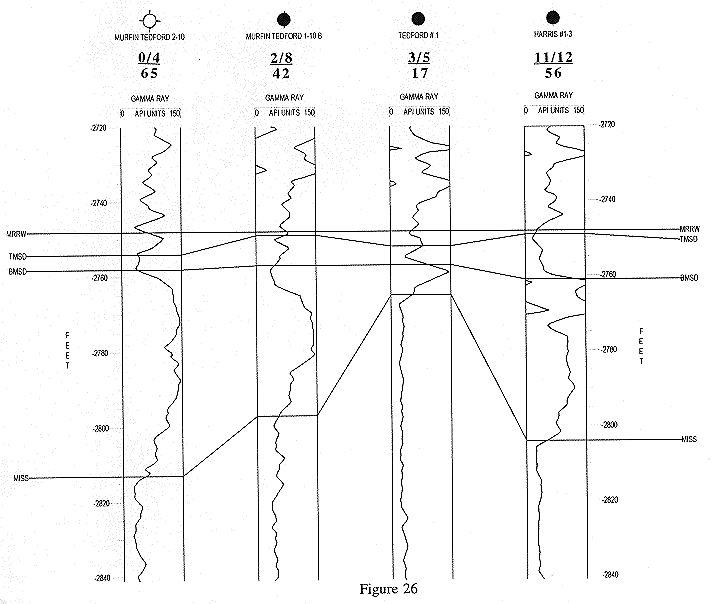
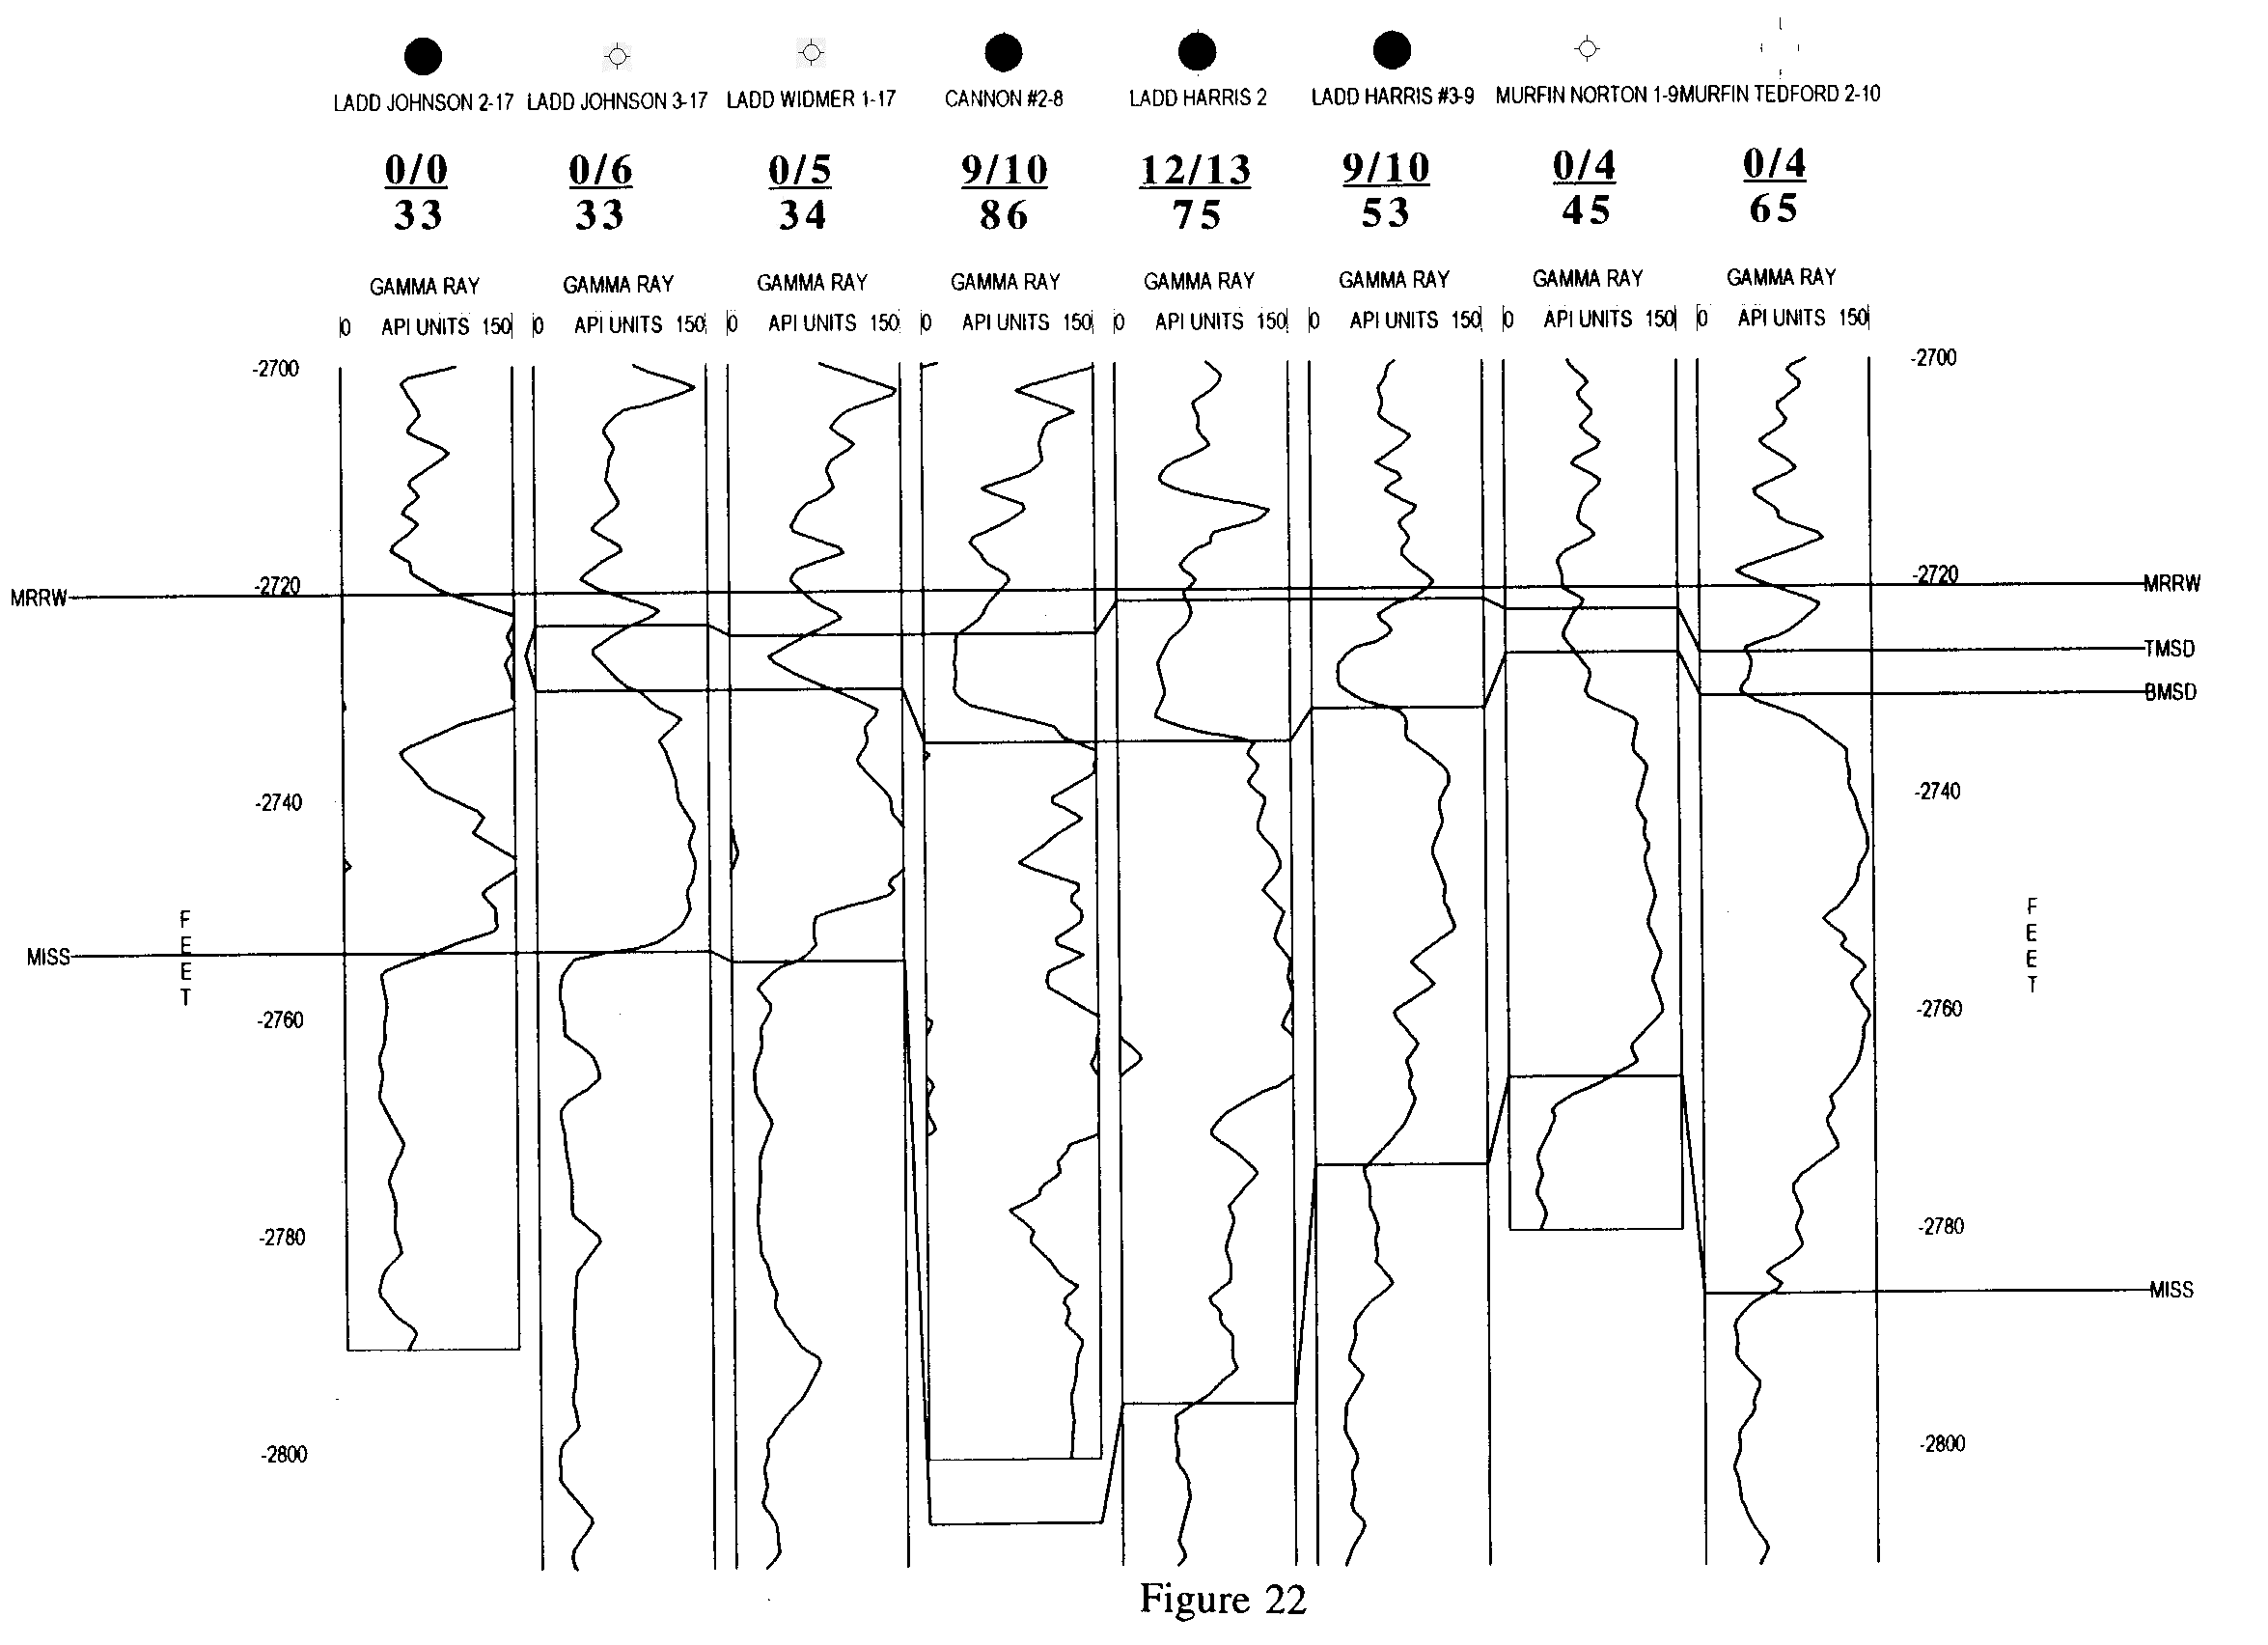
| Figure 26. Correlation of gamma ray logs along Line 3 to show varying total Morrow clastic interval thickness and the gross sandstone thickness near the top of the Morrow clastic section. See Figure 4 caption for legend of numbers between the well logs and well names and Figure 22 for correlation abbreviations. |