|
|
|
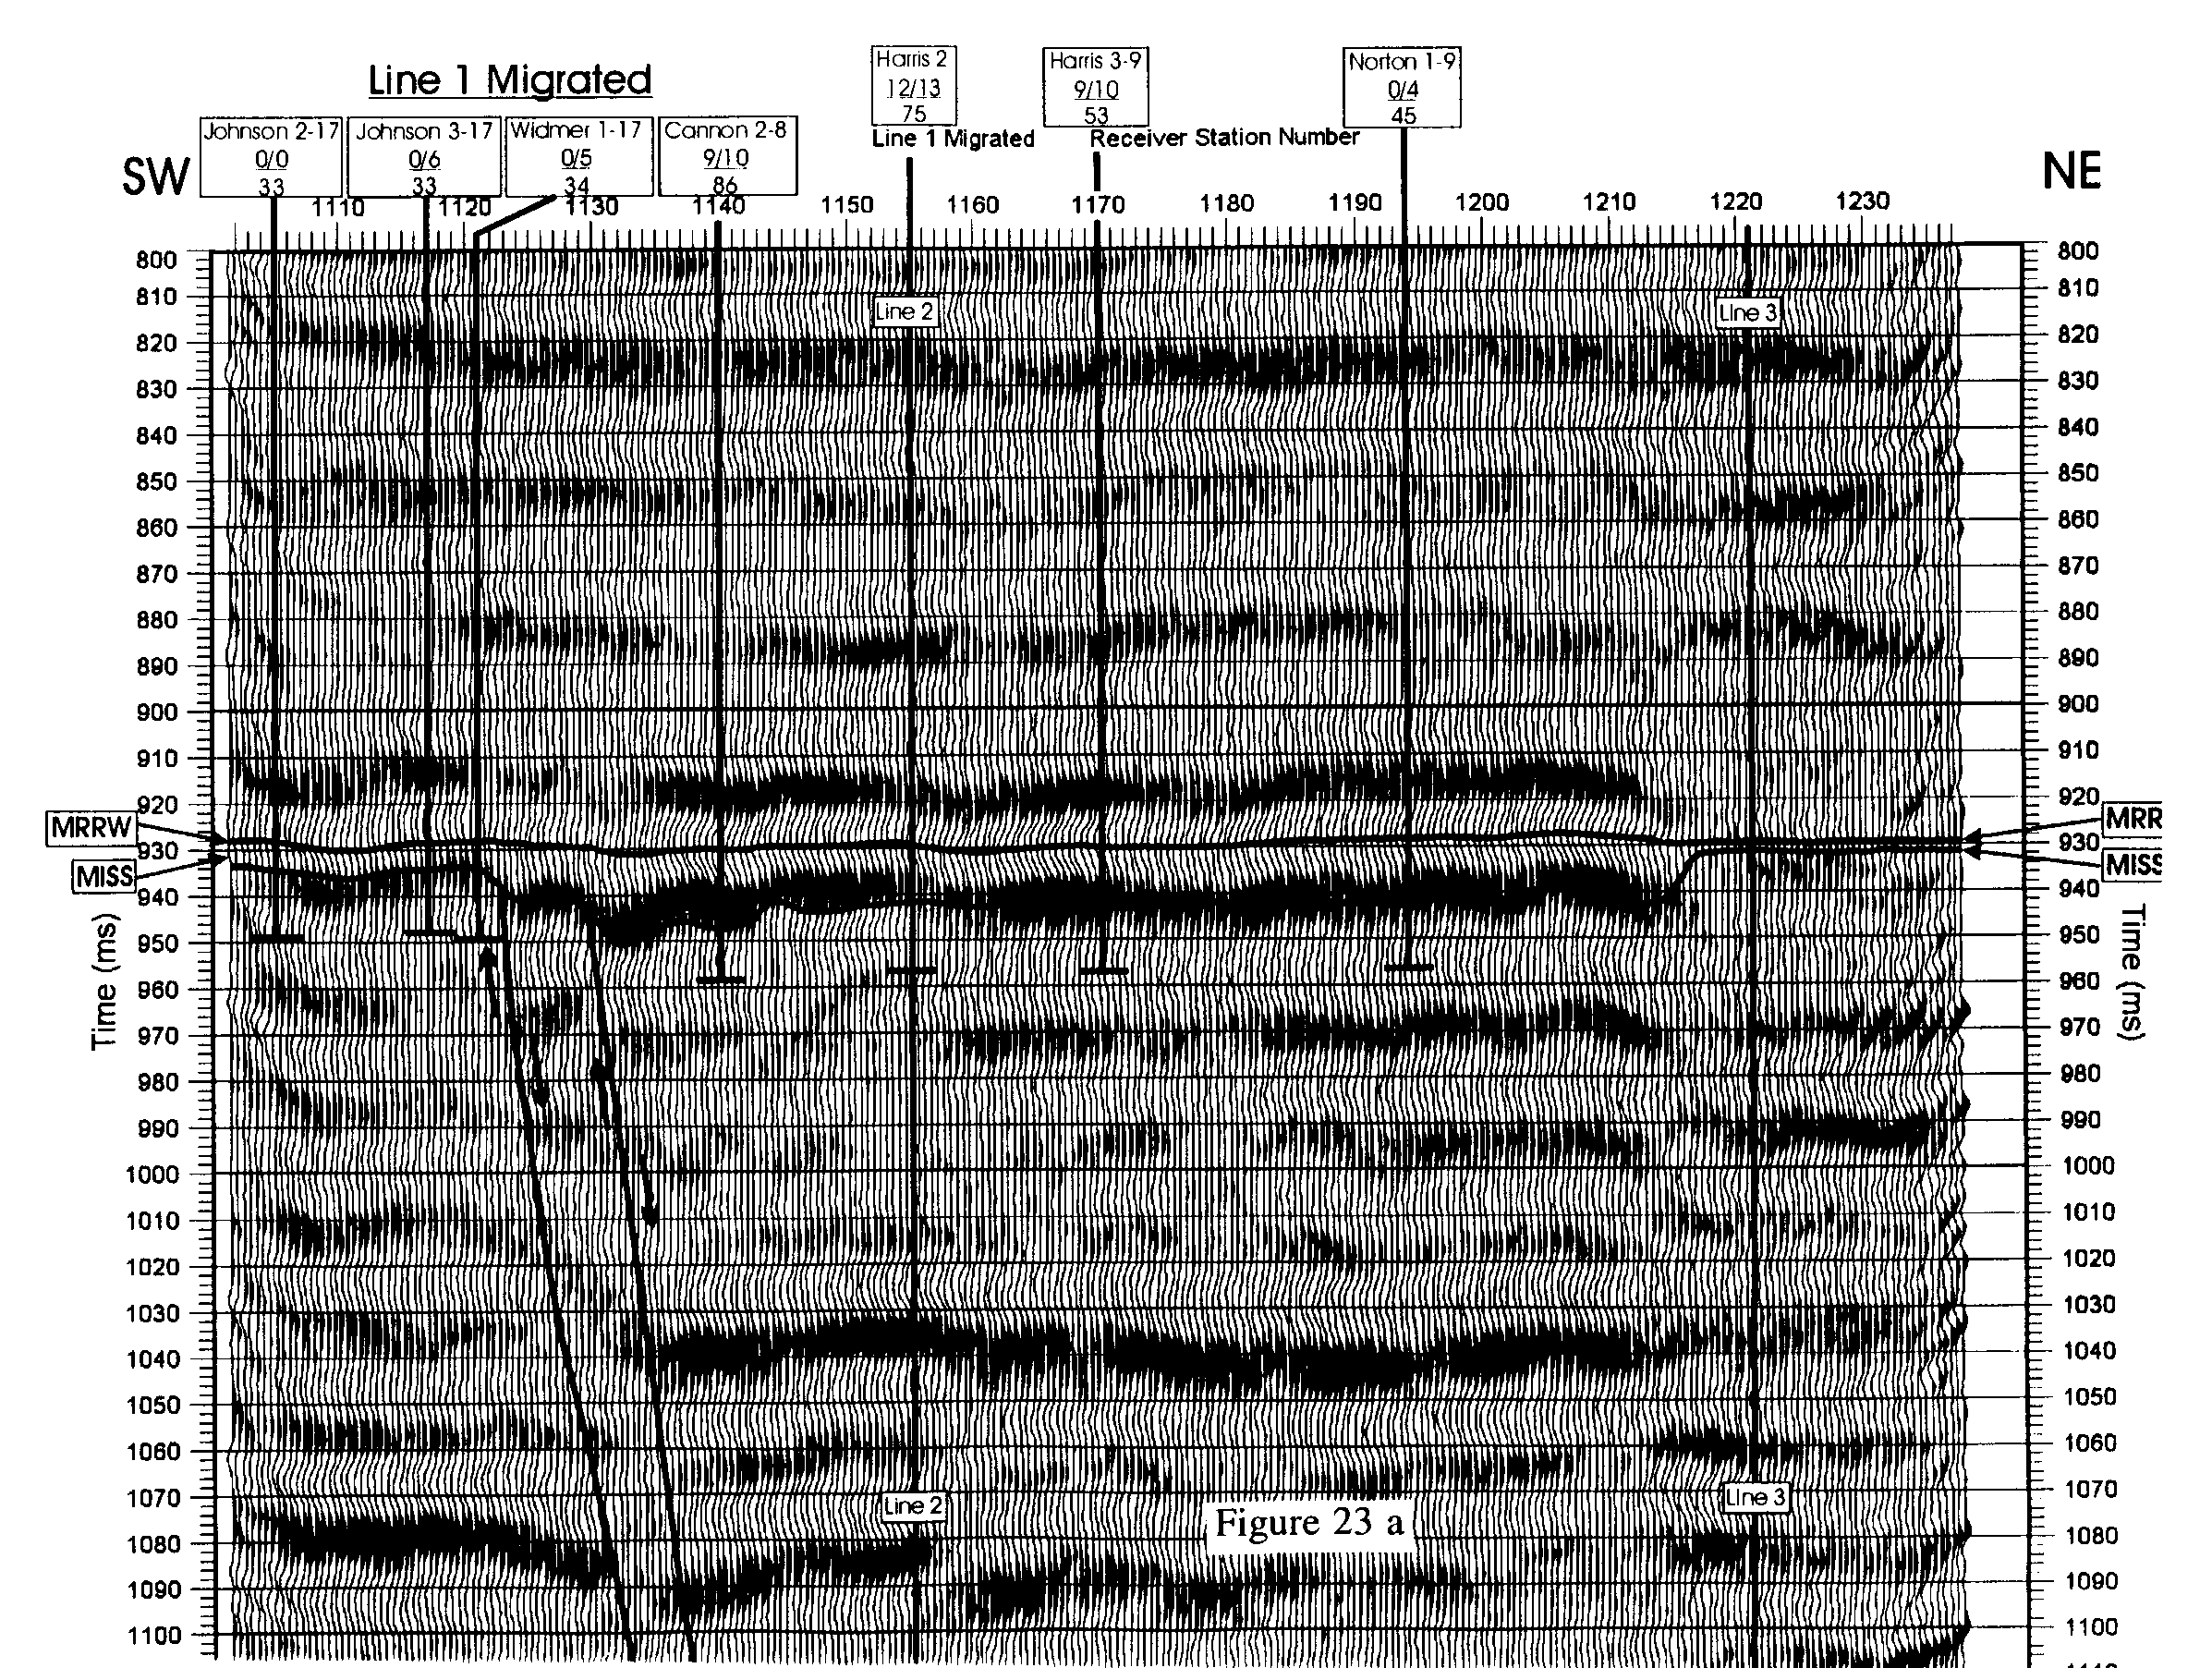
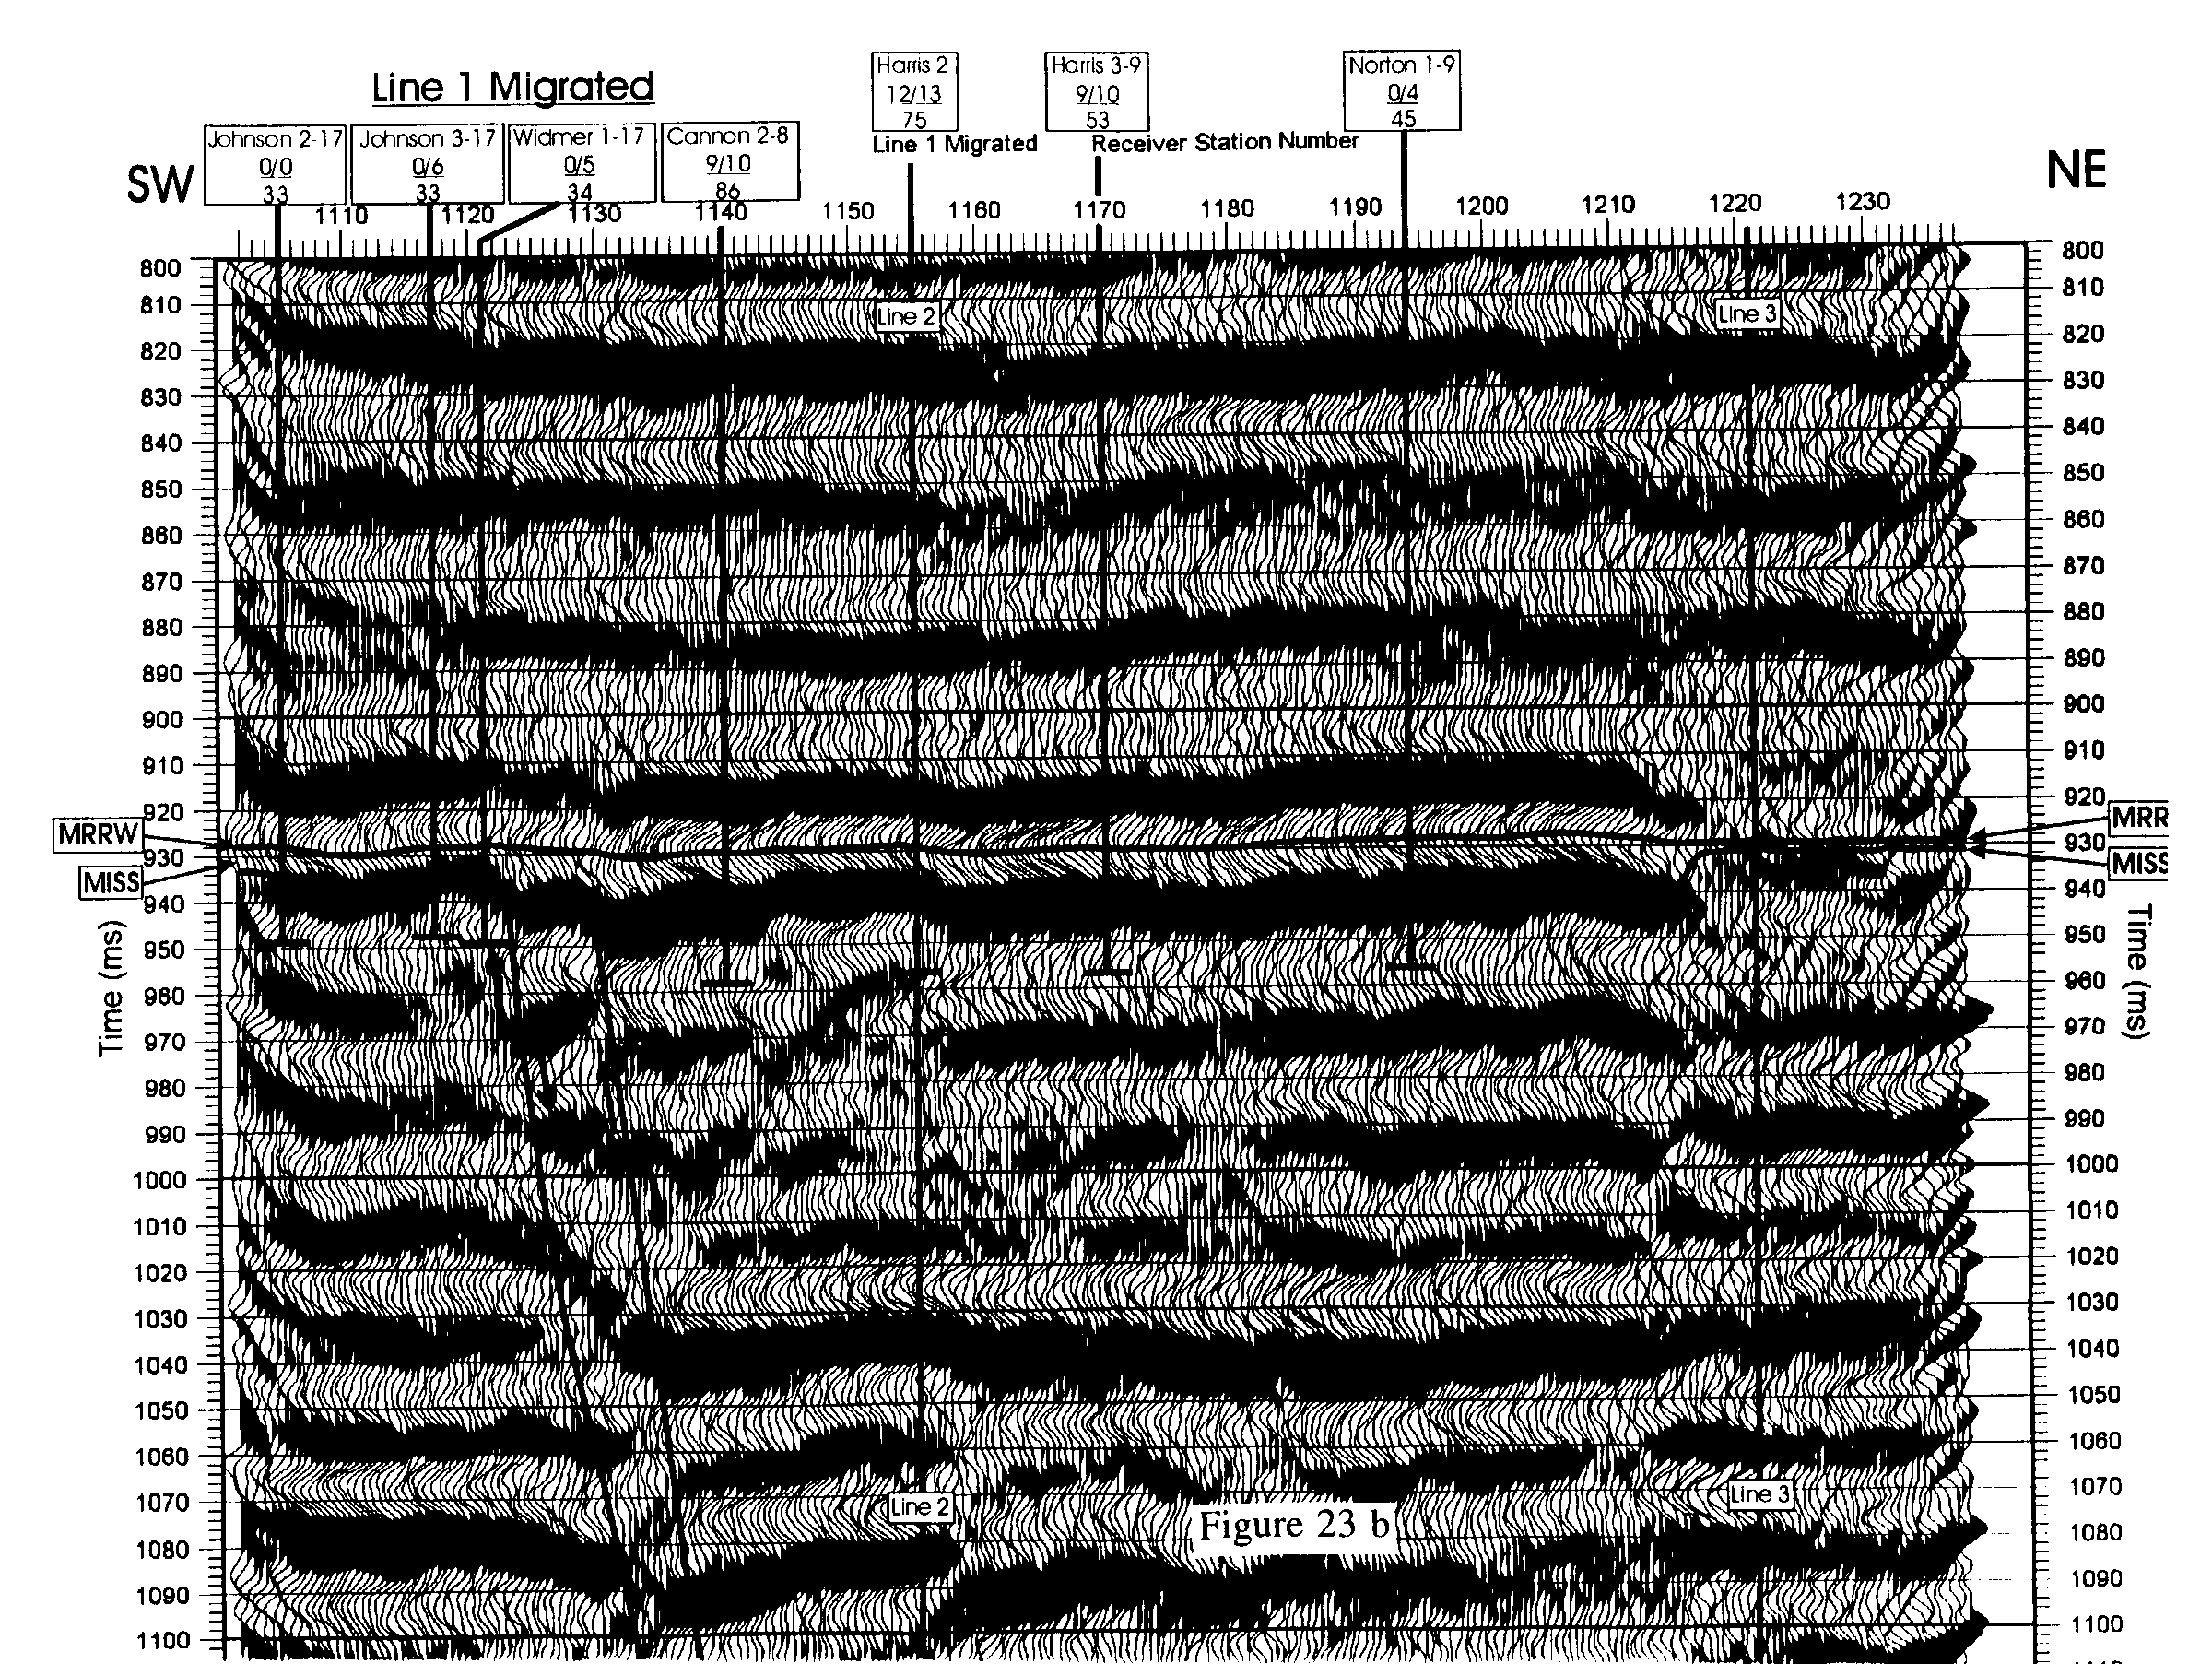
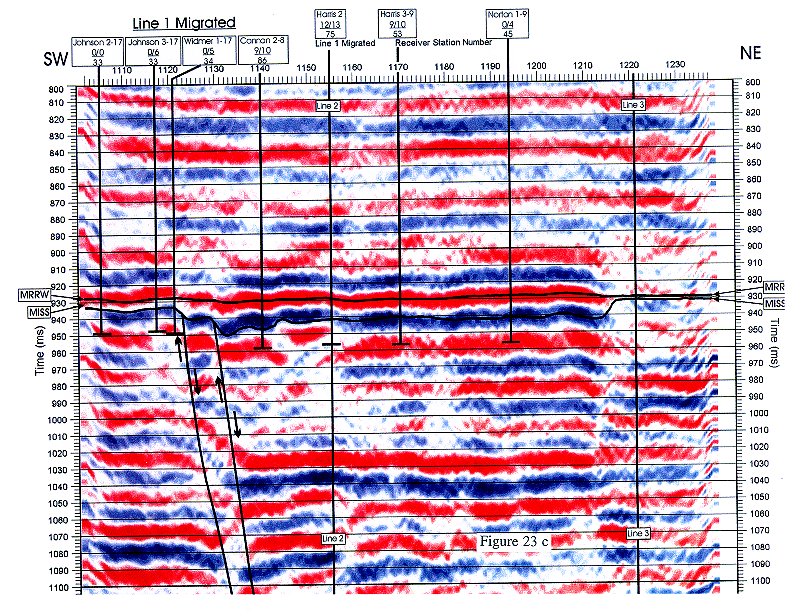
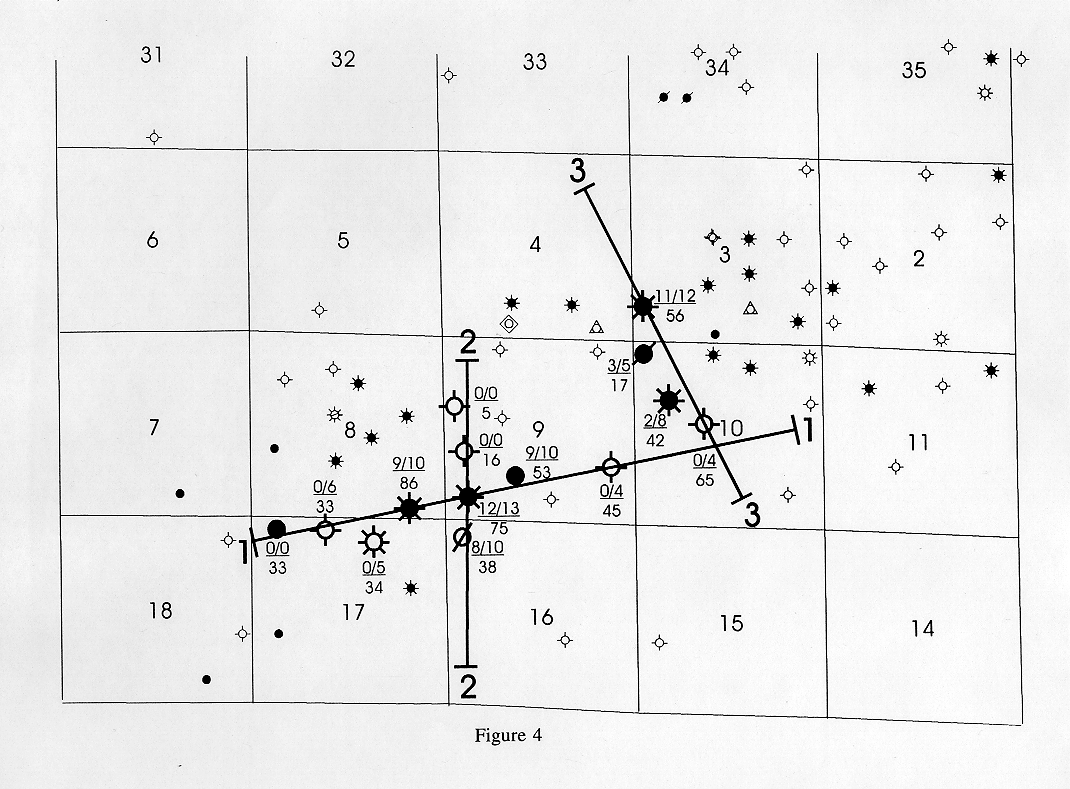
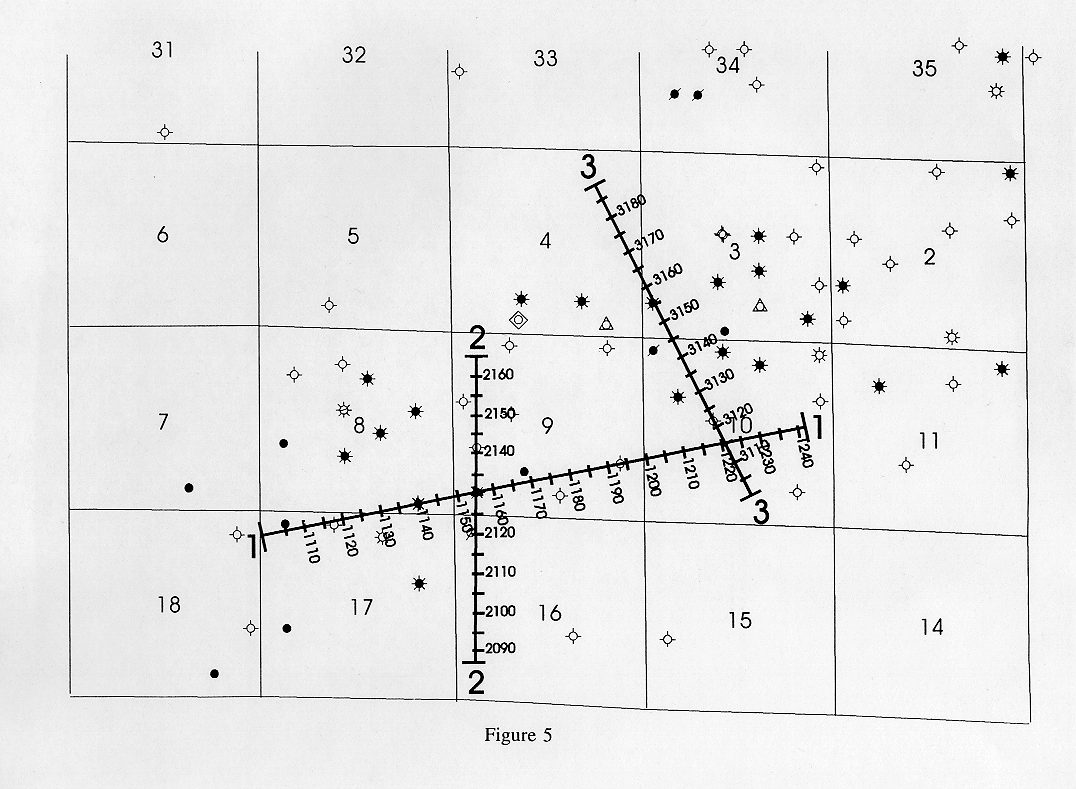
| Figure 23. Interpretation of the migrated version of Line 1 centered on the Morrow clastic interval. Shown are the top of the Morrow clastic interval (MRRW) and top of Mississippian limestone (MISS), well ties (thick black vertical lines indicate location and probable total depth of wells), net sand thickness, gross sand thickness, and thickness of the total Morrow clastic section in the wells (see Figure 4 for explanation of number code), ties with Lines 2 and 3 (vertical black lines through entire section), and faults (thick black lines with arrows showing relative movement across fault. Receiver station numbers along top of section correspond to those in Figure 5. a) Section with a -10 dB/octave gain applied before display to help amplitude of peaks stand out. b) Section with no gain to allow amplitude of troughs to stand out. c) Red (troughs) - blue (peaks) section to aid in amplitude interpretation. Higher intensity saturation of reds and blues indicate higher amplitudes. |