

 |
 |
 |
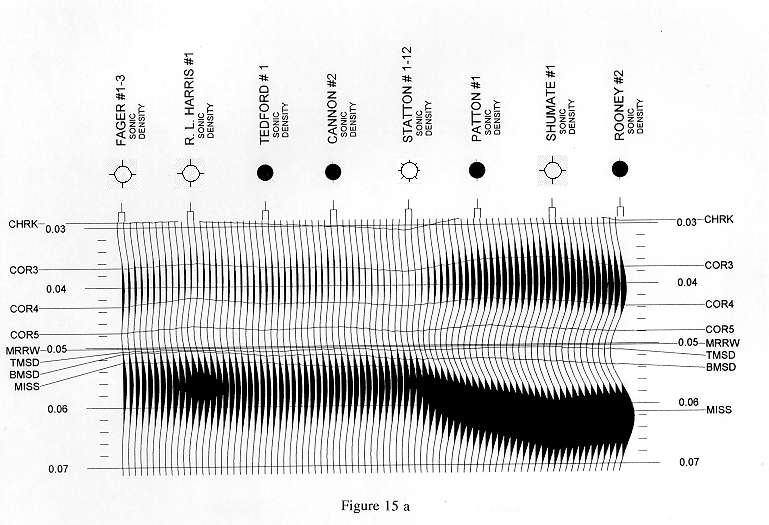
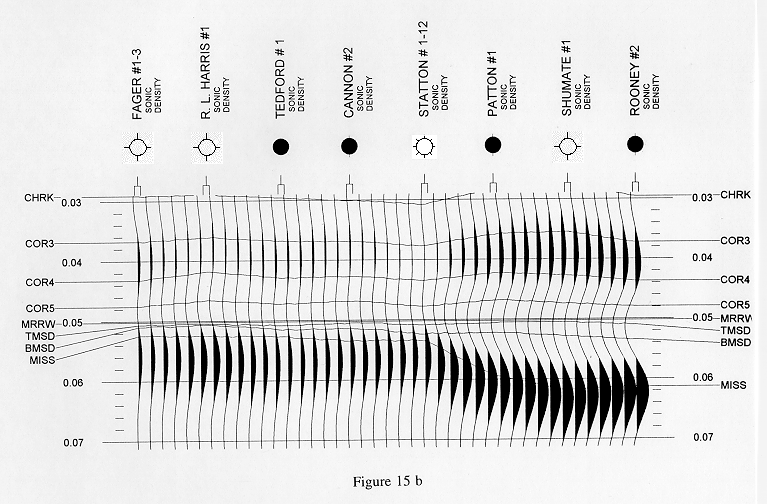
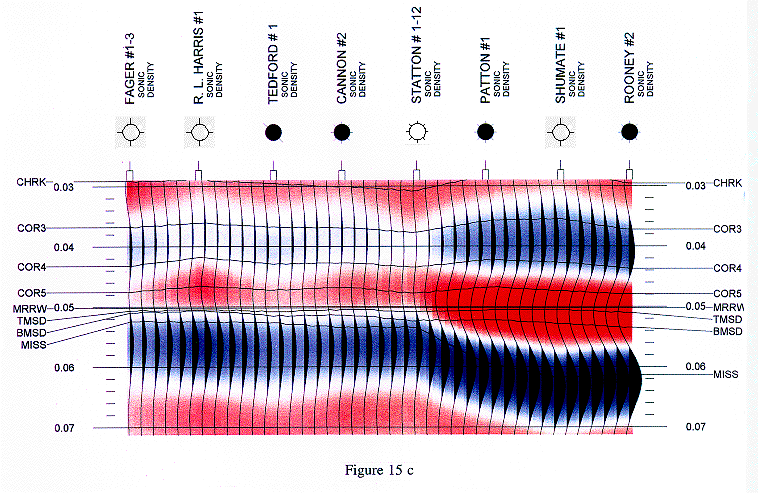
| Figure 15. Low-resolution seismic model of varying Morrow-Mississippian thickness and Morrow sandstone thickness. This model was generated by convolving zero phase Ormsby bandpass wavelet (20-30 Hz slope on the low end and 60-90 Hz slope on the high end) with the interpolated acoustic impedance model in Figure 13. a) Every interpolated trace is shown so gradual changes are seen more easily. b) Every other trace is shown so amplitude variations are more visible. c) Red-Blue colors indicate subtle amplitude changes. More intense saturation of red indicates higher amplitude troughs, whereas more intense saturation of blue indicates higher amplitude peaks. |