Kansas Geological Survey, Open File Report 96-50
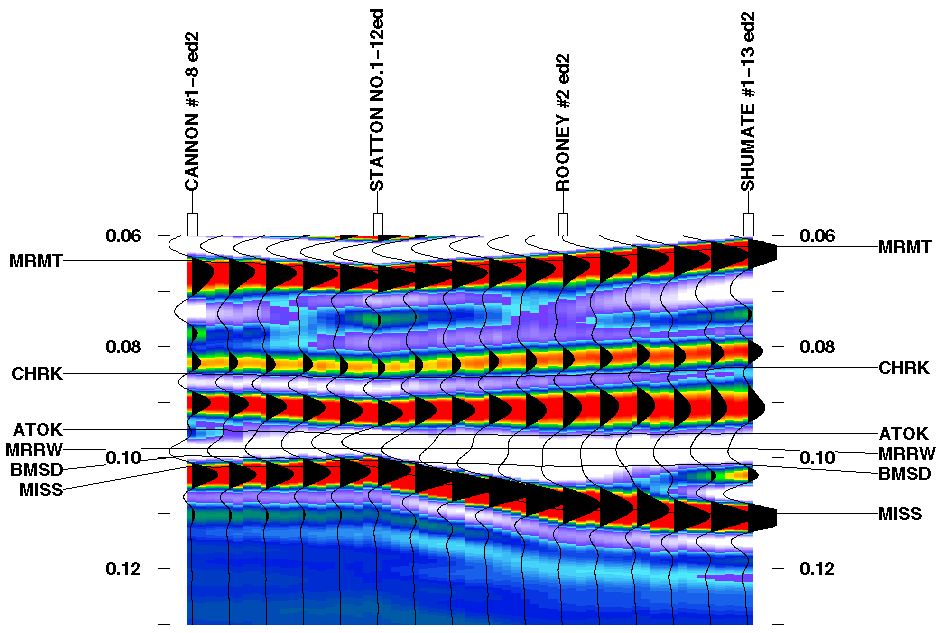
Figure 9a--Multi-well, higher resolution seismic model. Colors represent seismic amplitude. Vertical scale in seconds of two-way travel time from the top of the model. Abbreviations same as Figure 7a. A black and white verion of this plot is available.

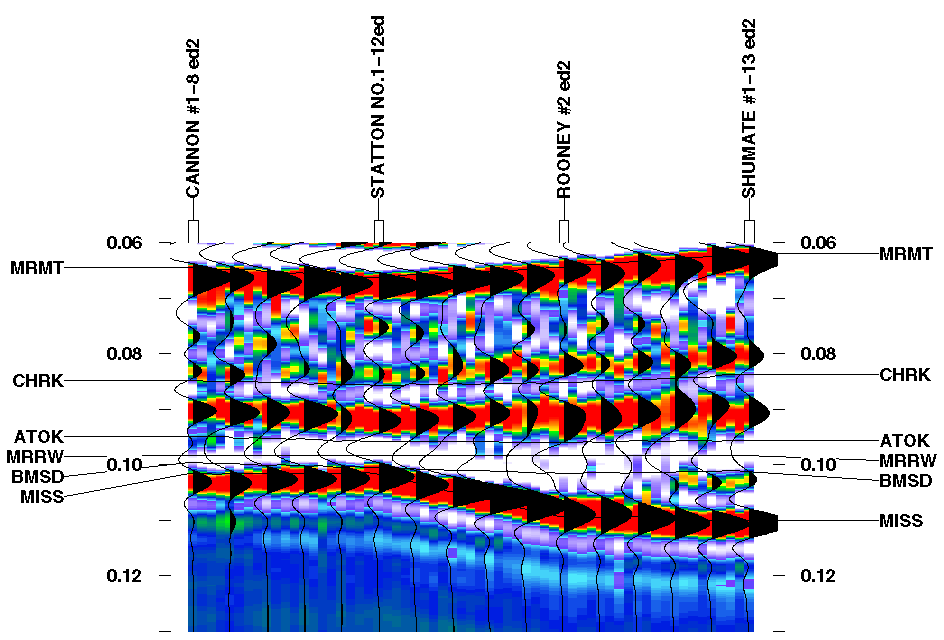
Figure 9b--Same as Figure 9a with random noise added. A black and white verion of this plot is available.

Unlike the lower resolution model, the higher resolution model (Fig. 9a) exhibits a noticeable change in reflection character between the Statton and Cannon wells characterized by the development of an extra peak below the middle Cherokee peak in the Cannon well, and an isochron thickening between the middle Cherokee and Mississippian peaks going from the Statton to the Cannon well. Although it is tempting to relate this change in seismic character and isochron thickening to the 5 ft. (1.5 m.) decrease in sandstone thickness between the Statton and Cannon wells, they are probably both related to the thickened Atoka section in the Cannon well relative to the Statton well.
A change in the seismic signature also occurs between the Rooney well which contains an 8 ft. (2.4 m.) upper Morrow sandstone and the Shumate well which contains no upper Morrow sandstone. The isochron interval between the middle Cherokee peak and the Mississippian peak increases slightly from the Rooney to the Shumate well. Some of this isochron thickening is related to a thicker Cherokee section in the Shumate well but not all of it. Some of it appears to be related to a slightly lower average velocity between the Morrow and Mississippian horizons in the Shumate well compared to the Rooney well, probably due to more shale in the Shumate well. The lack of a greater isochron change between the Rooney and Shumate wells may be due to the occurrence of a relatively low velocity shale beneath the upper Morrow sandstone in the Rooney well (Fig. 7a). This low velocity shale would tend to balance out with much of the isochron increase in the Shumate well caused by the disappearance of the upper Morrow sandstone.
Another change that occurs between the Rooney and Shumate wells is the development of an extra peak just below the base of the Morrow sandstone correlative horizon (Fig. 9a) (there is no upper Morrow sand in the Shumate well so the correlation is just a marker horizon). At first glance it appears that the development of this extra peak may be related to the presence of what appears to be a tight sandstone midway between the base of Morrow sandstone horizon and the top of Mississippian horizon (Figs. 7a, b, and c). However, this sandstone occurs below the extra peak (Fig. 9a) and so probably does not directly cause it. Also, removal of the tight sandstone in an edited version of the Shumate well reduces the amplitude of the extra peak but does not eliminate it. One reason the extra peak does not show up in the Rooney well may be due to the negative impedance contrast that occurs at the base of the upper Morrow sandstone in that well (Figs. 7b and c). This negative acoustic impedance contrast will generate a small trough that may cancel out the extra peak which may have formed for some other reason. Another possibility for the generation of the extra peak may be constructive interference between sidelobes of the middle Cherokee and Mississippian reflections. The constructive interference may occur in the Shumate well because the average velocity is low enough between these horizons and the isochron interval large enough to cause it. The isochron interval between the middle Cherokee and Mississippian peaks may not be large enough in the Rooney well to cause the peak. This observation suggests that development of an extra peak on higher-resolution seismic data within the Morrow interval of a moderately thick channel may indicate that the presence of a potentially productive upper Morrow sandstone is unlikely.
Thickening of the Morrow to Mississippian interval from 21 ft. (6.4 m.) in the Statton well to 66 ft. (20 m.) in the Rooney well results in both amplitude changes and an isochron increase, even though both wells have approximately the same thickness of net sandstone (8-9 ft.; 2.4-2.7 m.) (Fig. 9a). The isochron thickening occurs between both the middle Cherokee to Mississippian peaks, and the interval between a trough associated with the top of the Morrow, and the Mississippian peak. The amplitude change due to channel thickening is more complex. The amplitude of the Mississippian peak increases as the channel thickens in the higher resolution model (Fig. 9a), but not as much as it does in the lower resolution model (Fig. 8a). Unlike the lower resolution model which also shows an increase in trough amplitude with thickening, the higher resolution model shows that the trough above the Mississippian peak actually decreases in amplitude and widens as the channel thickens from 21 to 66 ft. (6.4 to 20 m.) (Fig. 9a). The amplitude increase of this trough towards the Statton well suggests that the Morrow-Mississippian interval is approaching maximum tuning thickness (causing constructive interference of the higher resolution model wavelet) in the Statton well, but is greater than tuning thickness (causing destructive interference of the wavelet) in the Rooney well.
After adding 10% random noise to the higher resolution multi-well model (Fig. 9b), many of the seismic anomalies mentioned above still show up. The isochron thickening between the Statton and Cannon wells is less obvious, but the extra peak still appears. Likewise with the isochron thickening and extra peak development between the Rooney and Shumate wells. The isochron thickening between the Statton and Rooney wells is still very obvious. However, the amplitude changes between these wells are slightly obscured though still visible. As with the single well models, the higher resolution multi-well model (Fig. 9b) seems less affected by noise than the lower resolution multi-well model (Fig. 8b). The reason for this is probably the same as that explained earlier for the single well models.