
Kansas Geological Survey
Open-file Report 2001-38
|
|
|
Kansas Geological Survey Open-file Report 2001-38 |
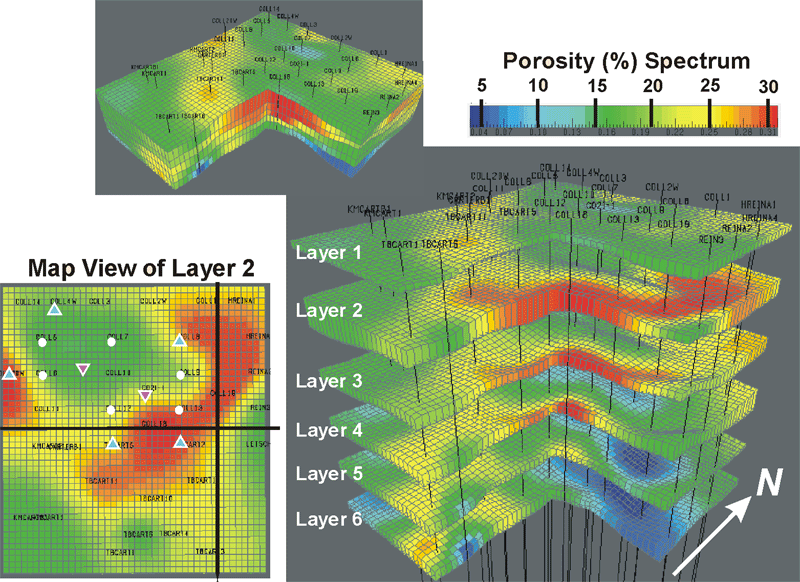
3D visualization of the six layer model for the Lansing-Kansas City "C" zone shows the variability in the porosity and thickness within each layer. Porosity and thickness for each layer was mapped using Geographix with a 110 foot by 110 foot grid. Output files for thickness and porosity contours for each layer were imported into Landmark graphics VIP 98+ Reservoir Simulator. The maps and 3D view are from the initial characterization prior to drilling the CO2 I-1 well and are output from the simulator (Rajesh Kunjinthaya, Tertiary Oil Recovery Project, University of Kansas).
|
|
|
e-mail : webadmin@kgs.ku.edu
Last updated December 2001
http://www.kgs.ku.edu/PRS/publication/OFR2001-38/P2-07.html