http://www.kgs.ku.edu/PRS/publication/2006/OFR06_06.html/p3-01.html
Last Modified April 2006
|
Carbonate Lithofacies Prediction Using Neural Network and Geostatistical 3D Modeling of Oolite Shoals, St. Louis Limestone, Southwest Kansas |
Kansas Geological Survey KGS Open-file 2006-04 |
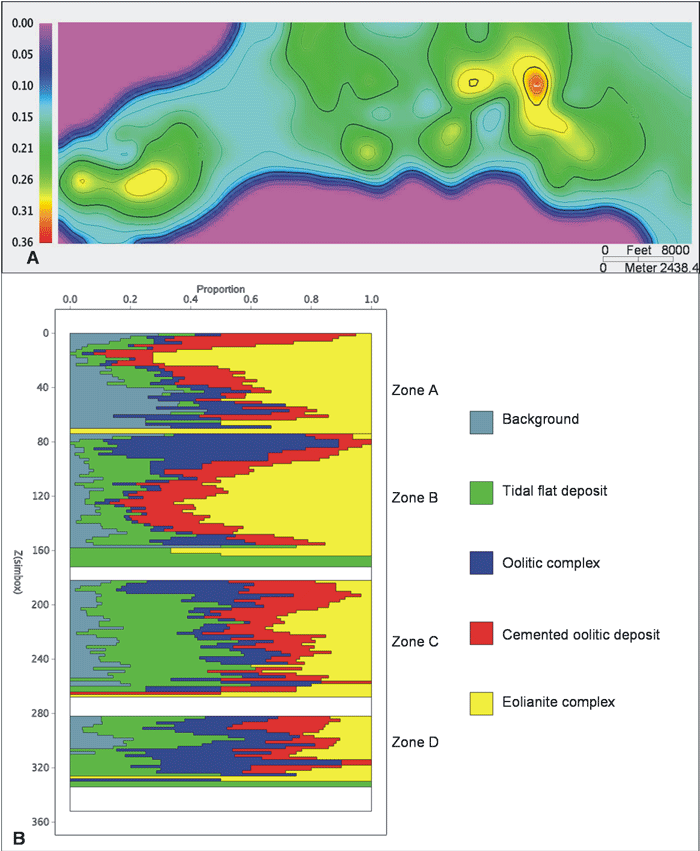
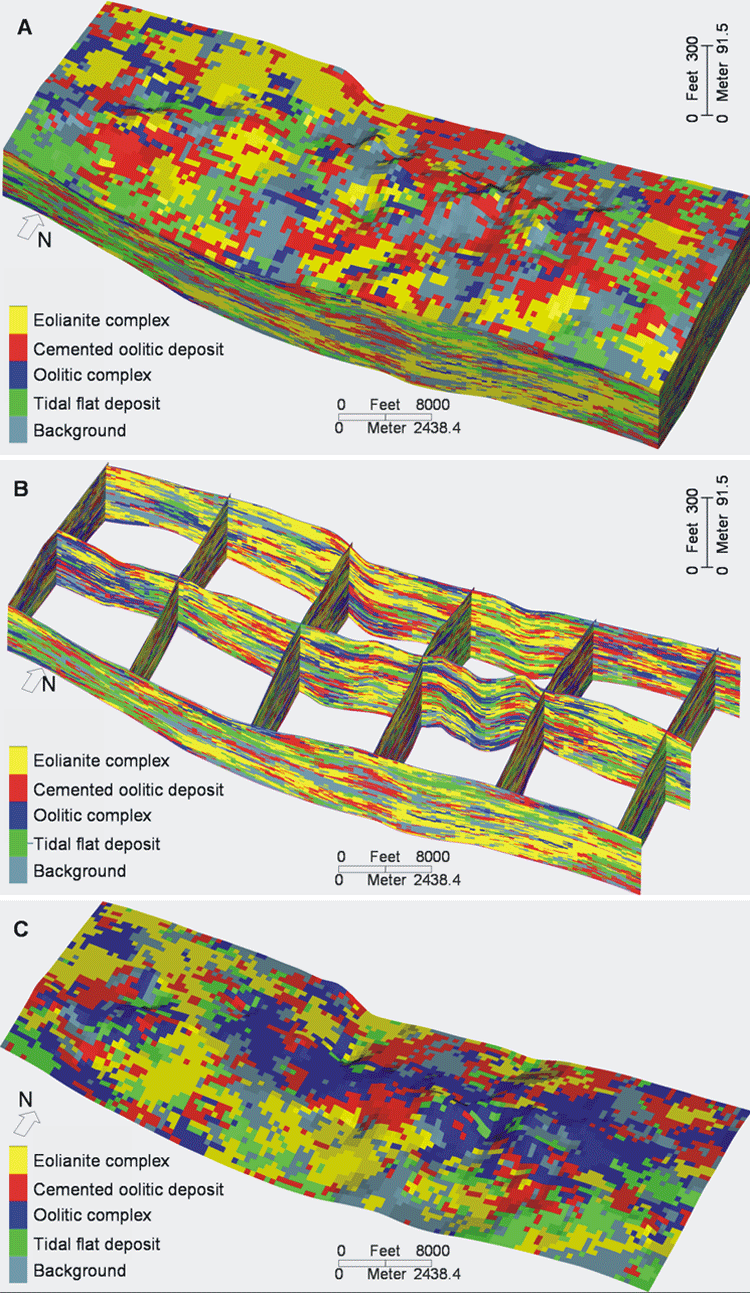
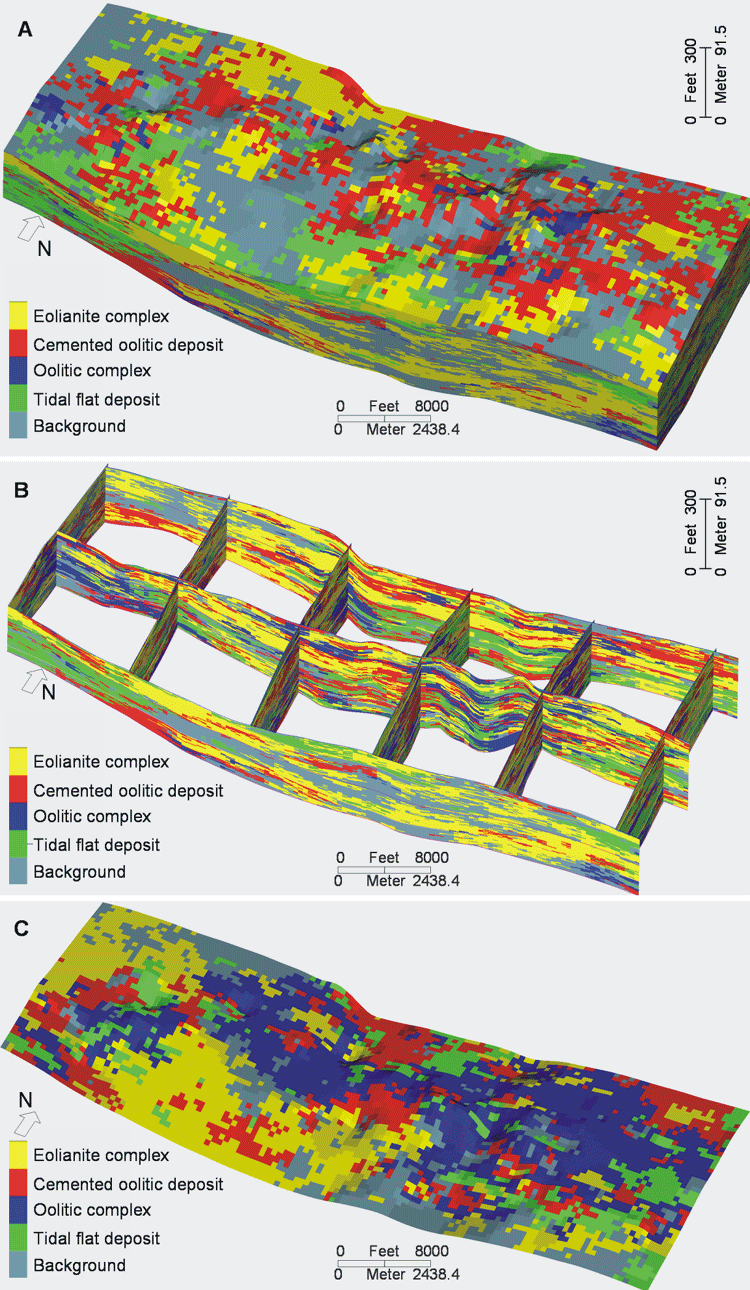
Indicator simulation is a different approach to building facies distributions. Instead of using geometric data to model facies objects, indicator simulation is based on variograms generated from facies curves. The variograms represent both the size and 3D spatial frequency of the facies patterns. Experimental variograms are first computed from facies curves in the wells, and then fitted to the variogram model to obtain horizontal and vertical ranges of the facies. To add geological constraints to the simulation realizations, vertical facies proportion curves and two-dimensional facies proportion maps were built from the well data and used as soft constraint. Two simulations were performed using simple kriging (SK) and Bayesian kriging (BK). The primary axis of the horizontal variogram model was east-west, respecting the general structural orientation. In both simple and Bayesian-derived facies models, oolitic complexes are adjacent to the local highs in the St. Louis Limestone zone B following the trend of the deeper embayment in the south, which is well defined by the facies proportion constraints. The facies model simulated using Bayesian kriging tends to combine nearby similar facies together, and shows more connectivity in the oolitic deposits and more geologically reasonable geometry for facies compared with the facies simulation results from simple kriging. Multiple equally probabilistic realizations are gained by repeating this stochastic procedure.
Compared to the object-based simulation, facies simulated using indicator simulation show a similar overall distribution, but geometric distribution of individual facies is more dispersed and shows decreased lateral and vertical connectivity. Since the facies objects were initially simulated around wells, facies in the object-based model tend to show condensation in the vicinity of the wells even though the same volume proportions were used as in indicator simulations. The dimensions of oolitic complexes (8,845 ft [2654 m] X 3370 ft [1011 m]) and the cemented oolitic deposits (5237 ft [1571 m]X 1890 ft [567 m]) computed by indicator simulation are comparable to the geometry computed with the object-based models.
In both indicator and object-based approaches, the modeled depositional trends, geometry and patterns reflect lithofacies curves and proportion data calculated from well data. The modeled facies distributions support an interpretation of the St. Louis Limestone as a series of oolitic grainstone shoals deposited during fluctuations of relative sea level. Object-based and indicator 3D geostatistical facies models provide similar insights into the uncertainty of facies architecture of the St. Louis Limestone.
http://www.kgs.ku.edu/PRS/publication/2006/OFR06_06.html/p3-01.html
Last Modified April 2006