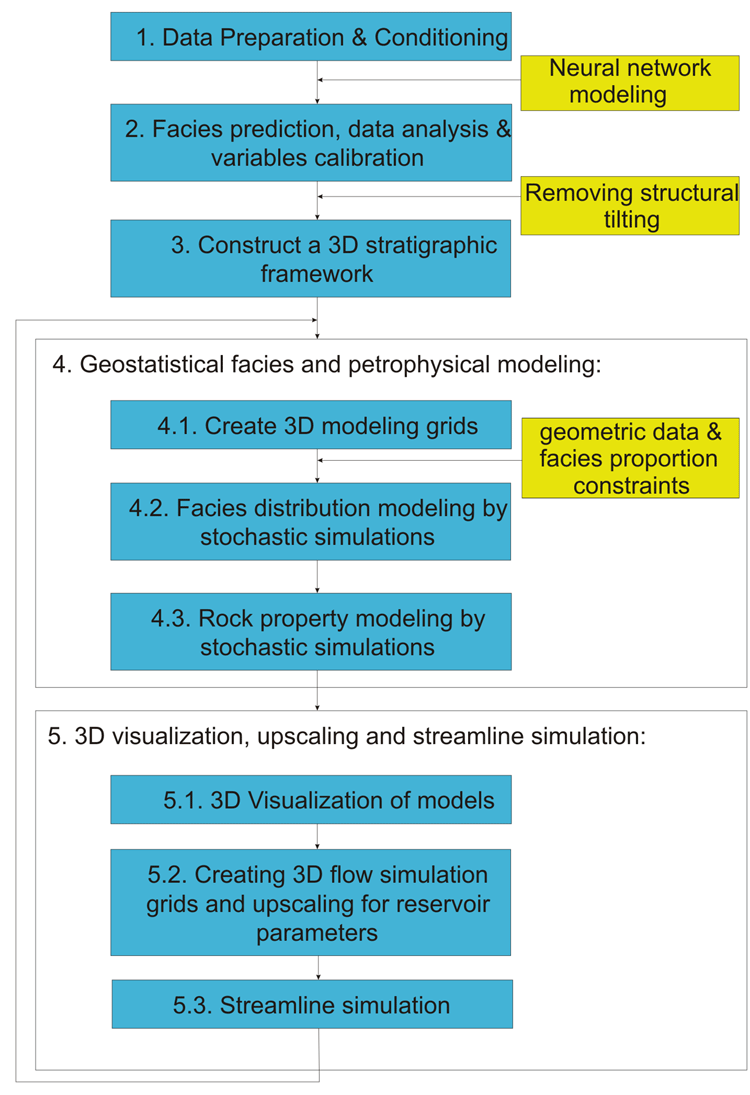
Schematic illustration of the major steps of integrated geostatistical modeling and simulation used in the study of St. Louis Limestone reservoirs. Major aspects in integrated reservoir characterization include data collection, stratigraphic modeling, facies modeling, rock property modeling, and static model ranking and upscaling. Details of the methods differ depending on the availability, quantity and quality of data set, and more importantly the geology of the target reservoirs. In this study, an integrated geostatistical approach was focused to address the modeling and simulation of the relatively thin oolitic reservoirs of the St. Louis Limestone. The procedure used in this study involves five major steps.
- Available data were collected for the selected reservoir. As is typical of the smaller fields of the Mid-continent U.S., 3D seismic data were not available. Available data were primarily associated with wells and consisted of different types of data (core descriptions and petrophysical measurements, wire-line logs, stratigraphic tops, and fluid production), at different scales (vertical, horizontal, fine-scale core data, coarse-scale wire-line log data) and degrees of quantification (descriptive facies, interpreted depositional environments, digital logs, and reported fluid production). All collected data from Archer Field were assembled into a relational database.
- With the selected neural network parameters, a single layer neural network model was trained from digital well logs based on 1,000 half-foot intervals of cored wells (network size of 35, and damping parameter of 0.01). Core data were used to calibrate the log depths in cored wells, and digital well logs were normalized in all wells. In the St. Louis Limestone A, the model was used to predict lithofacies in wells where core is absent. Rock properties from core analysis were calibrated and correlated with digital well log data. Available core-measured petrophysical data were studied to build porosity-permeability transforms within each lithofacies.
- Wells from the field areas with stratigraphic horizons in the St. Louis Limestone were assembled through a database. Predicted lithofacies curves were used to verify the top picks for zones of the St. Louis Limestone along with the traditional log markers and patterns. Without seismic data, original structural maps of St. Louis Limestone zones were built from stratigraphic horizons along with available fault information. Removing the effect of tilting during the Laramide orogeny was a key to recovering the original structural feature during deposition of the St. Louis Limestone. Structural maps of St. Louis Limestone zones were used to build a stratigraphic framework.
- Based on available data, appropriate dimensions were selected to construct 3D modeling grids from the stratigraphic framework. Raw well data (facies and petrophysical data) were entered, blocked, and centered at the geological framework grids. Facies-proportion information calculated from well data and available geometric data of depositional facies was used as constraints for facies modeling. Various geostatistical and stochastic methods (object-based and indicator simulations) were applied to construct 3D facies models. With the available lithofacies curves at well locations, and the collected geometric data for the main depositional facies, object-based stochastic methods were used to build three-dimensional models of facies in the St. Louis Limestone. Facies proportion maps calculated from well data were used as soft constraints. Geometry data and azimuth range were used to generate facies objects around the wells that honor the well data.
- Visualization tools were used to visualize 3D facies and petrophysical models. A coarse simulation grid was built and the rock parameter simulations were upscaled to the corresponding cells. The porosity and water saturation were upscaled using arithmetic averages. The permeability was upscaled using arithmetic-harmonic average. Streamline simulations were used to evaluate the realizations of the property distributions that are reasonable from both geologic and fluid flow properties after upscaling the geologic models. Drainage functions were calculated from the results of streamline simulation. The streamlines display different fluid flow paths among wells for different facies models and were used to evaluate the geological models generated by geostatistical techniques.
http://www.kgs.ku.edu/PRS/publication/2006/OFR06_06.html/p1-03.html
Last Modified April 2006