 |
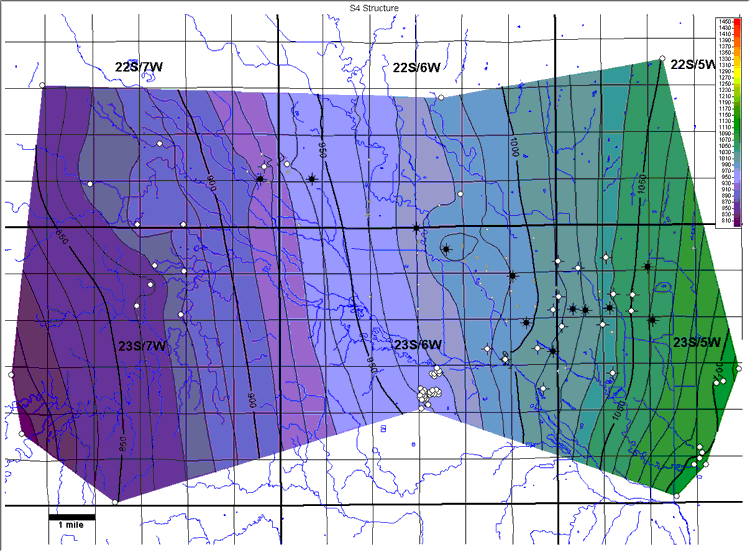
| Figure 3A. Structure map of the S4 marker. Contour Interval = 10 ft.
|
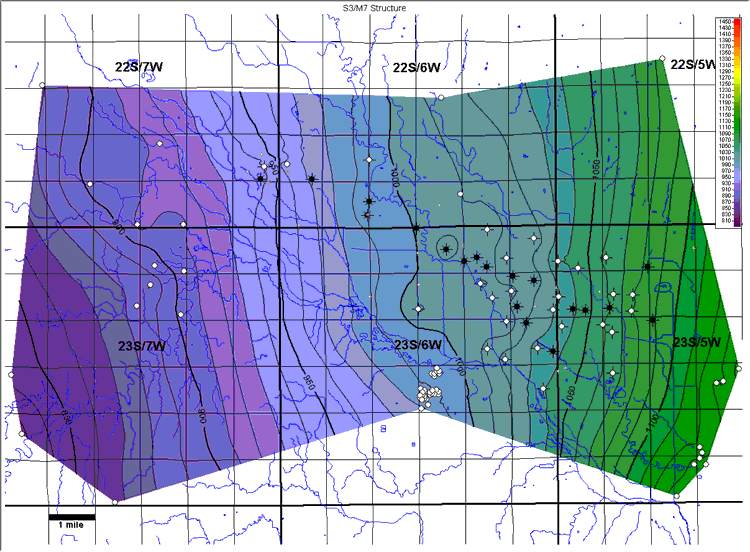 |
| Figure 3B. Structure map of the S3 marker and laterally correlated M7
marker. Contour Interval = 10 ft. |
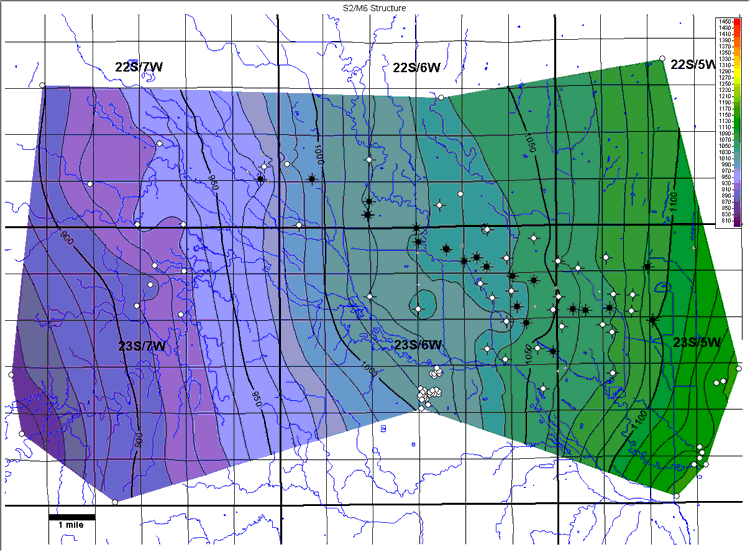 |
| Figure 3C. Structure map of the S2 marker and laterally correlated M6
marker. Contour Interval = 10 ft. |
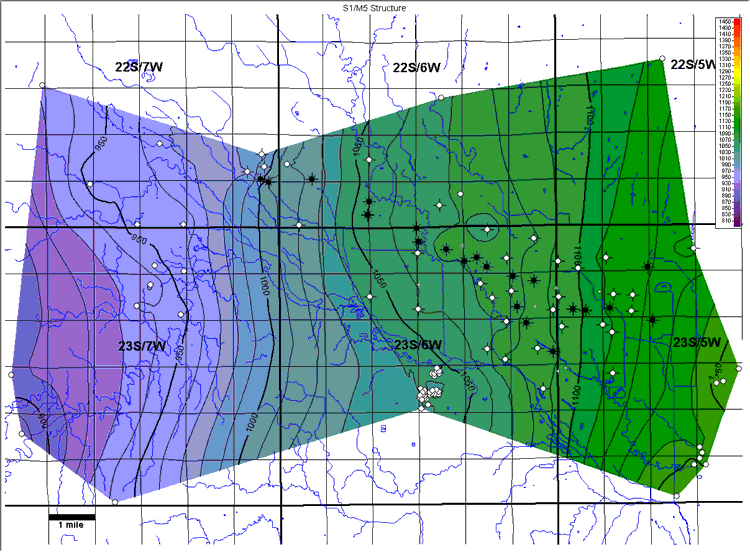 |
| Figure 3D. Structure map of the Top of Hutchinson Salt Member (S1 marker)
and laterally correlated M5 marker. Contour Interval = 10 ft. |
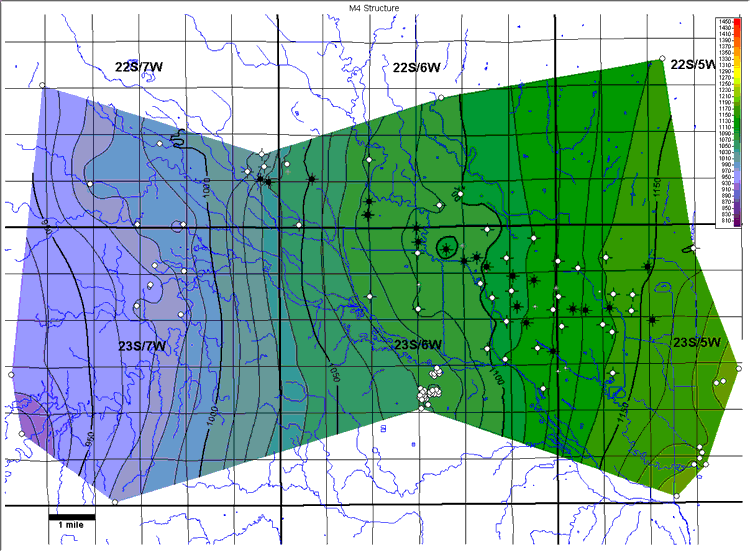 |
| Figure 3E. Structure map of the M4 marker. Contour Interval = 10 ft.
|
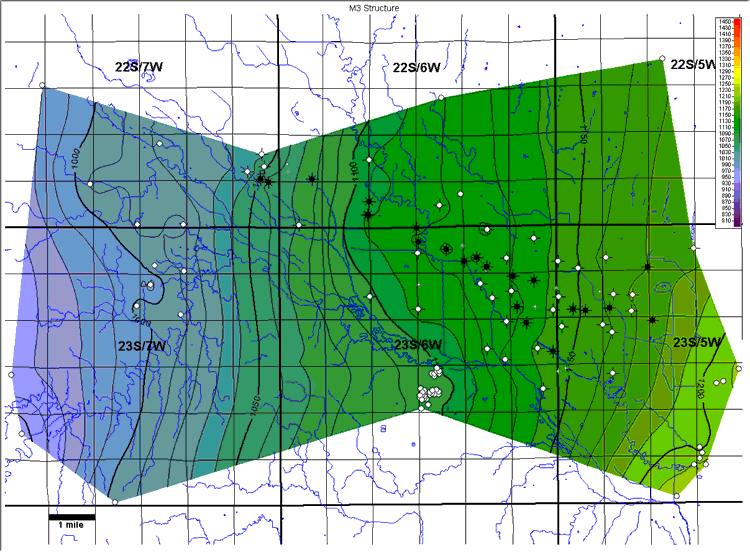 |
| Figure 3F. Structure map of the M3 marker. Contour Interval = 10 ft.
|
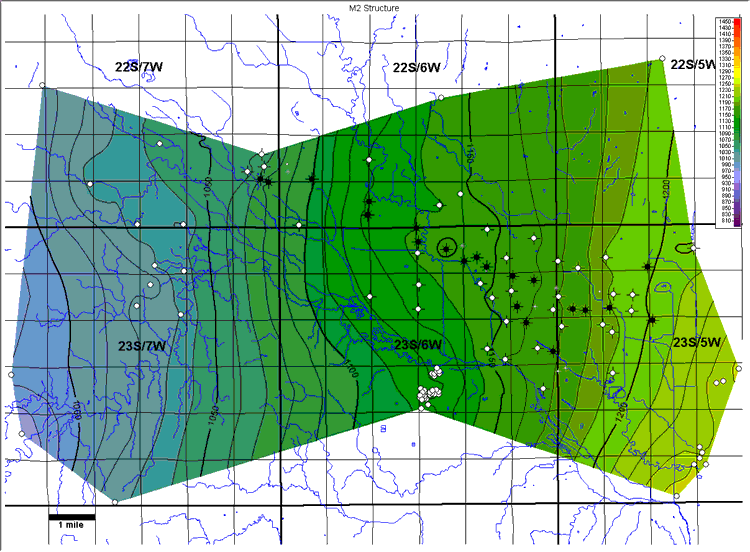 |
| Figure 3G. Structure map of the M2 marker. Contour Interval = 10 ft.
|
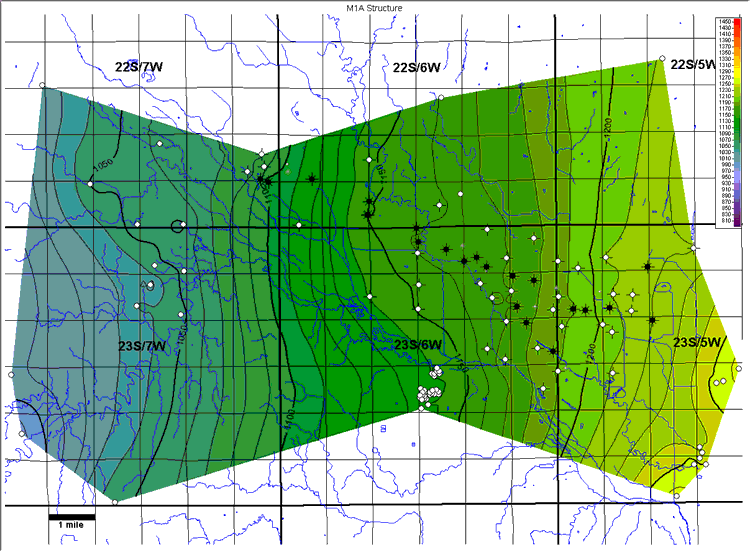 |
| Figure 3H. Structure map of the M1A marker. Contour Interval = 10 ft.
|
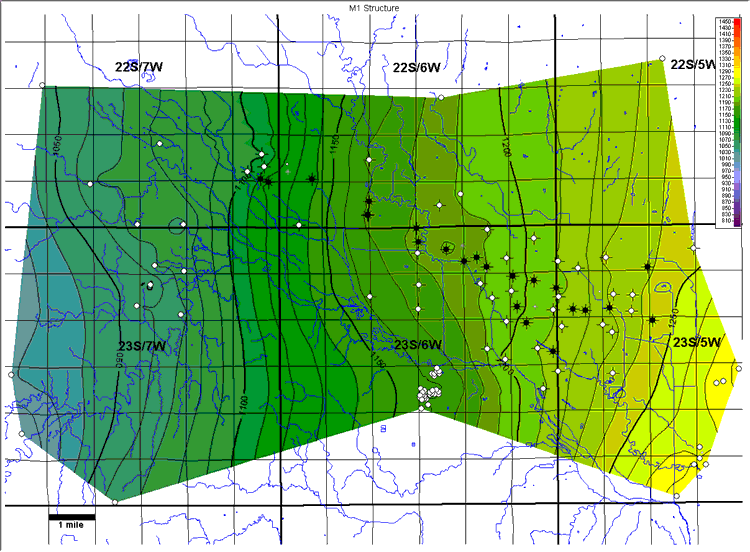 |
| Figure 3I. Structure map of the M1 marker. Contour Interval = 10 ft.
|
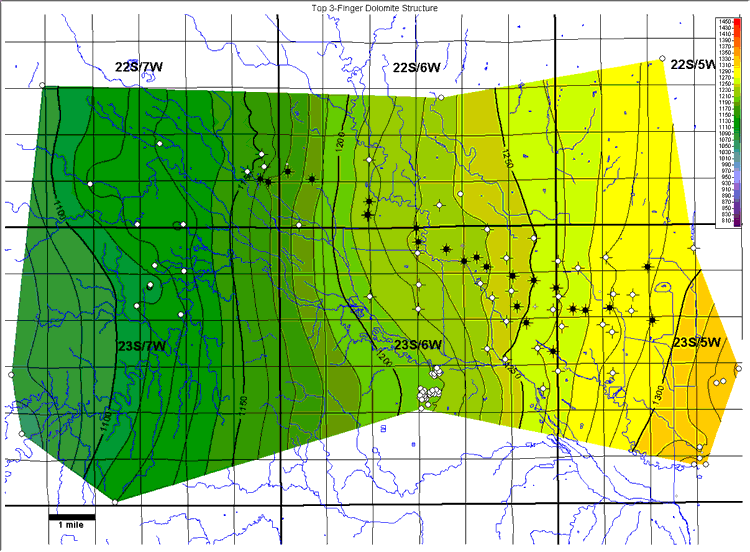 |
| Figure 3J. Structure map of the top 3-finger dolomite. Contour Interval
= 10 ft. |
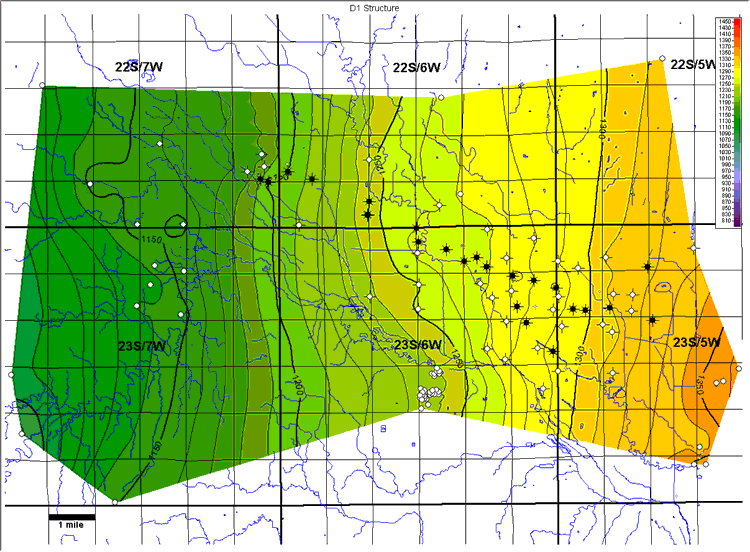 |
| Figure 3K. Structure map of the D1 marker. Contour Interval = 10 ft.
|
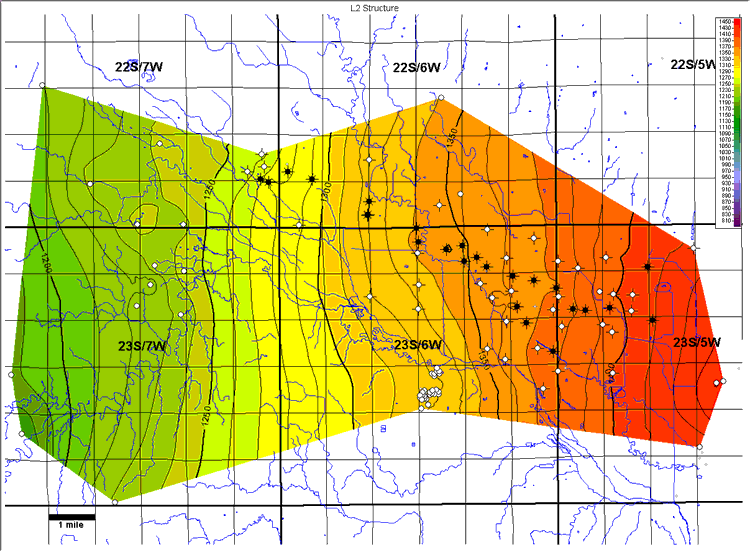 |
| Figure 3L. Structure map of the L2 marker. Contour Interval = 10 ft.
|
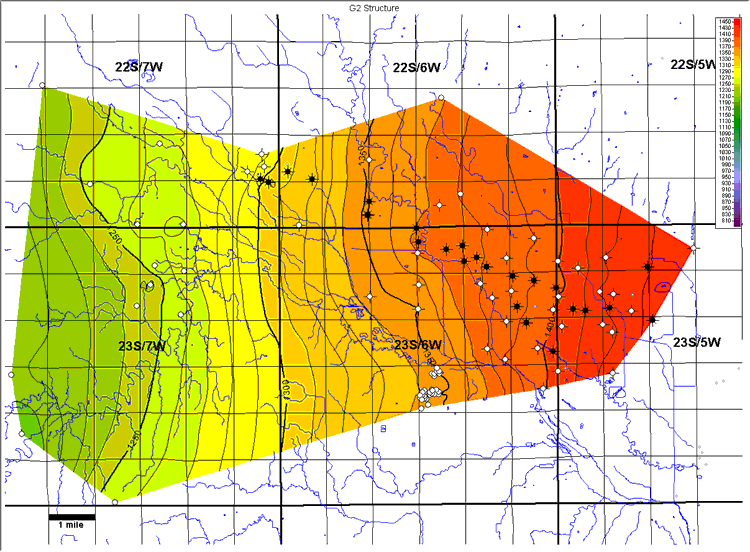 |
| Figure 3M. Structure map of the G2 marker. Contour Interval = 10 ft.
|
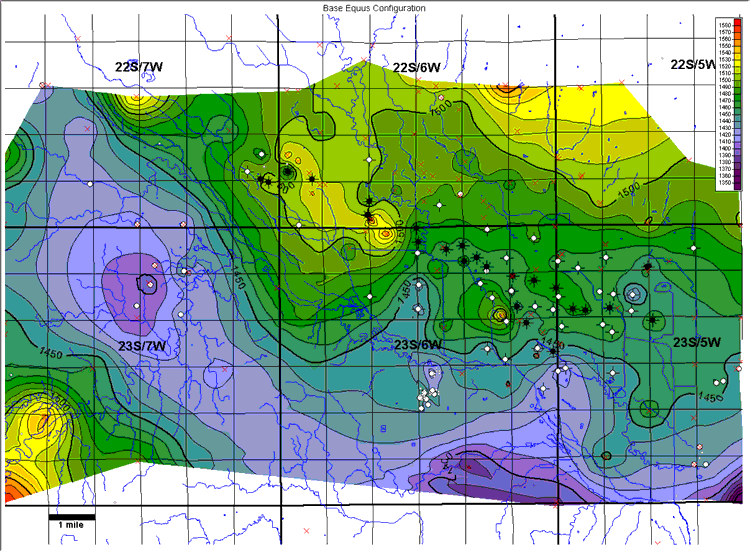 |
| Figure 3N. Configuration map of the Base of Quaternary Equus Beds. Contour
Interval = 10 ft. Red crosses indicate supplemental control points from
water well completion records, test holes, and KGS publications, which
have been used in mapping the Base Equus configuration. |
Wells within the study area not used in generating these maps are displayed
in gray at half size.
