 |
|
Kansas Geological Survey Open-file Report 2003-31 |

Input data for Reservoir Simulation
3 Layer model of the reservoir
Analytical aquifer below the bottom layer
Grid cell size 110 ft by 110 ftReservoir temperature = 120oF
Oil Gravity = 40 API
Gas gravity = 0.8 (Air = 1.0)
Water salinity = 75,000 ppm
Initial reservoir pressure = 2,000 psiWells produced at 100 psi bottomhole pressure
Aquifer porosity = 0.15
Aquifer permeability = 0.1 mdInitial permeability estimated from Permeability-porosity cross plot
K= 0.746 e 18.9
or K = 10(Phi*100)*0.082 - 0.127
where Phi is in fraction
How to generate intial Sw distribution lacking resistivity logs at most wells?
Step 1
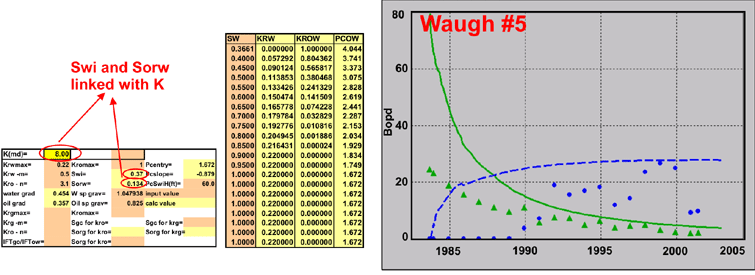
Starting permeabilities in Layers 1, 2, and 3 were 8 md, 12 md, and 8 md.
The relative
permeability-capillary pressure control panel for Layer 1 (K = 8 md) is shown
below. The starting Rel K exponents were m = 0.5 and n = 3.1.
These values result in too high an oil and water production.
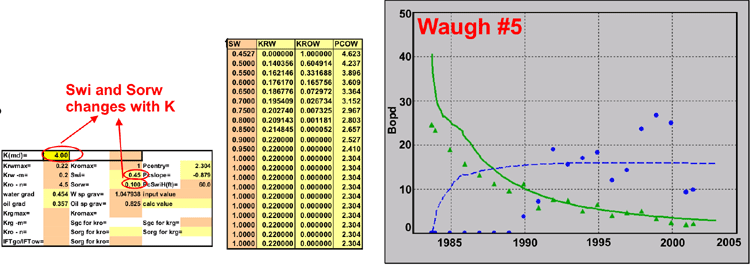
Step 2
To reduce fluid production, the permeabilities in Layers 1, 2, and 3 were
changed to 4 md, 6 md and 8 md. The result of changing K from 8 md to 4 md
on Swi and Sorw is shown below.
Rel K exponents: m = 0.2, n = 4.5
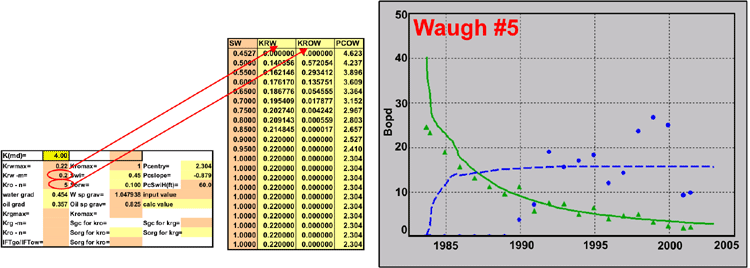
Step 3
Finally, the decline curves were matched by adjusting the Rel K exponents, m = 0.2 and n = 5.0. Change of these exponents did not effect the Swi and Sorw but changed the Krw and Krow values.
|
|
|
Last updated July 2003
http://www.kgs.ku.edu/PRS/publication/2003/ofr2003-31/P3-01.html