|
Reservoir Characterization to Inexpensively Evaluate
the Exploitation Potential of a Small Morrow Incised Valley-fill
Field
|

Kansas Geological Survey
Open-file Report 2002-9 |
Core Petrophysical Properties
Capillary Pressure and Water Saturation
Fluid saturations in the Minneola unit can be determined from
both electrical wireline log interpretation and from capillary
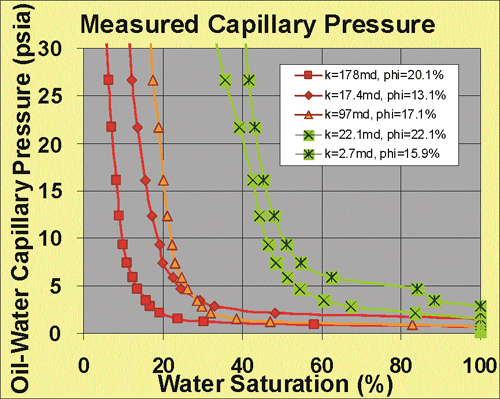
pressure data. The capillary pressure curves show a relationship
of increasing threshold entry pressure with decreasing permeability
that is consistent with decreasing pore throat size with decreasing
permeability (Figure). “Irreducible” wetting phase saturations
(Swi) increase with decreasing permeability similar to other Morrow
sandstones. The more permeable cores exhibit transition zones
of only several feet while the least permeable cores exhibit transition
zones of 20-30 feet. Based on the saturation versus height profiles
the more permeable reservoir intervals were at or near “irreducible”
saturation on discovery. For the less permeable rock, water saturations
were considerably greater and reflected the high amount of bound
water due to shalyness. For all cores, the wetting phase saturation
at approximately 75 feet above free water level is within 5-10%
of the “irreducible” saturation that can be achieved
by these reservoirs in Kansas, given available structural closures
in the state. Comparison between curves indicates that entry pressure,
“irreducible” wetting phase saturation, and the capillary
curve curvature (reflecting increasing pore throat size heterogeneity)
increases with decreasing permeability.

Generalized Capillary Pressure Curves
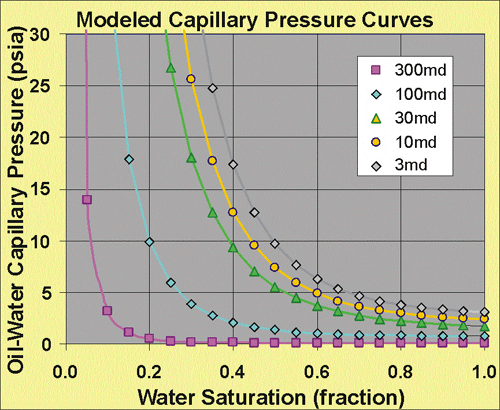
To provide capillary pressure curves for the reservoir simulation
it was necessary to develop generalized curves that represented
the specific permeabilities that might be assigned to a gridcell.
Equations to construct generalized capillary pressure curves were
constructed based on the relationships evident from the entry
pressures in the air-mercury capillary pressure curves and the
capillary pressure curve shapes, and from the saturations evident
in the air-brine capillary pressure analysis. The relationships
between increasing entry pressure, “irreducible” wetting
phase saturation, and the capillary curve curvature (reflecting
increasing pore throat size heterogeneity) with decreasing permeability
were utilized to develop equations that would predict the capillary
pressure curve using permeability as the independent variable.
Entry pressure, or the first pressure at which wetting phase
desaturation begins and similar to R35, exhibits a strong correlation
with permeability and can be predicted using:
Pcowentry = 1.311 log10ki + 3.364
Where Pcowentry is the oil-water entry pressure and ki is the
in situ permeability.
To model the changing capillary curve shape with decreasing
permeability an empirical function was developed that predicted
curve shape and “irreducible: saturation from ki:
Pcow = Pcowentry + exp(Pca + Pcb Sw 2)
where:
Sw = water saturation (%)
Pca = 1.363 log10ki + 9.64
Pcb = -0.29 log10ki 3 + 0.85 log10ki 2
- 0.64 log10ki - 0.85
Using the above equations capillary pressure curves were constructed
for six general classes of permeability and used in the reservoir
simulation model.

Single-Point Air-Brine Capillary Pressure
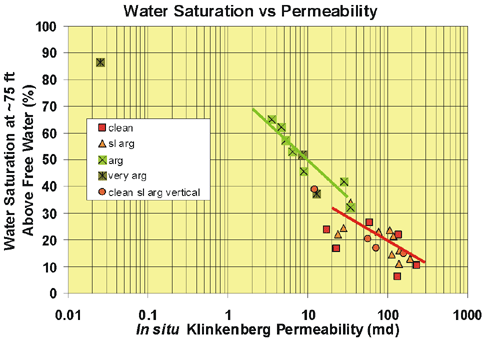
“Irreducible” brine saturation (Swi; Sw at 75 ft
above free water) is strongly correlated with permeability (ki)
for “clean” and “shaly” lithologies and Swi
decreases with increasing ki. Shaly sandstones exhibit a significant
greater increase in Swi with decreasing permeability than clean
sandstones. This is consistent with increasing surface area and
an increase in micorpores with increasing clay and shale content.
Clean sandstones exhibit little increase in Swi with decreasing
ki, consistent with only modest increase in surface area and microporosity
with quartz or carbonate cementation. "Irreducible"
saturation can be predicted using the following equations:
Shaly -Very Shaly: Swi = -28.89 log10kinsitu
+ 78.6
Clean-Slighlty Shaly: Swi = -14.55 log10kinsitu
+ 46.8
The standard error of prediction for these equations is 5+1%.
It is important to note that the higher “irreducible”
saturations of the lower porosity and permeability sandstone samples
diminishes their relative contribution to the total storage and
flow capacity of the reservoir compared to the higher porosity
and permeability samples. The predicted irreducible water saturations
are consistent with water saturations measured in the reservoir
from wireline logs.

e-mail : webadmin@kgs.ku.edu
Last updated March 2002
http://www.kgs.ku.edu/PRS/Poster/2002/2002-9/P2-04.html


