|
Reservoir Characterization to Inexpensively Evaluate
the Exploitation Potential of a Small Morrow Incised Valley-fill
Field
|

Kansas Geological Survey
Open-file Report 2002-9 |
Core Petrophysical Properties
Permeability and Porosity
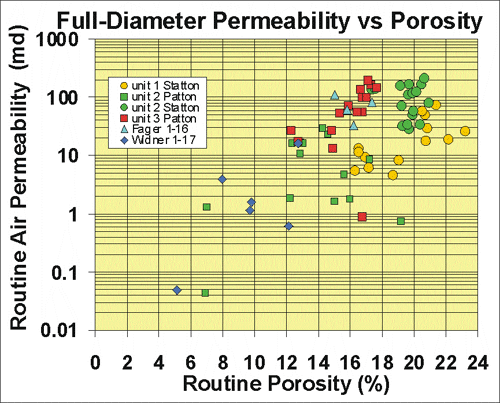
To predict permeability within the Morrow for all well locations
a relationship between measured permeabilities and porosity and
argillaceousness (shalyness) was developed. The general relationship
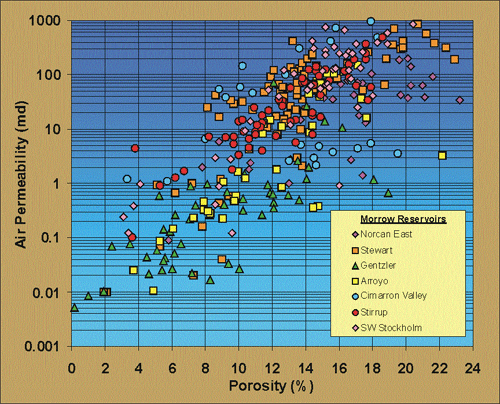
between permeability and porosity for the Norcan East Minneola
Unit Morrow is similar to the relationship exhibited by other
Morrow channel sandstones. Although previous Morrow study (Byrnes,
2000) has shown relationships between permeability and porosity
as a function of lithofacies, because details of lithofacies
are not available for many wells in the Minneola unit and several
unit are just channel sandstones, a simpler predictive relationship
for permeability was developed. A measure for shalyness was obtained
from correlation of shalyness in core with API gamma-ray units
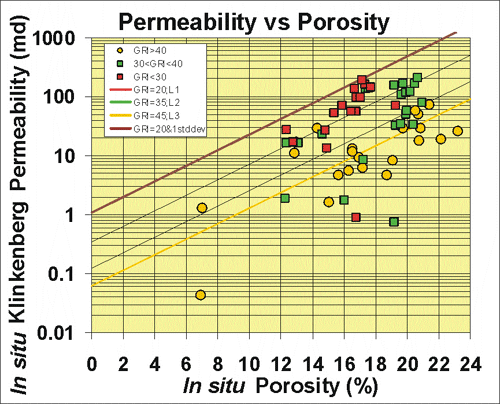
on logs. Permeability increases with both increasing porosity
and decreasing shalyness. Also evident is that the cleaner sandstones
do not always exhibit the highest porosity values. This may be
due to greater quartz cementation or porer sorting. Permeability
may be predicted within a factor of 3.4 using the following relation:
log10kinsitu = 0.134 finsitu - 0.03 GRI + 0.138
Where kinsitu is the in situ Klinkenberg permeability and finsitu
is the in situ porosity. The standard error of prediction for
this equation is a factor of 3.4 (e.g. a predicted permeability
of 1 md might be 3.4 md or 0.3 md). For prediction of reservoir
permeability three classes of shalyness were defined; GRI<30
API units, 30<GRI<39 API units, and GRI > 40 API units.
Based on wireline-log analysis the Morrow has been subdivided
into three flow units in the Minneola Unit. For each of these
intervals the average GRI over the flow unit interval was calculated.
The interval was assigned to one of the three classes based on
the average interval GRI and the permeability calculated using
the appropriate equation for that class as determined by linear
regression analysis for each class:
GRI <30 log10kinsitu = 0.140 finsitu - 0.558
30<GRI<40 log10kinsitu = 0.137 finsitu - 0.924
GRI >40 log10kinsitu = 0.121 finsitu 1.069
Both Patton #1-3 and Statton #2-12 show a fining-upward sequence
that also correlates with increasing GRI upward. Since permeability
decreases with increasing shalyness, the lower intervals in these
wells exhibit higher permeability. The division of the Minneola
reservoir into 3 layers is consistent with subdivision of the
fining upward sequence.
Using the predicted permeabilities for each of the three layers
at each well location, gridcell permeability values were assigned.
Gridcell values for the surrounding gridcells in the simulation
model were assigned values based on mapping interpolation.


e-mail : webadmin@kgs.ku.edu
Last updated March 2002
http://www.kgs.ku.edu/PRS/Poster/2002/2002-9/P2-02.html


