|
Reservoir Characterization to Inexpensively Evaluate
the Exploitation Potential of a Small Morrow Incised Valley-fill
Field
|

Kansas Geological Survey
Open-file Report 2002-9 |
Cross-sections: Autocorrelation and Integrated


3-D Autocorrelation
Geological correlations of wireline logs from wells along the
computer-generated cross sections were made using the computer
program CORRELATOR (Olea 1988). The program searches for correlations
by comparing pairs of sequences of measurements, typically wireline
logs from vertical wells. CORRELATOR usually processes two log
traces per well, referred to as a "shale log" and a
"correlation log." In this study, the shale log is a
gamma ray log and the correlation log the average of a density
log and a neutron log.
Let us call "reference well" the well on the left
side of a display and "matching well" to the well to
the right. At any given depth zi in the reference well, CORRELATOR
automatically selects the depth zkbest in the matching well that
maximizes the weighted correlation coefficient as the correlated
position. If the log traces are sampled at regular intervals,
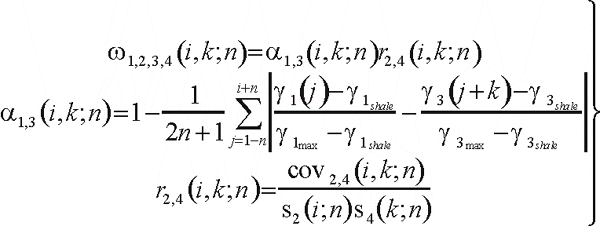
the weighted correlation coefficient w1,2,3,4(i,k;n) is defined
as the product of the standardized shale similarity coefficient
a1,3(i,k;n) for the shale logs and the Pearsonian correlation
coefficient r2,4(i,k;n) for the correlation logs:

The standardized shale similarity, the covariance cov2,4(i,k;n),
and the standard deviations s2(i;n) and s4(k;n), are each calculated
over correlation intervals of 2n+1 readings. The correlation
coefficient reflects the degree of resemblance in shape of the
log traces within the intervals of the two wells being compared.
The shale similarity is sensitive to the difference in the relative
proportion of shale within the intervals in the two wells. Maximizing
the weighted correlation coefficient requires the specification
of an additional parameter, the interval kmin<k<kmax
over which the search for the best match will be made. The automatic
maximization of the weighted correlation coefficient always yields
one largest value w1,2,3,4max(i,kbest;n) for every elevation zi
in the reference well. However, not all of these best matches,
or tentative stratigraphic correlations, are retained. In an initial
step, the system discards all weak correlations that are below
a specified threshold value. In a later step, an expert system
algorithm checks for global consistency of correlations and identifies
any lines of correlation that cross other lines of correlation
or that deviate significantly from the pattern formed by the correlations
between other intervals. The expert system interactively displays
these suspect correlations and suggests why they may be erroneous.
CORRELATOR first compares two wells and stores the acceptable
correlations in a file. Then, a third well is compared to one
of the original wells and the process repeated. By successively
adding wells to the end of the growing cross section, a file of
correlations is constructed that extends the length of the line
of wells. The poster shows two modes of display. In the first
one, given key elevations at one well, the program finds the equivalent
elevations in all the wells of a cross-section. In the second
display, values of gamma ray and average porosity, fla(i), are
combined to produce a value of porosity corrected by shale effect,
flc(i), which are used to generate a false-color display:

e-mail : webadmin@kgs.ku.edu
Last updated March 2002
http://www.kgs.ku.edu/PRS/Poster/2002/2002-9/P1-11b.html


