

Prev Page--Figure 10.4 ||
Next Page--Figure 10.7
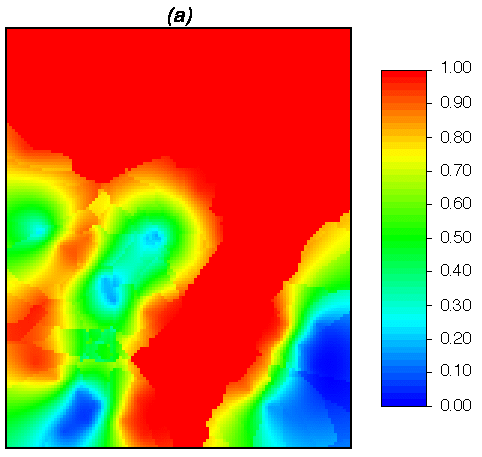
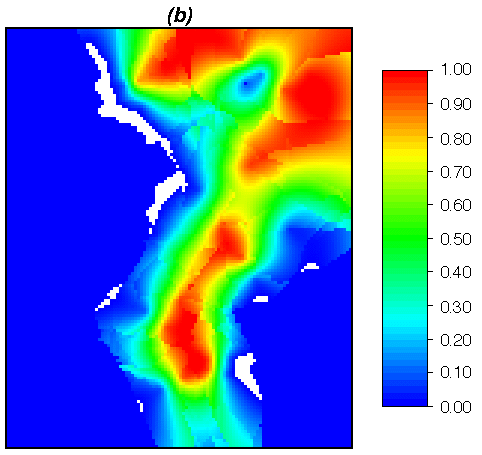
Figure 10.6 Probability maps for two thresholds for elevation to UNCF based on
indicator kriging.
Map (a): Probability that the elevation is below -7850 ft.
Map (b): Probability that elevation is below -7950 ft.
Kansas Geological Survey, Mathematical Geology Section
Updated March 1999
URL="http://www.kgs.ku.edu/Mathgeo/Books/Geostat/fig10_6.html"