1998 Annual Water Level Raw Data Report for Kansas
Prev Page--Acquisition Activity || Next Page--Spatial Quality Control
John C. Davis, Mathematical Geology Section
The primary variable measured in the water well observation program is depth to water in an observation well. This primary variable is associated with three secondary variables: the ground elevation, east-west coordinate, and north-south coordinate of the well. The secondary variables serve to locate the primary variable in space, and make it possible to determine spatial relationships between observation wells, including mapping the water table and calculating changes in aquifer volume. Historically, the three location variables were determined initially by the U.S. Geological Survey for each well and not re-determined unless a serious error in the original coordinates was suspected. In the 1997 ground water observation measurement program conducted by the Kansas Geological Survey, the geographic (latitude and longitude) coordinates of all wells were re-determined by GPS techniques. In the 1998 measurement program, all observation wells were again re-determined by GPS. Part of this report discusses differences between 1997 and 1998 GPS locations and possible reasons for any discrepancies.
In addition, several secondary characteristics of the observation wells and of the measurement procedure were noted in order to determine if these might influence the quality of the measurements being made (in statistical parlance, these extra measurements are called exogenous variables). As part of the quality assurance program, water level measurements were repeated two or more times on 95 wells, yielding a collection of 121 quality control observations. Because these data include replicates, they provide an additional check on estimates of the influence of well conditions or measuring techniques on water levels. A subsequent round of measurements sampled an additional 40 or so wells, including re-measurements of wells whose initial water level values are suspect, plus new wells that are candidates for inclusion in the observation well network.
The primary variable, depth to water, varies with geographic location and differences in topography so much that these factors will overwhelm all other sources of variation. This means that any errors in location may have a profound effect on the water table elevation. To avoid the complications of simultaneously considering uncertainties in the secondary variables, this statistical quality control study is based on first differences (specifically, the difference between 1998 and 1997 depth-to-water measurements). The secondary variables cancel out, leaving only the difference in depth, which is numerically identical to the year's change in water level. In this statistical quality control study, the difference between 1998 and 1997 corrected depth measurements is abbreviated "'98-'97." If the water table is lower this year, the variable "'98-'97" will be a positive number. Because five wells measured in the current program were not measured in 1997, a total of 514 wells have the variable "'98-'97."
The objective in our quality control study is to identify and assess possible sources of unwanted variation in water level measurements made by the KGS. The purpose of the analysis is to provide guidance to the KGS field measurement program, to suggest ways in which field measurements might be improved, and to provide information necessary to identify past or current measurements that are suspect. The statistical quality control and field measurement programs have been intimately intertwined from the outset when the KGS assumed responsibility in 1997 for measuring observation wells formerly measured by the USGS. A comparison of results from 1998 with those from 1997 shows that the quality control program is resulting in the desired improvements in the measurement program.
| Analysis of Variance Table for Initial Model | |||||
|---|---|---|---|---|---|
| Source | DF | Sum of Squares | Mean Square | F Ratio | Prob>F |
| Model | 31 | 307.8978 | 9.93219 | 1.6862 | 0.0130 |
| Measurer | 8 | 88.14570 | 11.01821 | 1.8705 | 0.0626 |
| Well Access | 1 | 0.74902 | 0.74902 | 0.1272 | 0.7216ns |
| Downhole Access | 1 | 0.22946 | 0.22946 | 0.0390 | 0.8436ns |
| Weighted Tape | 1 | 3.12738 | 3.12738 | 0.5309 | 0.4666ns |
| Well Use | 5 | 46.57710 | 9.31542 | 1.5815 | 0.1637ns |
| Oil on Water | 1 | 0.23014 | 0.23014 | 0.0391 | 0.8434ns |
| Chalk Cut Quality | 2 | 6.84060 | 3.42030 | 0.5807 | 0.5599ns |
| Aquifer Code | 12 | 150.17024 | 12.51417 | 2.1245 | 0.0144 |
| Error | 482 | 2839.1668 | 5.89039 | ||
| Total | 513 | 3147.0646 | |||
| RSquare | 0.097836 | ||||
A revised model was run that combined aquifers into classes similar to those used in 1997. This 5-part classification distinguishes between (1) alluvial aquifers, (2) alluvial aquifers plus other unconsolidated aquifers, (3) the High Plains aquifer, (4) bedrock aquifers, and (5) bedrock plus unconsolidated aquifers. This has the effect of reducing the degrees of freedom required for the model and thus increasing the sensitivity of the analysis.
| Analysis of Variance Table for Initial Model | |||||
|---|---|---|---|---|---|
| Source | DF | Sum of Squares | Mean Square | F Ratio | Prob>F |
| Model | 23 | 239.4662 | 10.4116 | 1.7546 | 0.0170 |
| Measurer | 8 | 72.31094 | 1.5233 | 0.1463ns | |
| Well Access | 1 | 1.26807 | 1.26807 | 0.2137 | 0.6441ns |
| Downhole Access | 1 | 1.06628 | 1.06628 | 0.1797 | 0.6718ns |
| Weighted Tape | 1 | 3.73878 | 3.73878 | 0.6301 | 0.4277ns |
| Well Use | 5 | 45.36201 | 9.07240 | 1.5289 | 0.1792ns |
| Oil on Water | 1 | 0.02345 | 0.02345 | 0.0040 | 0.9499ns |
| Chalk Cut Quality | 2 | 7.87625 | 3.93813 | 0.6637 | 0.5154ns |
| Aquifer Code | 4 | 81.73868 | 20.43467 | 3.4437 | 0.0086 |
| Error | 490 | 2907.5984 | 5.9339 | ||
| Total | 513 | 3147.0646 | |||
| RSquare | 0.076092 | ||||
None of the components in the revised model are significant except "Aquifer code." This is in strong contrast with results obtained in 1997, when all components of the equivalent model except "Measurer," "Downhole Access," and "Oil on Water" were significant. Unfortunately, the 1997 and 1998 models are not directly comparable be-cause there are different numbers of classes in "Measurer" and "Aquifer Code," and the response variables ('97-'96 and '98-'97) have significantly different variances. It is important to note that the variance of the response variable '97-'96 is over three times greater than the variance of '98-'97.
Importance of Contributing Variables
Even though the contributing variables are not significant sources of variation in '98-'97, it is instructive to examine the relative contributions of each category of the contributing variables. This can be done by examining the least-squares means (averages) of '98-'97 for a specified state of a variable, while holding all other variables at their average value. (In statistical parlance, these averages are referred to as the expected values of the variables.)
|
|
|
|
||||||||||||||||||||||||||||||||||||||||||||||||||||||||||||||||||||||||||||||||||||||
Summary of the Analyses of Variance
Unlike field measurements from 1997, data collected in 1998 show no significant variation attributable to any secondary effect except the aquifer being tapped by the well. The median decline in water level from 1997 to 1998 (0.41 ft), although not large, is almost three times greater than the median decline in the previous year; that is, from 1996 to 1997 (0.14 ft). The variation in decline is signficantly less in the current year than in the previous year. The standard deviation of variable '98-'97 is 2.48 ft, versus a standard deviation of 4.66 ft for variable '97-'96. We may interpret this reduction in standard deviation as reflecting an improved consistency in the water level measurements in the second year of the KGS measurement program.
There are no significant differences between the operators, although it is interesting to note that the operators whose measurements deviated the most from the norm (JCD and WEH) had no prior experience in measuring water levels and measured the fewest wells. There is almost no difference between wells with good access and poor access (an average difference of 0.2 foot) and the same small difference between wells with good downhole access and poor downhole access. This similarity, coupled with measurer's informal comments, suggests that the field crews do not distinguish between these two variables. The variable Well Access may be redundant; a better measure of this property may be extractable from the GPS time log.
The water level measured without a weight on the tape tends to be about 0.4 foot deeper than water levels measured in wells where the tape is weighted. By comparison, the difference between using or not using a weight on the tape was related to a difference in water level of more than 2.6 feet in 1997.
Water levels in wells that were unused (U) or used for public purposes (P) tended to be about one foot shallower than anticipated, while wells whose classification was unknown (?) tended to be about a half-foot deeper.
If the quality of the chalk cut on the measuring tape is "poor," the reading tends to be about 0.6 foot deeper than in 1997; if the cut is "good" the reading tends to be about 0.4 foot deeper; if the cut is "excellent," the reading tends to be nearly the same as the preceding year.
Water levels in Cretaceous aquifers (1) tend to be almost a foot deeper below ground surface than in 1997. The Ogalalla aquifer (4) tends to be about a half-foot shallower. Measurements made in wells tapping alluvial aquifers (2) or mixed sources (3, 5) tend to be about a half-foot or less deeper. Unlike measurements made in 1997, the differences in annual changes of water level for different aquifers are not significant.
Variation Due to Secondary (Locational) Variables
In last year's report (Miller, Davis, and Olea, 1997), an analysis of locational accuracy was not included in the Quality Control study because locational and ground elevation errors were canceled out by differencing. However, it became apparent during the 1997 water level measurement program that discrepancies between GPS measurements and well locations recorded in the historical data could signal important problems. It was noted that incorrect locations in the historical record of observation wells could result in measuring the wrong well, or at the least, wasting valuable field time searching for the correct well. Errors in GPS measurements could cause the same problems in 1998 and subsequent years when field crews are guided to the wells by the GPS navigational aides in WaterWitch.
Consequently, USGS decimal latitude and longitude locations, KGS legal description locations, and GPS decimal latitude and longitude measurements were converted by David Collins to metric UTM zone 14 X- and Y-coordinates using LEO II software. There were a few large discrepancies between USGS latitudes and longitudes and KGS legal locations, but 90% of the differences were less than 6 meters. This is much less than the inherent uncertainty of legal coordinate notation, suggesting that the USGS latitudes and longitudes were derived mathematically from the legal descriptions, a supposition confirmed in an April 7, 1997, memo from Don Whittemore. About 30 wells show serious discrepancies between the two historical measures of location, the same number as were flagged as troublesome in 1997. These wells must be checked and the legal description corrected if it is the variable in error (erroneous USGS locations are to be reported to administrators of the Federal GWSI data base). This verification activity will be part of the certification of the WIZARD data base.
The primary concerns of this quality control assessment are the larger of the differences between new GPS measurements of well locations and any previously measured GPS locations or recorded historical locations of observation wells. Based on the manufacturer's stated GPS positional accuracy for the Garman 45XL global positioning device when used in Kansas, GPS coordinates and legal descriptions of a point (or derived USGS latitudes and longitudes) should fall within 125 meters of each other. In 1997, approximately 40% of the measurements exceed this limit; two wells had location discrepancies of over two kilometers! These were resolved as blunders in their legal descriptions, but approximately 165 wells remained whose locations differ by more than was expected.
Wells showing the most extreme of these differences were investigated during a second cycle of field checking in 1997, when some discrepancies were resolved as the result of historical errors in location and others proved to be recording errors by the field crews (in 1997, only one GPS device was equipped with automatic data recording--others required manual transcription of the GPS latitude and longitude). Some of the smaller differences were attributable to an operational error that occurred during the initial days of field measurement--some GPS devices had been set to record using WGS '94, the current internationally accepted geoid, while others were set to use NAD '27, the geoid historically used by the USGS for topographic maps. When this problem was discovered, all GPS units were reset to NAD '27, but no notation was made of which observations used one setting or the other. The effect of using the 1994 datum was to translate GPS well locations 120 meters to the west and 2 meters to the south relative to equivalent positions on maps made with the 1927 datum. This mistake was avoided in the current field season, and all 1998 locations are recorded with respect to the NAD '27 datum.
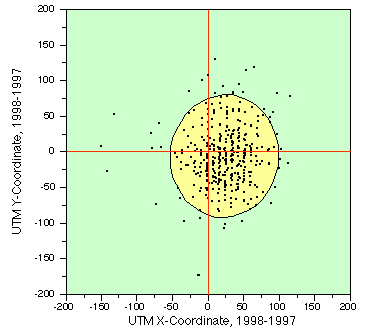
In the 1998 field season, all measurers were equipped with recording GPS-computer combinations that entered the position of the field vehicle automatically into the WaterWitch record, thus avoiding data entry blunders. However, the devices are not fully portable, and part of the discrepency between 1997 and 1998 GPS locations may be attributable to the distance between where the field vehicle was parked and the location of the well being measured. There were 551 wells whose locations were measured by GPS in both 1997 and 1998; 51 of these wells exhibit differences in location greater than 100 meters. Both 1997 and 1998 GPS measurements must be examined, but an initial check suggests that the discrepency results from an erron-eous measurement taken in the 1997 field season for 41 of these wells. Figure 1 is a comparison of the differences between 1997 and 1998 determinations of UTM X and Y coordinates of the 551 wells. The ellipse encloses the central 90% of the observations; the north-south elongation of the ellipse reflects the greater variance in latitudes as compared to longitudes. The median difference in location determina-tions from 1997 to 1998 is a shift of 27 meters to the east and 8.5 meters to the south. This bias presumably is related to the westward shift caused by erroneous specification of an incorrect geoid in 1997.
Figure 1--Cross-plot of yearly differences in X and Y UTM coordinates
of well locations.
The 1998 Quality Assurance program of random remeasurements was highly successful in the sense that no statistically significant sources of variation were detected in the QA data set. This confirms that steps taken in 1997 and 1998 to control the reliability of well measurements made by the KGS achieved their objective. Thirty-five wells were selected at random for remeasurement during the late January supplementary data collection period; of these 31 could be measured.
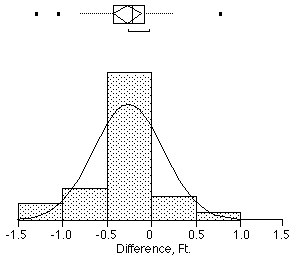
The remeasurements of two wells deviated significantly from the initial water level measurements of the same wells taken earlier in the month. The water level in the well located in 35S 31W 10AAC was 4.73 feet deeper upon remeasurement, and the well located in 24S 30W 33ADD was 2.16 feet shallower than earlier in the month. Differences in water levels in the remaining wells (Figure 2) of the QA data set are approximately normally distributed with a trimmed mean decrease in depth to water table of 0.25 feet, probably representing a continued return to equilibrium of the water table after pumping ceased at the end of the 1997 irrigation season. The trimmed standard deviation of the differences in water table elevation is 0.39 and can be taken as an estimate of the uncertainty in water table elevations measured in the 1998 field season.
Figure 2--Distribution of differences between 1998 original
measurements and quality assurance remeasurements of 29 randomly
selected wells. Two wells with extreme differences have been deleted.
Fitted curve is a normal distribution with the same mean and standard
deviation as the histogram.
Analyses of variance using the difference between initial 1998 measurements and 1998 QA remeasurements as the dependent variable fail to disclose any significant contributions from the exogenous variables recorded. There are no significant operator effects, and no systematic contributions from quality of well access, quality of downhole access, or quality of the chalk cut. The aquifer being measured did not contribute significantly to the differences noted, nor did well use. The presence of oil on the water could contribute as much as 0.8 foot difference between the pairs of readings, but this relationship is inconsistent and not statistically significant.
The Quality Control program has achieved its objectives of identifying and quantifying sources of unwanted variation in observation well data collection, and in flagging wells whose measurements required verification. It detected numerous spurious values, both in the measured data and in the historical data, resulting in a much "cleaner" data base than otherwise would have been the case. As the Quality Control process is routinely applied to KGS observation well measurements in the future, and particularly if it is applied to the entire Kansas observation well network, the quality of the data will be progressively improved with time.
References
Miller, R.D., J. Davis, and R.A. Olea, 1997, Acquisition activity, statistical quality control, and spatial quality control for 1997 annual water level data acquired by the Kansas Geological Survey: Kansas Geological Survey Open-file Report 97-33.
Prev Page--Acquisition Activity || Next Page--Spatial Quality Control