Study Area
The study area was selected as the Arkansas River corridor from the Colorado-Kansas state line through Hamilton, Kearny, Finney, Gray, and Ford counties (Figure 1). The area includes the Intensive Groundwater Use Control Area (IGUCA) (Figure 2) of the upper Arkansas River valley, the ditch irrigation area of Hamilton, Kearny, and Finney counties (Figure 3), and a buffer zone outside of these two areas that will allow determination of the transition from saline water in the river valley to freshwater in the High Plains aquifer. The study area lies within the High Plains region of the Great Plains physiographic province. North of the Arkansas River floodplain the upland surface is nearly level and is covered by loess. Sand dunes are the dominant topographic features south of the Arkansas River floodplain and the topography can be described as rolling, hummocky, or undulating depending on the thickness of the dune sand and the complexity of the dunes.
Figure 1--Location of the area of the Upper Arkansas River Corridor Study within the 5-county region. The study area is shaded.

Figure 2--Intensive Groundwater Use Control Area (IGUCA) along the Arkansas River in the study area.
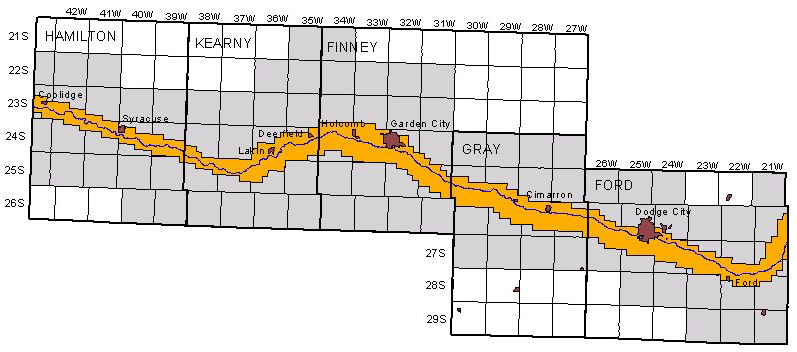
Figure 3--Ditch irrigation service areas.

The largest cities along the upper Arkansas River corridor in southwest Kansas are Garden City in Finney County and Dodge City in Ford County. Other cities and towns in the river corridor from west to east are Coolidge, Syracuse, and Kendall in Hamilton County, Lakin and Deerfield in Kearny County, Holcomb and Pierceville in Finney County, Charleston and Cimarron in Gray County, and Fort Dodge and Ford in Ford County.
Climate
The climate of the upper Arkansas River along the upper Arkansas River in Kansas is semi-arid to subhumid. The mean annual temperature at Garden City is 53.6 °F (average of values for 1961-1990 at the KSU Experiment Station about one mile east of the city and the airport about 7 miles east-southeast of the city), the mean January temperature is 28.3 °F, and the mean July temperature is 80.1 °F.
The mean annual precipitation increases from less than 16 inches at the Colorado-Kansas state line to about 24 inches in eastern Ford County; the mean annual values for 1961-1990 are 15.8 inches at Syracuse, 17.1 inches at Lakin, 17.9 inches at the KSU Experiment Station east of Garden City, 19.4 inches at the airport east-southeast of Garden City, 22.9 inches at Cimarron, and 21.5 inches at the airport 2 miles east of Dodge City. The precipitation is generally lowest in the winter and highest in the months of May-July (0.35 inches in January to about 3.0 inches in May and June at Garden City). The precipitation has ranged substantially from year to year. The mean annual minima during 1961-1990 were 10.1 inches in Syracuse, 9.6 inches at Lakin, 11.4 inches and 10.3 inches at the KSU Experiment Station and the airport, respectively, near Garden City, 12.4 inches at Cimarron, and 12.3 inches at Dodge City. The mean annual maxima during 1961-1990 were 27.2 inches in Syracuse, 27.4 inches at Lakin, 27.7 inches and 30.8 inches at the KSU Experiment Station and the airport, respectively, near Garden City, 33.9 inches at Cimarron, and 32.4 inches at Dodge City.
The mean annual rate of potential evapotranspiration is high; mean annual values are approximately 28 to 30 inches across the study area. The mean potential evapotranspiration exceeds the mean precipitation by over 10 inches annually near the Colorado-Kansas border and by about 7 inches in eastern Ford County.
Soils
The Natural Resources Conservation Service (NRCS) (formerly the Soil Conservation Service) has published soil surveys for all of the 5 counties within the study area. The NRCS has also digitized data and boundaries for all soil associations in Kansas. There are 35 soil associations within the Hamilton, Kearny, Finney, Gray, and Ford counties region. The associations are named according to the three soil series comprising the greatest acreages within each association, for example, Spearville-Harney-Richfield.
A colored map for the soil associations in the 5-county region encompassing the study area was prepared at a scale of 1:500,000 using ArcView (Figure 4). The soil associations were ordered according to generally increasing permeability based on increasing sand and decreasing clay content. The association order was used for grouping associations with similar textures. The association groups include silty clay loams to silt loams, clay loams to loamy sands, silt loams to silty clay loams, silt loams, silt loams to fine sandy loams, find sandy loams to silty loams, and loamy fine sands to fine sands, in order or increasing permeability. The groups and textures within groups were used to select the color schemes for the ArcView map. The same color was used for different associations with the same textures for the three main soil series in an association. The soil associations are numbered on the map and the table below the map explains each association composition in terms of the soil units and textures.
Figure 4--Surface soils classified by texture in the Upper Arkansas River Corridor Study Area.
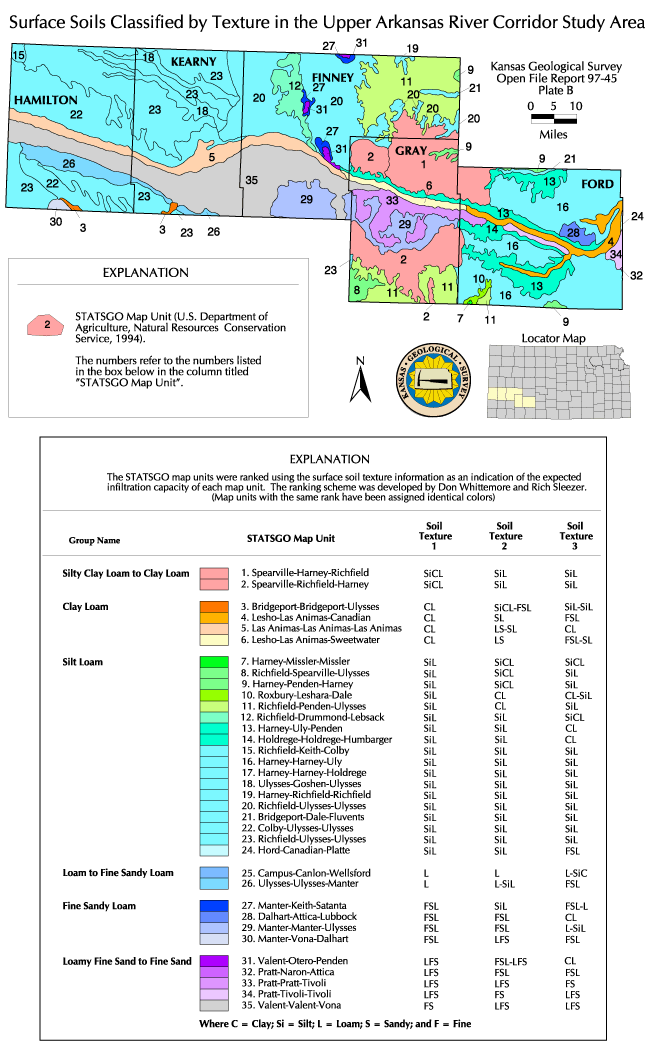
Figure 4 was constructed using the STATSGO database. STATSGO is a digital soils map and database developed by the Natural Resource Conservation Service as a part of the National Cooperative Soil Survey. The STATSGO soil maps are compiled by generalizing more detailed soil survey maps that were originally constructed at scales of 1:24,000 or 1:20,000. Map unit composition for a STATSGO map is determined by transecting or sampling areas on more detailed maps and expanding the data statistically to characterize the whole map unit. The map data are compiled in 1-by 2-degree topographic quadrangle units and merged and distributed as statewide coverages. The soil map units are linked to attributes in the Map Unit Interpretations Record relational database that gives the proportionate extent of the component soils and their properties for each soil map unit.
Soil map units for the 5 county area being studied were grouped based on the surface soil texture of the three most prevalent soil series within each STATSGO soil map unit. The STATSGO map units were then ranked using the surface soil texture information as an indication of the expected infiltration capacity of each map unit. The principal assumption was that soils with fine textured surface horizons (i.e. clay, silty clay, etc.) would have slower infiltration rates than soils with coarse textured surface horizons (i.e. sand, loamy sand, loamy fine sand, etc.).
The spatial patterns of STATSGO map units in and near the Arkansas River valley are largely a function of the spatial patterns of soil parent material in this region. For this reason, there are many similarities between the STATSGO map and the surface geology map (Figure 5). Most of the soils within the study area have formed in three parent materials: loess, alluvium, and eolian sand (dune sand). Loessial soils such as the Spearville, Harney, Richfield, and Ulysses soils are found on uplands above the Arkansas River Valley. Alluvial soils such as the Bridgeport, Lesho, Las Animas, Canadian, and Sweetwater are found adjacent to the Arkansas River and its tributaries. Soils formed in eolian sand such as the Attica, Pratt, Tivoli, and Valent series are found in the Arkansas River valley on the south side of the river. Soils formed in loess have surface textures of silty clay loam or silt loam and have slow to moderately slow infiltration rates. Soils formed in alluvium have a wide range of surface textures from clay loam to loamy sand and infiltration rates vary from slow to rapid. Soils formed in eolian sands have surface textures of fine sandy loam to fine sand and infiltration rates are moderately rapid to very rapid.
Geology
The surficial geology of the river corridor is primarily Pleistocene sediments ranging from clay, silt, sand, and gravel in alluvial deposits along the Arkansas River valley to loess and dune sand in the upland (Figure 5). The source database for the surficial geology map is an Arc/Info implementation of the 1:500,000 scale Geology Map of Kansas, M-23, 1991. The data for Map M-23 was digitized from an original paper copy publication of the Geology Map of Kansas, Map M-1, 1964. That map incorporated a 1:500,000 scale, USGS base map.
Figure 5--Surface geology in the Upper Arkansas River Corridor Study Area.

The alluvial deposits of the Arkansas River valley include recent alluvium underlying the floodplain that is about 2- to 4-miles wide from Hamilton County to Ford County. A thin band of alluvial terrace deposits extends along much of the north and south boundaries of the floodplain from Kearny County to Ford County. A trough of alluvial deposits underlies the dune sand south of the Arkansas River in Hamilton County and southwest Kearny County. The High Plains aquifer underlies most of the study area east of the Bear Creek fault zone. The northern part of the Crooked Creek-Fowler Fault crosses the Arkansas River in eastern Ford County. The High Plains aquifer thins on the east side of the fault. Most of the bedrock underlying the High Plains aquifer or surface loess in the study area is either Upper Cretaceous shales and chalks or Lower Cretaceous shales and sandstones.
The dune sand is primarily located in a 2- to 18-mile band along the south side of the river valley. A thin strip of Cretaceous shales and limestones outcrop along the northern valley wall of the Arkansas River in Hamilton and western Kearny counties. Some exposures of the Tertiary Ogallala Formation occur just north of portions of the bedrock strip. There are relatively small outcrops of the Ogallala Formation (Tertiary) as well as the Cretaceous Niobrara Chalk, Carlile Shale, Greenhorn Limestone and Dakota Formation.
Spatial patterns of surficial geology are very similar to those seen in the STATSGO soils map (Figure 4). The surficial geology of the study area can be used in conjunction with the soils and water rights maps to help interpret land use patterns and to delineate the boundaries of the Quaternary alluvial aquifer within the study area. The area of post-Kansan alluvial deposits constitutes the approximate area of the modern Arkansas River floodplain. The Kansan and older Quaternary alluvial sediments occur as terraces at somewhat higher elevations relative to the modern floodplain of the river.
The Bear Creek and Crooked Creek-Fowler fault zones are solution subsidence features in the bedrock that allowed greater depths of High Plains aquifer sediments to be deposited in the subsidence area. They are not faults that cut through the sediments after they were completely deposited, although continued differential subsidence has created local depressions that appear as shallow sinks such as in western Kearny County. Very slow moving ground water dissolved evaporite beds of halite (rock salt) and anhydrite in Permian strata underlying the Cretaceous bedrock. The subsidence occurred as the saltwater slowly moved downgradient primarily in the Permian strata.
Details of the geology of the High Plains aquifer are described in the text and displayed in the figures in the section on Hydrogeology of Aquifers in this web site.
Surface Water
The Arkansas River is the main surface water in the river corridor. The river channel is nearly 160 miles long from the Colorado-Kansas border to the eastern boundary of Ford County. There are no substantial tributaries to the Arkansas River from Hamilton County eastward to the middle of Ford County. Mulberry Creek joins the Arkansas River in eastern Ford County near the town of Ford. The only substantial body of surface water is Lake McKinney north of the Arkansas River in eastern Kearny County. The lake is an artificial body created in the early 1900's to store diverted river water. The original lake was larger than it is now; the present surface area is about one square mile.
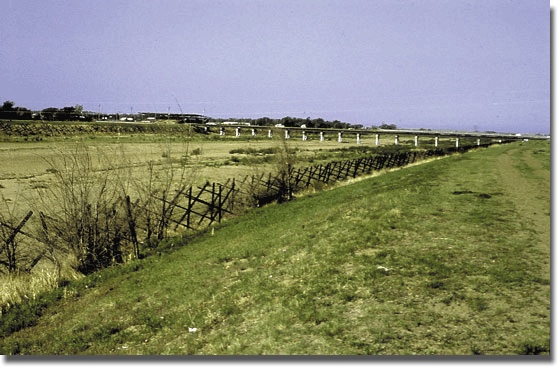
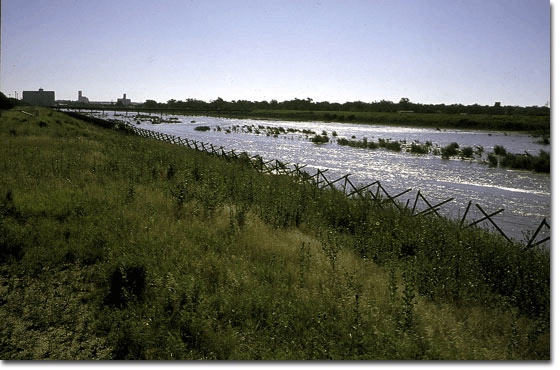
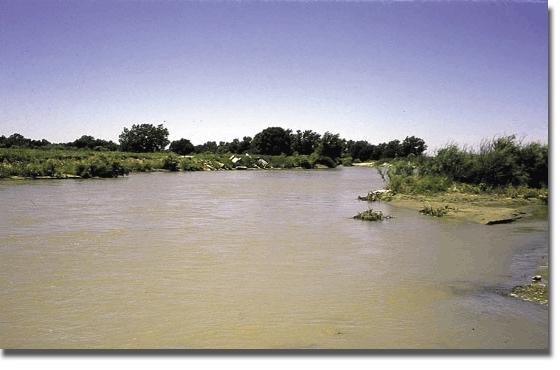
During many years of the last three decades, the river ceases to flow between Garden City and Dodge City because irrigation diversions and seepage into the underlying aquifers reduces flow. For example, a photograph taken in 1995 (Picture 1) shows the broad expanse of the dry riverbed at Dodge City. During years with large snow melt from the Rocky Mountains and above average precipitation in eastern Colorado, high river flows can fill the river channel such as at the same location in Dodge City (Picture 2) and at Garden City (Picture 3) in 1995.
Picture 1--Dry riverbed at Dodge City.
Picture 2--High river flow at Dodge City.
Picture 3--High river flow at Garden City.
There are currently 5 stations maintained by the U.S. Geological Survey that gage Arkansas River flow; these stations are located near Coolidge, at Syracuse, Deerfield, Garden City, and Dodge City. There is also a gaging station at the beginning of the Frontier Ditch near Coolidge. Table 1 gives information on these stations and available data, as well as other stations at which discharge has been measured within the last 20 years. Data is available from the Water Resources Division of the USGS in Lawrence and on the Internet (http://ks.water.usgs.gov/) for all stations except Deerfield. Information on Arkansas River can also be obtained from the Kansas-Colorado Arkansas River Compact web page of the Division of Water Resources, Kansas Department of Agriculture. Flow data for the Arkansas River in Colorado can be found from the Colorado District of the USGS https://waterdata.usgs.gov/co/nwis/rt or from the Division of Water Resources page on the Arkansas River.
Table 1--Characteristics of federal gaging stations with flow records during some period within the last 20 years in the Arkansas River corridor study area.
| Station name | Station number | Legal location | River mile | Period of record |
|---|---|---|---|---|
| Frontier Ditch near Coolidge | 07137000 | 23S-43W-21ADC | - | Oct 1950 - present |
| Arkansas River near Coolidge | 07137500 | 23S-43W-26BAB | 1099.3 | May 1903 - Oct 1903 Mar 1921 - May 1921 Oct 1950 - present |
| Arkansas River at Syracuse | 07138000 | 24S-40W-18BDB | 1080.9 | Aug 1902 - Sep 1906 Oct 1920 - present |
| Arkansas River at Kendall | 07138020 | 24S-39W-25DCC | 1066.7 | Apr 1979 - Sep 1982 |
| Arkansas River below Amazon diversion | 07138062 | 25S-38W-12BBB | 1059.7 | Apr 1977 - Sep 1982 |
| Arkansas River at Lakin | 07138065 | 24S-36W-34ADB | 1044.9 | Apr 1978 - Sep 1982 |
| Arkansas River at Deerfield | 07138070 | 24S-35W-14ACB | 1,039.8 | Oct 1998 - present |
| Arkansas River at Garden City | 07139000 | 24S-32W-19BDB | 1024.2 | Jun 1922 - Jun 1970 Oct 1986 - presenta |
| Arkansas River at Dodge City | 07139500 | 26S-25W-35BCC | 970.9 | Oct 1902 - Sep 1906 Sep 1944 - presentb |
| Mulberry Creek near Dodge City | 07139800 | 28S-25W-24B | - | Mar 1968 - Sep 1990 |
a July 1970 to September 1986, flood hydrograph record.
b Gage-height records collected at same site at different datum 1909-1932 are contained in reports of U.S. Weather Bureau.
The water in the Arkansas River is saline in both low and high flows. The water is of sodium-sulfate type. The salinity of the river water entering Kansas derives from substantial concentration of natural sources of dissolved solids in the river water and alluvial ground waters by consumptive loss of water to evapotranspiration in Colorado. The section on Arkansas River Water Quality in this web site contains extensive descriptive text and data for the spatial and temporal variations in the water chemistry of the Arkansas River.
Ground Water
The main aquifers of the study area are the High Plains aquifer, the alluvium of the Arkansas River valley, and the Dakota aquifer. The unconsolidated sediments of the High Plains and alluvial aquifers yield substantial quantities of water to wells screened in the sand and gravel units. A wide range of information on many aspects of the High Plains aquifer are available on the Kansas Geological web pages for the High Plains Aquifer Evaluation Project (http://www.kgs.ku.edu/HighPlains/index.html), another Kansas Water Plan study. The web pages include an atlas of the High Plains aquifer in Kansas (http://www.kgs.ku.edu/HighPlains/HPA_Atlas/index.html). The atlas includes descriptive text and maps of saturated thickness, recharge, water storage and availability, regional water-quality provinces, water use, and estimated usable lifetime, among other items.
The Dakota aquifer underlies the High Plains aquifer, the trough of alluvial sediments in Hamilton County and western Kearny County, and the upper Cretaceous shales and limestones in the study area. The sandstone layers in the upper portion of the Dakota aquifer yield freshwaters throughout the upper Arkansas River corridor, although the rate of yield is substantially less than the highly-permeable sediments of the High Plains aquifer. The amount of sandstone is less than the amount of shale and the distribution of sandy units is highly variable in the Dakota. Thus, the yield of wells in the Dakota aquifer ranges appreciably in the study area. The Kansas Geological Survey has a web site for the Dakota Aquifer Program, an earlier Kansas Water Plan project (http://www.kgs.ku.edu/Dakota/vol1/index.html).
Information on water levels in the High Plains and alluvial aquifers is provided in the Ground-Water Levels section of this web site on the Upper Arkansas River Corridor Study. Additional material on the lithology of the aquifers is provided in the Hydrogeology of Aquifers section in this web site.
Land Use
The predominant land use in the Arkansas River corridor is agricultural. Much of the land is in irrigated cropland. Other agricultural uses are dryland farming, rangeland, and feedlots. The major crops are corn, grain sorghum, alfalfa, and wheat. Urban land use is primarily in the largest cities of Garden City and Dodge City. Roads and railroads comprise a substantial portion of the land not in cropland and rangeland. Industrial land uses in the corridor include companies processing agricultural products, oil and gas wells and facilities associated with petroleum production and distribution, and electrical energy production.
The distribution of land use is shown in Figure 6 based on a land cover database that depicts 10 general land cover classes for the State of Kansas. The database was compiled from a digital classification of Landsat Thematic Mapper (TM) imagery by the Kansas Applied Remote Sensing (KARS) Program. These data are suited for county-level and watershed-level analyses that involve land use and land cover.
Figure 6--Land cover classification in the Upper Arkansas River Corridor Study Area.
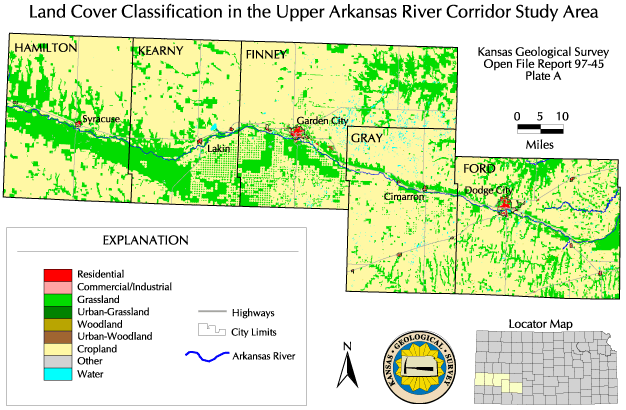
The land cover classifications shown in the map of the 5-county region are residential, commercial and industrial, grassland, urban grassland, woodland, urban woodland, cropland, water, and other. In terms of acreage, cropland and grassland are the dominant land uses within the study area. The term cropland is generic and refers to all land that is used to grow agricultural crops. A distinction can be made between the two major categories of cropland (dryland and irrigated) by comparing Figure 6 with Figure 7 (described in the Water Use part of this section) which shows the locations of water rights within the study area. A large supply of good quality water is required for effective irrigation. Cropland is generally irrigated except where the quantity and/or quality of ground water limits or precludes its use for irrigation. Where the predominant land use is cropland and there are dense clusters of water rights, a large percentage of croplands are being irrigated. Examples of this can be seen in eastern Kearny, western Finney, and much of Gray County. Where cropland is predominant and water rights are sparse or non-existent, dryland-farming techniques are being used to grow crops. The best examples of this are found in much of northern and southern Hamilton and northwestern Kearny counties.
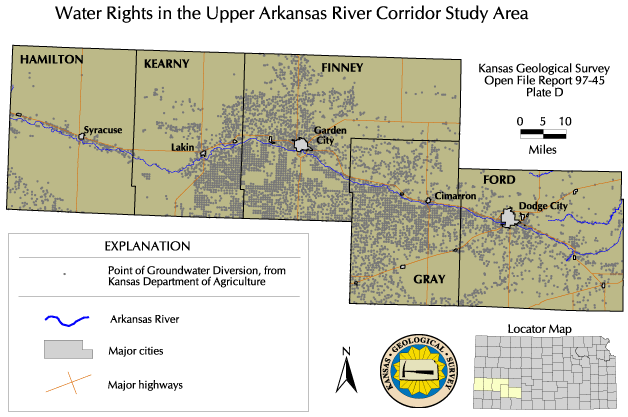
Figure 7--Water rights in the Upper Arkansas River Corridor Study Area.
The largest areas of grasslands are those in which the topography restricts land use, where the soils are too sandy to be used effectively for cropland, or where there is an insufficient quantity of good quality ground water for irrigation. The large area of grassland to the south of the Arkansas River in Hamilton and southwestern Kearny Counties is a good example of a location where the soils, topography, and limited availability of ground water all serve to restrict land use. This belt of grassland coincides with the belt of sand dunes shown in Figure 5. Early irrigation development in the 5-county region was primarily on flat ground where water diverted from the Arkansas River or pumped from wells could be used in flood irrigation. Later use of center pivot systems supplied with water from wells allowed development of irrigated cropland on the sand dunes overlying the High Plains aquifer as well as additional irrigation on uplands where the water table is much deeper. Two large areas of grassland remain in Finney County south of the Arkansas River. This land use is a result of restrictions for crops related to topography and sandy soils and use for non-crop purposes such as residences and a game refuge.
Part of the sand dune area in southeastern Kearny and southern Finney counties appears as a grid-like pattern of small cusped diamonds of green for grassland within the yellow representing cropland. Each green diamond represents the area left in grassland between 4 adjoining fields irrigated by center pivots. The circular fields irrigated by the center pivots are usually within a quarter section. Thus, the diamond-shaped grasslands remaining occur as a grid with a half-mile spacing. This pattern generally only occurs in the sand dunes. Dryland and irrigated croplands in relatively flat-lying regions with suitable soils cover essentially all of the field area with no substantial grassland remaining.
There are an unusually large number of small bodies of water indicated on the land cover map in Finney, Gray, and Ford counties. The land cover classification was performed using a satellite image that was taken shortly after an extended period of unusually high rainfall. The land cover imagery was collected on July 1, 1989. Weather stations in the region recorded total rainfall averaging nearly 9 inches from June 1 to July 1, an exceptionally large percentage of the mean annual rainfall of approximately 19 to 20 inches. Most of the small bodies of water indicated on the land cover map represent small closed depressions in areas with slowly permeable soils (clayey to silty, Plate B). During periods of heavy rainfall these depressions can fill with water and remain flooded for short periods.
Large amounts of both Arkansas River water and ground water are used for irrigation. The river water is diverted primarily in 6 canal systems, 5 of which are in Kearny and Finney counties. Most irrigation wells draw from the High Plains and alluvial aquifers, although some wells are completed in both the High Plains and Dakota aquifers and a few wells pump water only from the Dakota aquifer. Municipal, industrial, stock, and domestic wells use ground water. Most of these wells also obtain their supply from the High Plains aquifer. Except for the area of the alluvial sediments underlying the dune sand south of the Arkansas River floodplain in Hamilton County and western Kearny County, few alluvial aquifer wells are used for non-irrigation purposes due to water-quality limitations. Some non-irrigation wells pump from the Dakota aquifer.
Irrigation ditches
There were 8 irrigation ditches or canals diverting water from the Arkansas River prior to 1966 (Balsters and Anderson, 1979). The ditches were started in the early to mid 1880s (Sherow, 1990). Use of the ditches varied greatly during the late 1800s because of poor maintenance, flooding that destroyed headgates, and mismanagement related to inexperience and financial difficulties. Introduction of sugar beet growing to the area after 1900 resulted in a revitalization of the ditches. However, damage from floods and maintenance and management problems continued to make operations difficult. In the early 1900s, pumping of ground water into the ditches started which made water supplies more reliable for irrigation. The joint use of water diverted from the Arkansas River and well water for irrigation in the areas served by the ditches continues today. The locations of the main canals and ditches are marked on USGS 7.5-minute topographic quadrangles.
The Frontier Ditch is currently operable and diverts water from the drainage of Cheyenne Creek about 0.3 mile west or from the Arkansas River approximately 3 miles west of the Colorado-Kansas border. The Holly Drain in eastern Colorado conveys irrigation return flow to the Cheyenne Creek drainage that forms part of the water that flows into the Frontier Ditch. The source of water in the Frontier Ditch at a given time depends on the flow in the Cheyenne Creek drainage from Colorado return flows or precipitation runoff; when these are low, a greater proportion of Arkansas River water is used. Water from the ditch is used to irrigate cropland overlying the floodplain and terraces along the north side of the river in Kansas for about 6 miles to the east of its headgate. The USGS maintains a gaging station on Frontier Ditch within Kansas just 0.3 miles from the Colorado-Kansas border.
The Alamo and Fort Aubrey canals formerly diverted water from the river several miles west of Syracuse and carried water for irrigation along the northern side of the river to several miles east-southeast of Syracuse. The Alamo Canal was abandoned in 1974 (Sherow, 1990). Part of the water rights of the Fort Aubrey Canal has been transferred to the Frontier Ditch (M. Rude, personal communication).
Most of the ditches in Kansas serve eastern Kearny County and the area to the west and northwest of Garden City (Figure 3). The Amazon Ditch currently diverts the largest quantity of water from the Arkansas River in Kansas. The headgate of the Amazon Ditch is in central Kearny County; the canal extends in a northeast direction before irrigating cropland north of Deerfield and into westernmost Finney County. Water from the Amazon Ditch also serves the Great Eastern Ditch. The Great Eastern headgate first diverted water from the Arkansas River in 1882 (Sherow, 1990). Altercation among developers resulted in construction of the Amazon Ditch, with a headgate upstream of the headgate of the Great Eastern Ditch. In 1955, the operators of the Great Eastern and Amazon ditches entered into an agreement to jointly operate (M. Rude, personal communication). The Amazon Ditch was widened to accommodate increased flow to allow it to serve the irrigation areas for both ditch systems. Water is diverted from the Amazon Ditch into Lake McKinney to the northeast of Lakin. The Great Eastern Ditch system now obtains its water from Lake McKinney and irrigates land in western Finney County to the northwest of Garden City. The portion of the Great Eastern canal between Lake McKinney and the original headgate on the Arkansas River has been abandoned.
The South Side Ditch diverts water from the southern bank of the Arkansas River about 3 miles downstream of the Amazon Ditch headgate; the headgate formerly operated in conjunction with that of original headgate of the Great Eastern Ditch. South Side Ditch water irrigates land along its extent before ending near the Kearny-Finney counties line. There generally has been some diversion into the ditch system each year but the amount of water has substantially decreased in the last 10 years. Part of the decrease has resulted from conversion of about half of the irrigable land in the system to the Conservation Reserve Program. The ditch did not divert water during the highest flow of the summer of 1995, but diverted at the end of the high flow about the beginning of August (M. Rude, personal communication). The return flow from the South Side Ditch enters the Arkansas River near Deerfield.
The headgate of the Farmers' Ditch is a couple miles east of Deerfield. The headgate of the Garden City Ditch was originally about a mile farther downstream. Both ditch systems later entered into a cooperative arrangement involving the use of the headgates of the Farmers Ditch as the diversion from the Arkansas River. Water for the Garden City Ditch is now diverted from the Farmers Ditch near the Kearny-Finney counties line. These ditches carry water to irrigate land to the west and northwest of Garden City. The irrigation area of the Garden City Ditch appears to have formerly included cropland that has now been converted to other uses in western Garden City. The amount of water available for use in recent years has been variable due to the relatively small flow in the river.
Flow data for the Kearny and Finney counties ditches are not as readily available as the federally maintained gaging stations on the Arkansas River and Frontier Ditch. There are some USGS discharge measurements on the Great Eastern Canal diversion near Lakin during a limited period for research studies. The Division of Water Resources collects flow data at some locations and the irrigation companies measure flow at additional locations as a part of their management.
Ground water use
All irrigation, municipal, industrial, and larger stock wells require water rights. Thus, the distribution of water right locations illustrates the intensity of ground-water use. Figure 7 shows these locations within the 5-counties of the study area. The source of the data for the figure is the Water Information Management and Analysis System (WIMAS) of the Division of Water Resources, Kansas Department of Agriculture. WIMAS provides for visualizing and summarizing water-appropriations and water-use information contained in the Water Resources Information System (WRIS) of the DWR. It provides an overview of all the water rights and pertinent hydrologic information in an area that is available from no other source. The WRIS is the original source database maintained by the DWR for water appropriation and water use information in their mission to manage water appropriations in the State of Kansas. WIMAS consists of a set of Arc Macro Language scripts used with the Arc/Info GIS and a coverage developed from the WRIS database. It also includes numerous other coverages such as land survey lines, roads, and streams to be used in visually relating the water resources information.
The distribution of the water rights in the study area generally indicates the presence of sufficient saturated thickness in the High Plains and alluvial aquifers for large capacity pumping from wells. Some of the rights represent water appropriated for ditch diversions from the Arkansas River used in flood irrigation. Several water rights indicate wells obtaining water from the Dakota aquifer. Most of the wells with water rights are used for irrigation, although some of the wells supply water for public supplies, industry, and stockyards. Areas with few or no water rights generally represent the absence of the High Plains or alluvial aquifers, or saturated thicknesses that are insufficient for large capacity pumping.
The band of points along the Arkansas River valley in Hamilton County primarily indicates wells drawing water from the alluvial aquifer. The High Plains aquifer is either not present or contains insufficient saturated thickness to supply substantial quantities of water to the north and south of the river valley in Hamilton County. Many of the points in Kearny, Finney, Gray, and Ford counties are arranged in a grid-like pattern. These points usually represent more recent wells installed for center pivot irrigation. As most fields irrigated by center pivots occupy a circle within a quarter section, the distance between the grid-like points is approximately a half-mile. The grid pattern is especially prominent through the area of sand dunes south of the Arkansas River in southeastern Kearny, southern Finney, and central Gray counties. These areas represent wells installed for center pivot irrigation more recently than the older rights for flood irrigation. The points in the grid pattern correlate with the land cover pattern of cropland circles and small grassland diamonds in the same areas in Figure 6.
Large increases in ground-water withdrawals from pumping wells began in the 1950's. The consumptive use caused general decreases in subsurface water levels in large areas of southwest Kansas, including those adjacent to the Arkansas River. The Division of Water Resources declared a moratorium on application permits for water appropriations in 1977 along the Arkansas River corridor in southwestern Kansas due to the concern of coupled ground-water table declines and decreasing streamflows. The U.S. Geological Survey investigated the relationships, including simulation with computer models, and published the results in the early- to mid-1980's. In 1986, the Division of Water Resources established an Intensive Groundwater Use Control Area (IGUCA) along the Arkansas River valley from the Colorado state line to the Ford-Edwards county line east of Dodge City (Figure 2).