DATE: May 1 , 2001
Create as much space as needed within the form.
Geographic Zones Selected (leave blank if done by range):
Geographic Range Selected (leave blank if done by zones):
Cell types selected from database (Terrestrial, Coastal, OceanicI, OceanicII, OceanicIII):
Variables and ranges selected from database (if filtered – if not filtered, no entry is needed):
WINDSPEED_ANN_AVG >3 m/s
MAX_G30VALUE >1800 m
Variables added (if any):
What do you expect to get out of clustering these variables or what are you trying to achieve?
The question We are addressing is ¿ what are the variables that can be used to differentiate a coastal region where a very productive coastal lagoon is located in the Caribbean Sea?
Following are the figures/cluster results:
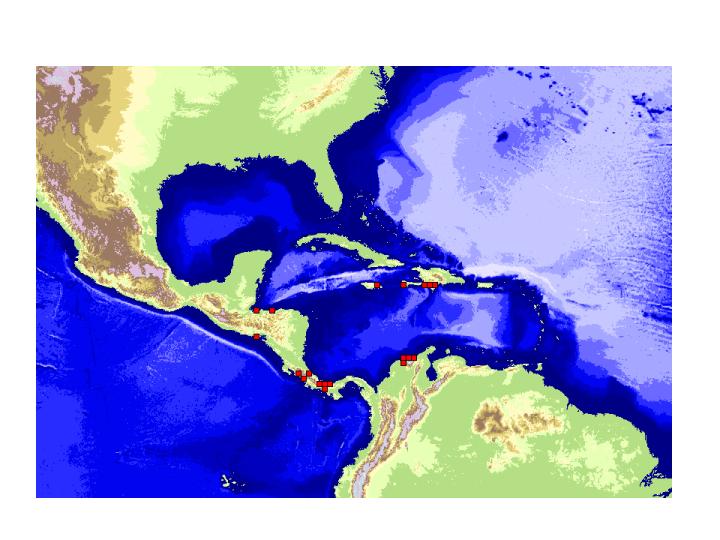
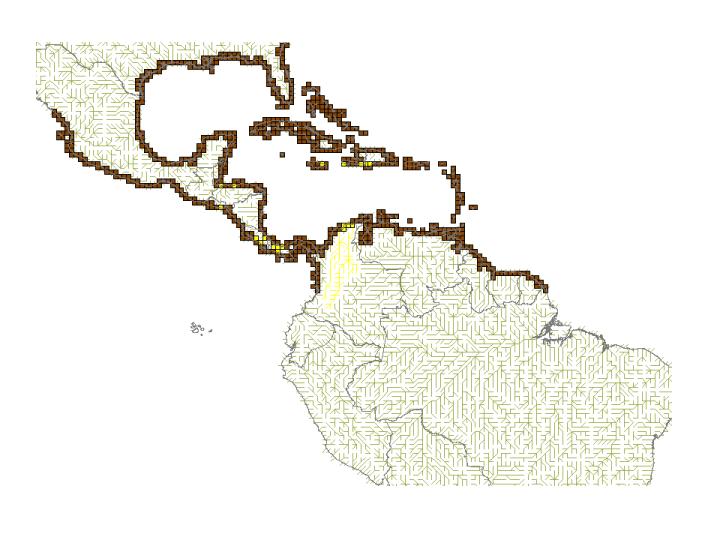
Figures Exp4_elevation.jpeg and Exp4_selectedpoints.jpeg shows the location of cells analyzed in the Caribbean region and resulting cells from the analysis,respectively.
Save the Cluster summary – if will contain much of the
information needed!
(Instructions for summary and data saving are at the end of this document)
Cluster Run Number:_3_
Variables selected in cluster (include any weights if not
set at 1):
WINDSPEED_ANN_AVG >3 m/s
MAX_G30VALUE >1800 m
Number of Clusters: 3
Distance Method: [ X ]Average [ ]Maximum
COMMENTS OR DESCRIPTION ON CLUSTER OUTPUT:
We were able to differentiate the target area (Cienaga
Grande de Santa Marta (CGSM)—Sierra Nevada de Santa Marta (SNSM) Altitude: 5800
m)) (see below). However it was
difficult to include a hydrological variable to better describe the influence
of the Magadalena River. This river is the largest in extension and the only
major river discharging into the
Caribbean Sea. When we included the variable “Runoff, annual mean (mm/yr)” the
elevation “influence” in the cluster analysis was lost because the cell that
represents the Magdalena river mouth has an elevation <1800 m. Cells below
this criteria were filtered out.
The three cluster obtained were:
Cluster 0: high MAX_G30VALUE
Cluster 1: high WINDSPEED_ANN_AVG, low MAX_G30VALUE
Cluster 2: low WINDSPEED_ANN_AVG, low_G30VALUE
The archetype point describing the cluster for the 4
cells around the
Cluster 0 characterized the altitude component, and the cells
where the CGSM and SNSM were located had the closest value to the archetype
point.
Cluster 1 and 2 described cells located in Honduras, Salvador, Costa Rica and Panama
where the average altitude was <3800 m.
The wind velocity in this region is strongly related to hurricanes and
the cluster archetype point parameters reflect this variable.
Additional comments on problems or improvements needed:
We suggest to implement an easy way to explore the information displayed in the cluster summary figure. In this experiment the number of points displayed were few, and it was difficult to determine what was the “name/propierties” and location of a particular cell. The difficulty is compounded by the fact that the actual “coastlines” are not shown in the cluster summary (image). To evaluate the spatial distribution of the selected cells by the cluster analysis, it is necessary to have an extra map available to determine the proper location to estimate lat /long data.
It will be really helpful to have “on line” at least part
of the information characterizing each cell selected by the cluster analysis to
assess the results.
We also suggest to include in the variable selection
window, filter mode, a statement
explaining if the variables selected for filtering will be OUT or IN the
analyses.
**************************************************************************************