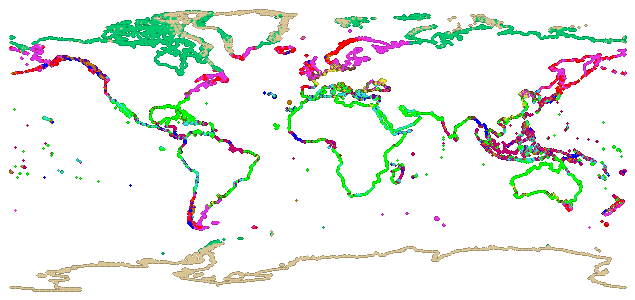
Cluster Summary
|
| Cluster #0 |
Cluster #1 |
Cluster #2 |
Cluster #3 |
| Cluster #4 |
Cluster #5 |
Cluster #6 |
Cluster #7 |
| Cluster #8 |
Cluster #9 |
Cluster #10 |
Cluster #11 |
Cluster: |
Cluster 0: low Sst_mean_monthly, high
Frozen, low Cell_percnt_cropland |
Cluster 1: high Sst_mean_monthly, low
Stddev_g30value, low Runoff_total_ann |
Cluster 2: high Runoff_total_ann, low
Stddev_g30value |
| |
Value |
Std Dev |
% Populated |
Value |
Std Dev |
% Populated |
Value |
Std Dev |
% Populated |
| Archetype Point: |
205898 |
-- |
-- |
166986 |
-- |
-- |
76630 |
-- |
-- |
| Points Per Cluster: |
886(6%) |
-- |
-- |
2306(15%) |
-- |
-- |
415(3%) |
-- |
-- |
| Sst_mean_monthly: |
7.71974 |
3.88768 |
100 |
24.6138 |
4.02248 |
100 |
20.0993 |
8.95932 |
100 |
| Frozen: |
1 |
0 |
100 |
1 |
0 |
100 |
1 |
0 |
100 |
| Cell_percnt_cropland: |
0.394375 |
1.46077 |
100 |
1.32407 |
2.63105 |
100 |
0.983614 |
2.50805 |
100 |
| Runoff_total_ann: |
838.04 |
403.121 |
92.1 |
185.073 |
226.112 |
91.5 |
2758.04 |
720.628 |
89.4 |
| Stddev_g30value: |
177.351 |
66.2893 |
95.4 |
39.4824 |
40.1165 |
98.1 |
118.526 |
79.718 |
97.6 |
| Cluster: |
Cluster 3: high Cell_percnt_cropland
|
Cluster 4: low Stddev_g30value, high
Frozen, low Cell_percnt_cropland |
Cluster 5: high Sst_mean_monthly, medium
Stddev_g30value, low Runoff_total_ann |
| |
Value |
Std Dev |
% Populated |
Value |
Std Dev |
% Populated |
Value |
Std Dev |
% Populated |
| Archetype Point: |
61635 |
-- |
-- |
51155 |
-- |
-- |
165335 |
-- |
-- |
| Points Per Cluster: |
201(1%) |
-- |
-- |
1636(11%) |
-- |
-- |
838(5%) |
-- |
-- |
| Sst_mean_monthly: |
16.1433 |
4.74332 |
100 |
6.31982 |
3.97339 |
100 |
23.8021 |
5.03883 |
100 |
| Frozen: |
1 |
0 |
100 |
1 |
0 |
100 |
1 |
0 |
100 |
| Cell_percnt_cropland: |
53.0304 |
12.4246 |
100 |
0.728983 |
2.00942 |
100 |
2.07599 |
3.43476 |
100 |
| Runoff_total_ann: |
210.398 |
325 |
100 |
382.657 |
261.957 |
91.1 |
327.231 |
329.403 |
89.9 |
| Stddev_g30value: |
59.8502 |
72.0254 |
100 |
49.851 |
40.3052 |
93.9 |
257.007 |
73.0689 |
98.9 |
| Cluster: |
Cluster 6: low Sst_mean_monthly, low
Frozen, low Cell_percnt_cropland |
Cluster 7: low Sst_mean_monthly, low
Frozen, low Cell_percnt_cropland |
Cluster 8: medium Stddev_g30value
|
| |
Value |
Std Dev |
% Populated |
Value |
Std Dev |
% Populated |
Value |
Std Dev |
% Populated |
| Archetype Point: |
18941 |
-- |
-- |
220563 |
-- |
-- |
82407 |
-- |
-- |
| Points Per Cluster: |
3504(23%) |
-- |
-- |
3182(21%) |
-- |
-- |
383(3%) |
-- |
-- |
| Sst_mean_monthly: |
-1.65724 |
0.415011 |
100 |
-1.35469 |
0.634494 |
100 |
19.0275 |
8.98828 |
100 |
| Frozen: |
0 |
0 |
100 |
0 |
0 |
100 |
1 |
0 |
100 |
| Cell_percnt_cropland: |
0 |
0 |
100 |
0 |
0 |
100 |
1.61038 |
3.62357 |
100 |
| Runoff_total_ann: |
163.926 |
140.953 |
28.4 |
112.098 |
121.008 |
87.7 |
1838.13 |
547.439 |
91.6 |
| Stddev_g30value: |
240.019 |
79.3469 |
19.8 |
46.3137 |
40.4207 |
85.3 |
348.159 |
89.2196 |
99.7 |
| Cluster: |
Cluster 9: high Stddev_g30value, low
Cell_percnt_cropland |
Cluster 10: high Sst_mean_monthly, low
Stddev_g30value, medium Runoff_total_ann |
Cluster 11: medium Cell_percnt_cropland,
low Runoff_total_ann, low Stddev_g30value |
| |
Value |
Std Dev |
% Populated |
Value |
Std Dev |
% Populated |
Value |
Std Dev |
% Populated |
| Archetype Point: |
76745 |
-- |
-- |
156235 |
-- |
-- |
75283 |
-- |
-- |
| Points Per Cluster: |
230(2%) |
-- |
-- |
1170(8%) |
-- |
-- |
527(3%) |
-- |
-- |
| Sst_mean_monthly: |
20.5758 |
7.80949 |
100 |
27.1804 |
3.57747 |
100 |
19.59 |
6.26007 |
100 |
| Frozen: |
0.995652 |
0.065938 |
100 |
1 |
0 |
100 |
1 |
0 |
100 |
| Cell_percnt_cropland: |
3.59804 |
5.91634 |
100 |
1.14194 |
2.41462 |
100 |
23.0358 |
7.24312 |
100 |
| Runoff_total_ann: |
794.924 |
581.352 |
97 |
1325.97 |
360.327 |
83.8 |
339.298 |
364.553 |
99.8 |
| Stddev_g30value: |
588.694 |
146.841 |
97.8 |
70.9468 |
57.737 |
97.3 |
83.8557 |
91.9506 |
100 |
| Entire Set |
|
Value |
Std Dev |
Min |
Max |
| Archetype Point: |
-- |
-- |
-- |
-- |
| Points Per Cluster: |
-- |
-- |
-- |
-- |
| Sst_mean_monthly: |
0.0119165 |
12.2242 |
-1.79 |
29.54 |
| Frozen: |
0.000654251 |
0.496102 |
0 |
1 |
| Cell_percnt_cropland: |
0.00575492 |
7.70211 |
0 |
90.7631 |
| Runoff_total_ann: |
0.798947 |
668.67 |
0 |
5822 |
| Stddev_g30value: |
0.17686 |
123.681 |
0 |
1113.84 |
Clustering Method
Segmentation Method: K-means
Distance Measure: Scaled
Random Seed:
510786092
Variables Used
| Variable |
Weight |
| Sst_mean_monthly |
1 |
| Frozen |
1 |
| Cell_percnt_cropland
|
1 |
| Runoff_total_ann |
1 |
| Stddev_g30value |
1 |
Wed May 2
18:19:23 2001