Region 17 - BRAZILIAN COAST
LOICZ Typology Workshop - Ensenada - May/2001
| Bastiaan Knoppers | Eduardo Marone | Eunice da Costa Machado |
Typology of the Brazilian Coastal Zone
Objectives
The objective of this exercise was to perform a first typological characterisation of the Brazilian coastal zone (Region 17) with the LOICZ approach and tools, and compare the results with the latest published physiographic/ oceanographic classification schemes.
Description of the Coastal Zone
The Brazilian coastline stretches from Cape
Orange in the north (Lat. 4° N and Long. 52° W ) to Chui in the south (Lat. 35° S, Long. 55° W). Estimates of its
length vary from 6500 to 9500 km depending on the scale of
measurement. The most common cited length is 7700 km. The
Brazilian coastal zone has been classified by geographical,
geomorphological, geological, climatic, hydrological and
sedimentological criteria. Figure 1 presents an overview of the
climate (humid vs. dry), the drainage pattern and the tidal range
(micro-, meso- and macrotides) along the coastal zone, the
extension of the shelf and the governing oceanic boundary
currents. Included are the four sections of the coast
distinguished by geological criteria and the five sections
distinguished by geographical criteria, the North, Northeast,
East, Southeast and South.
Figure 1
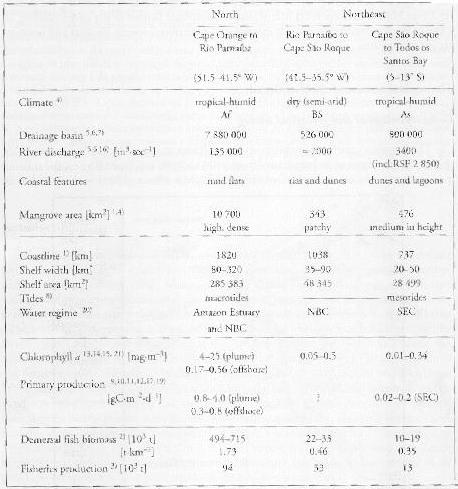
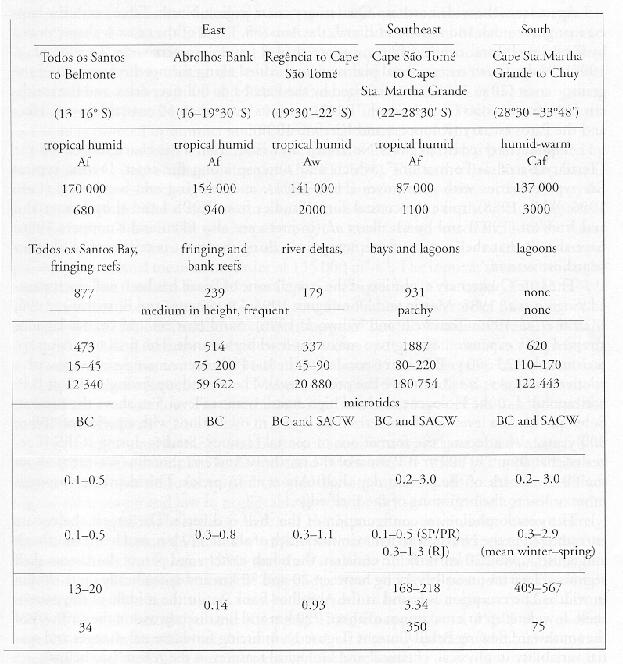
Table 1 summarises quantitative and qualitative information on the physiography, climate (Koeppen Type), fresh water input and habitats of the coastal zone, and some physical and biological (primary productivity and fisheries) features of the coastal, shelf and oceanic waters, for the five geographical regions. The Northeast and East regions are also divided into subsections, due to mainly the nature of the drainage basins, fresh water runoff and the geomorphic configuration and magnitude of primary productivity of the shelf.
Table 1
 |
 |
The main features of the geographical regions are:
North: Late Quaternary plain, Amazon River, high runoff, large mangrove habitat, Amazon dispersal system and wide shelf, moderate to high primary production and fisheries yields.
Northeast: Tertiary Barreiras Formations, low runoff per km of coastline due to dominance of torrential small sized rivers and only high local runoff from two medium sized rivers (Parnaiba and Sao Francisco do Norte), small- river mangrove habitats, fringing reefs, narrow shelf and low primary productivity and fisheries yields.
East: Tertiary formation, north to south gradient/ increase of runoff and sediment yields (i.e small sized rivers in the north and medium sized rivers- deltaic estuaries- towards the south), small-river mangrove habitats, fringing and bank reefs, highly variable shelf width and coastal and oceanic upwelling (Eddies) towards the south.
Southeast: Granitic coast, low to moderate runoff, bays and lagoons, wide shelf, coastal upwelling and moderate to high primary production and fisheries yields.
South: Late Quaternary coast, high local runoff, impact by the La Plata river, wide shelf, coastal upwelling, moderate to high primary production and fisheries yields.
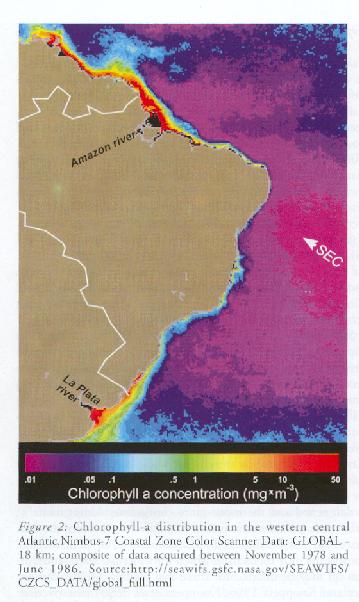
The SeaWifs Image of Figure 2 ( i.e surface distribution of Chlorophyll a) clearly demonstrates the higher productive north and southern regions, affected by high runoff and also coastal upwelling, in contrast to the north-eastern and eastern low productive regions, due to low runoff and material yields and the efficient dilution of coastal waters by the oceanic boundary currents which impinge directly on the coast (Knoppers and Ekau, Eds, 1999, Geo-Marine Letters 19 (3):171-218; Ekau and Knoppers, Eds, 1999, Archive of Fishery and Marine Research 47 (2/3):1-334).
Figure 2
|
Cluster Simulations
Five experiments were at first performed for the entire Brazilian coast (Region 17) in order to discriminate well-defined typological sub-regions. The runs were executed including the Terrestrial, Coastal and Oceanic 1 cells with a large number of variables. Thereafter, cluster results using individual cell types were compared to the multiple cell analysis. The most suitable set with a minimum amount of variables, capable to discriminate the regional typology, was also defined. Further detailed cluster analyses were performed on the individual pre-defined sub-regions with the apparently best set of cells and variables.
All runs are presented relating colours to similarity.
Results
Entire Brazilian Coast (31 Variables)
The first run included the maximum number of variables ( n = 31, click on link to see variables and cluster results), considered as relevant for the typology of the Brazilian region. At first sight, four main regions emerge in both runs, one combining the terrestrial-coastal and oceanic 1 cells and the other for the coastal cell only. This is quite congruent with the general classification of the 5 major Brazilian (terrestrial, coastal and shelf) regions presented in Figure 1 and Table 1. The only slight difference in regional classification was found for the Southeast and southern regions of Brazil. The cluster analysis identified both as one similar region.
Click on the blues for cluster result
The data base includes all types of vegetation cover but not the total forest coverage, which is , when related to either grassland, cropland or bare ground, a prime proxy to check the runoff feature.
Used Variables:
| Variable | Weight |
| TEMP_CRU_ANN_AVG | 1 |
| VAPPRES_ANN_AVG | 1 |
| PRECIP_CRU_TOTAL | 1 |
| AVG_ELEV_BATH | 1 |
| STDDEV_ELEV_BATH | 1 |
| STDDEV_G30VALUE | 1 |
| SUB_BASIN_AREA | 1 |
| SUB_BASIN_POPULATION_DENSITY | 1 |
| SST_MEAN_MONTHLY | 1 |
| SST_INTER_ANNUAL_STDEV | 1 |
| SALINITY_ANN_AVG | 1 |
| SALINITY_GRADIENT | 1 |
| WAVE_HEIGHT | 1 |
| TIDAL_RANGE | 1 |
| RUNOFF_TOTAL_ANN | 1 |
| RUNOFF_INTRA_ANN_STDEV | 1 |
| SUB_BASIN_RUNOFF: on 1 | 1 |
| BASIN_PERCNT_WATER | 1 |
| BASIN_PERCNT_EVGRN_NEED_FOR | 1 |
| BASIN_PERCNT_EVGRN_BROAD_FOR | 1 |
| BASIN_PERCNT_DECID_NEED_FOR | 1 |
| BASIN_PERCNT_DECID_BROAD_FOR | 1 |
| BASIN_PERCNT_MIXED_FOR | 1 |
| BASIN_PERCNT_WOODLAND | 1 |
| BASIN_PERCNT_CLOSED_SHRUB | 1 |
| BASIN_PERCNT_WOODED_GRASS | 1 |
| BASIN_PERCNT_OPEN_SHRUB | 1 |
| BASIN_PERCNT_GRASSLAND | 1 |
| BASIN_PERCNT_CROPLAND | 1 |
| BASIN_PERCNT_BARE_GROUND | 1 |
| BASIN_PERCNT_URBAN | 1 |
The entire Brazil Coast (Five Variables)
After initially using a set of more than 30 variables, a second run of cluster analysis was performed with the best considered set containing five variables to confirm the presence of the 4 coastal regions. The classification of the 4 regions was again confirmed by both approaches, i.e. the first using Terrestrial, Coastal and Oceanic I cells/variables, and the last using only the coastal cell.
However, larger discrepancies were found with respect to the individual cluster results characterising the regions and the quantitative values of the variables. For example, cluster #5 indicates that the average elevation/bathymetry and salinity variables are similar all over (i.e. 100 % populated). To our knowledge this is correct. Nevertherless, this cluster includes erroneous information on the total annual runoff. The runoff refers only to the contribution of two rivers ( 3.57 % populated) or basins which in quantitative terms (i.e. 5922 mm/yr) indicate a three fold higher total annual runoff as compared to the Amazon river ( i.e. 1545,7 mm/yr, cluster #1), which is just impossible. Two data points of cluster #5 are set in the Southeast of Brazil and may be responsible for the caveat.
Furthermore, our interpretations of the clusters were hampered by caveats in labelling, the labels did not reflect the main and highly populated variables discriminating the clusters. The labelling of cluster # 5 indicates " high annual runoff" as a main feature, in spite of the fact that it is only 3.57 % populated. A labelling should refer to the main populated variables at 100 %.
Cluster # 1, clearly deliminates the northern region dominated by the Amazon river. Instead of runoff, which is known to be high, the cluster rather emphasises salinity of the Amazon dispersal system as the main feature. The runoff data sets should be further reviewed. Cluster # 8, defined the regions in a congruent fashion by the temperature, precipitation, elevation/bathymetry and runoff variables.
Note: The two blue dots seem to be database errors (runoff four times greater than Amazon basin)
Regional Cluster Runs
The four main sub-regions defined by the clustering of the entire Brazilian region are:
Region SSE: from Chuí to Cabo Frio
Region E: from Cabo Frio to Salvador
Region NE: from Salvador to São Luiz
Region N: from São Luiz to Cape Orange
The connotations of these sub-regions are found in Table 1.
For each of the above regions, cluster analyses were performed twice:
For each sub-region, cluster analysis was performed using 8 variables:
Variable |
Weight |
| TEMP_CRU_ANN_AVG | 1 |
| PRECIP_CRU_TOTAL | 1 |
| AVG_ELEV_BATH | 1 |
| SST_INTER_ANNUAL_STDEV | 1 |
| SALINITY_ANN_AVG | 1 |
| TIDAL_RANGE | 1 |
| RUNOFF_TOTAL_ANN | 1 |
| RUNOFF_INTRA_ANN_STDEV | 1 |
SSE Region
This region is characterised by a wide Late Quaternary coastal plain, moderate to high river run-off via the Patos lagoon and influence by the La Plata river dispersal system at its southern premises, and coastal upwelling along the entire shelf.The analysis of sub-region SSE by both approaches revealed two further sub-sections, the Southeast and South. This is entirely compatible with the classification of figure 1 and table 1. The sub-sections were discriminated in different clusters mainly by the following variables: salinity average, average elevation/bathymetry, inter-annual standard deviation of SST, followed by tidal range and runoff. One sub-section corresponds to the southernmost Brazilian states (Rio Grande do Sul and Santa Catarina) and the other to the states of the South Brazilian Bight ( Parana, Sao Paulo and Rio de Janeiro).
Click on the links for the cluster results.
E Region
This region is characterised by a marked north-south gradient/increase of run-off from small to a few middle sized rivers. The shelf widens at the central part of this region and largely affects the meandering of the Brazil Current and together with shelf topography generates productive eddies. The coastal waters are efficiently washed out by the Brazil current. Coastal upwelling is a common feature of the southern section of the E region.
The detailed clustering of the E region also defined further sub-sections, not earlier revealed in such a robust fashion by the results of the entire Brazilian region runs. Both approaches indicated more or less three sub-sections for the E region, also in accordance to the classification of table 1. The clusters of all sub-sections were established with most of the variables 100 % populated, with in particular the coastal- oceanic variables in the southern sub-section (coastal upwelling area), the climatic variables and run-off for the other central and northern sub-sections.
Click on the blue links for cluster result
NE Region
This region is characterised by semi-arid climatic conditions in the hinterland and, in general, by low runoff and sparse vegetation. Coastal lagoons and sand dune systems are spiked along the coast. The manifold small sized rivers are, in general, torrential. The cluster analysis exhibited a higher spatial diversity of typological features than expected. Table 1 generally classifies the sub-region into two sub-sections. One at the southern premises including the medium sized Sao Francisco river, characterised by the terrestrial-coastal-oceani1 run by elevation and oceanographic parameters and bad clustering of the climatic variables. At the northern premises, which includes the medium sized Parnaiba river and the macrotidal Sao Luiz Bay, all climatic, coastal and oceanic variables were populated at 100 % . The intermediate region, representing the largest and semi-arid sub-section, with direct coastal impingement of the oligotrophic high saline South Equatorial Current, was clearly defined by the oceanographic variable clusters. The coastal cell run exhibited similar diverse patterns and enhanced the presence of the Sao Francisco river (Cluster # 0, large drainage basin variable), not detected by the multiple cell run.
Click on the blue links for cluster results.
Note: The red dot at the Coastal figure above seems to be a mistake of the value of runoff at the database (sub-basin runoff)
N Region
This region is dominated by the Amazon river basin and its dispersal system which extends far out on the shelf and proliferates parallel to the coast towards and beyond the Guianas (Fig.1, Tab. 1, Fig. 2). The multiple cell run revealed relative homogeneous patterns, with mainly two sub-sections. The colour identifications of the clusters were very similar and thus the exact interpretation difficult to perform. In contrast, the coastal cell run pinpointed more local details, where differences in salinity related to elevation/bathymetry played the major role. However, some of the information on the regional distribution of the tidal patterns were erroneous, particularly at the northern premises of the Amazon river mouth.
Click on the links for cluster results.
Note: the red dot, located behind Marajo island inside the Amazon, reflects a mistake on the database information (basin runoff). Blue and green dots in both figures reflect mistakes in tidal range.
Conclusions
- The cluster analysis with multiple cells (terrestrial-coastal-oceanic1) for the entire Brazilian coast revealed four distinct sub-regions, which fits the conclusions of recent independent works. This fact indicates that the LOICZView approach is a robust method from meso- to macroscales.
- The use of a small set of variables, related mainly with data of climate and the physical regime, yielded similar results when compared with the use of a larger number of variables, including most from the terrestrial cell (i.e. vegetation).
- Sub-regions, with coastal lengths varying from 1000 to 1500 kilometres, were also successfully analysed with the LOICZView program, yielding several sub-sections at length scales of 300 to 500 km. These sub-sections were also confirmed by former works. However, analysis at these smaller scales were more affected by database mistakes. The runoff data base seems to be particularly prone to the lack of regional and also erroneous data for most of Brazil, partucularly the Northeast and East.
- The multiple cell approach, even at the sub-regional scale, defined typological sub-sections as well as with the single cell approach. However, coastal cells pinpointed more details inside the sub-sections.
- The spatial scales seem to be better solved than time scales. The database is insufficiently complete with respect to monthly data. Therefore, all this work was performed using mean annual data.
- The color codes of the LOICZView output are sometimes not sufficiently distinct to ensure decoding of the cluster data, especially when more than 8 clusters are included. This is more