The data were collected and then transformed into a useable and comparable format for analysis.
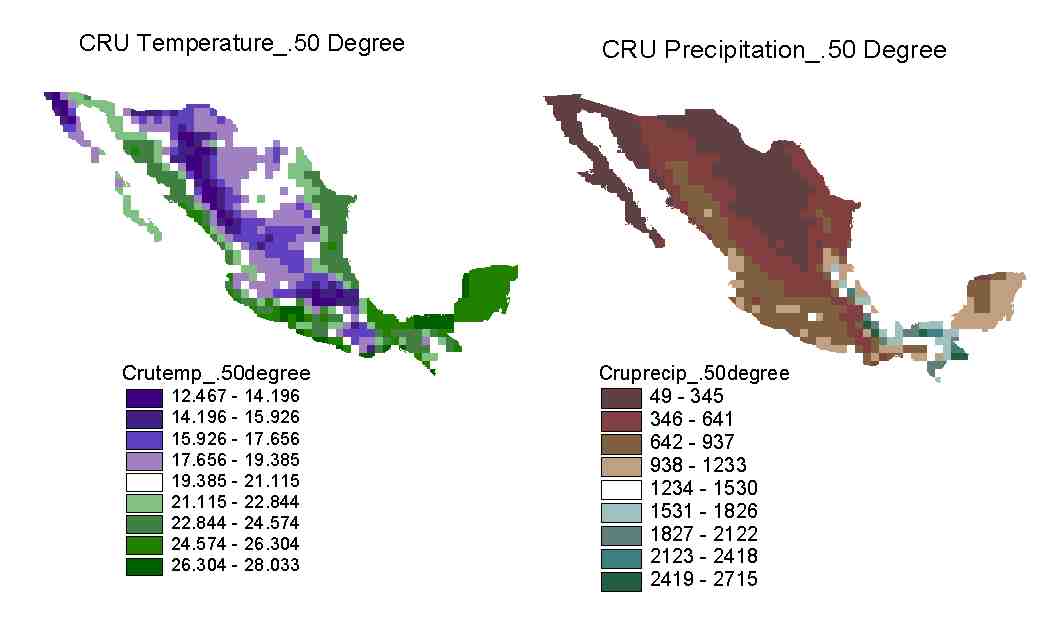
Figure 3: CRU .50-degree globally-available temperature and precipitation
climatologies.
Temperature is in `C, Precipitation is in mm. Colors are arbitrary
and represent a range in values.
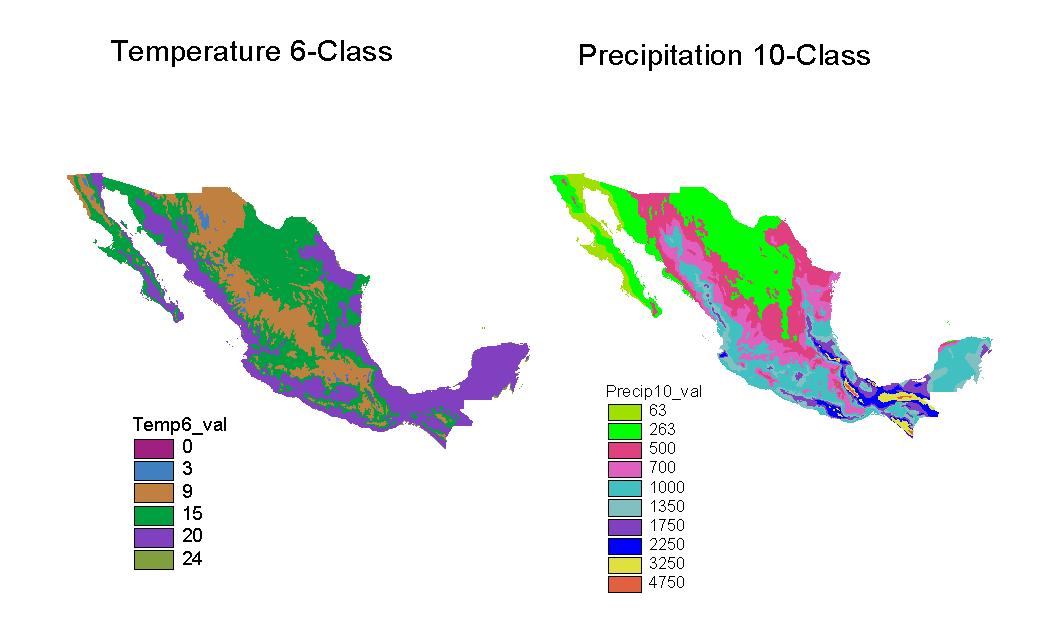
Figure 4: CONABIO .01-degree regionally-available 6-class temperature
and 10-class
precipitation climatologies. Temperature is in `C, Precipitation
is in mm. Colors represent
a range in values. Numbers in the legend represent midpoints
for each range of values.

Figure 5: CONABIO .01-degree regionally-available 15-class temperature
and 19-class
precipitation climatologies. Temperature is in `C, Precipitation is
in mm. Colors represent
a range in values. Numbers in the legend represent
midpoints for each range of values.
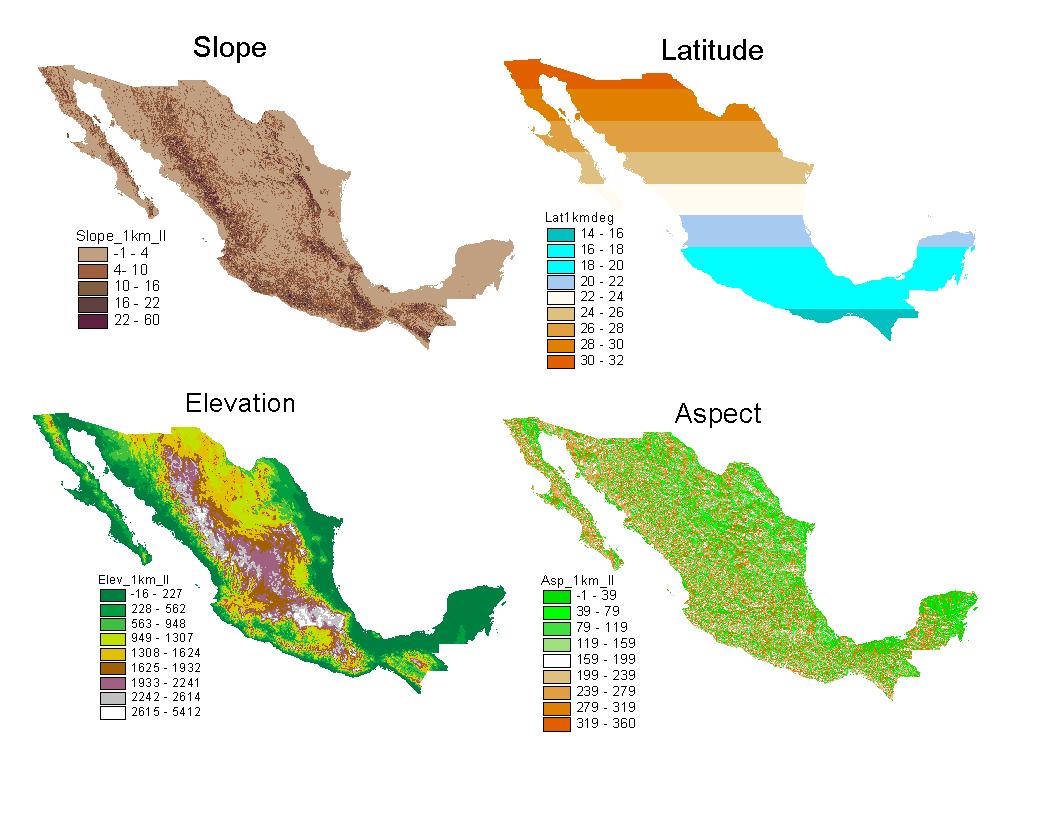
Figure 6: Derived slope, latitude, and aspect, and ETOPO5 elevation
topographies. Slope is in `. Elevation is in m. Aspect is in `.
Colors represent a range in values. Numbers in the legend represent
midpoints for each range of values.
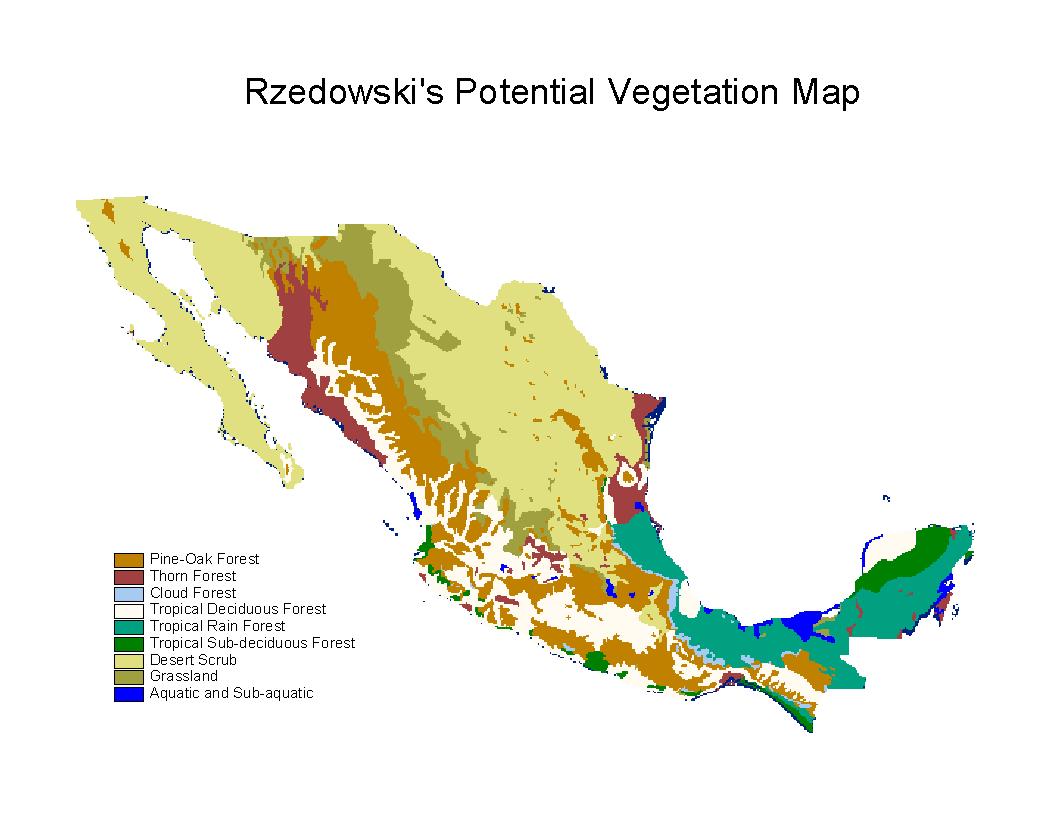
Figure 7: Rzedowskis Potential Vegetation Distribution of Mexico: the
target map for the study.
The Aquatic and Sub-aquatic vegetation class was excluded for the study.